Introduction
Solid state batteries have been identified as an emerging possibility for high density and safe electrochemical energy storage solutions. Much progress has been made to understand the role of ionic conductivity, composition, and structure of solid electrolytes for Li- and Na-based inorganic ion conductors.[Reference Zhang, Shao, Lotsch, Hu, Li, Janek, Nazar, Nan, Maier, Armand and Chen1] A major challenge facing further development of solid state electrolytes is addressing interfacial issues that can occur between the solid electrolyte and active materials. Several strategies have been adapted to reduce interfacial resistance, mostly for garnet-based solid electrolytes including replacing the Li+ blocking lithium layer with the introduction of a Li+ conducting Li3N layer,[Reference Xu, Li, Zhou, Wu, Xin, Li and Goodenough2] deposition of a 20 nm germanium layer to decrease garnet/Li-metal interfacial resistance by alloying,[Reference Luo, Gong, Zhu, Li, Yao, Zhang, Fu, Pastel, Lin, Mo, Wachsman and Hu3] the use of a liquid phase processed Li2SiO3 buffer layer between a garnet and nickel-manganese-cobalt oxide (NMC) interface,[Reference Alexander, Rosero-Navarro, Miura, Tadanaga and Murugan4] and the use of atomic layer deposition to deposit an ultrathin Al2O3 coating on garnet solid electrolytes which demonstrated a decrease in interfacial area specific resistance from 1710 to 1 Ω/cm2.[Reference Han, Gong, Fu, He, Hitz, Dai, Pearse, Liu, Wang, Rubloff, Mo, Thangadurai, Wachsman and Hu5]
An alternative solid state cell design concept starts with the solid electrolyte and current collectors with no active materials initially present in the battery. The battery is activated on the first charge forming the negative and positive active materials in-situ. The benefits of a solid electrolyte which form an anode, separator, and cathode upon charge include fewer cell components during processing and reduced risk of self-discharge before formation of the active battery providing the ability to store the electrolytes for extended periods of time. Previous work involving a self-forming secondary Li/I2 solid state battery is relatively limited. A prior report demonstrated self-formation of Li/I2 with polyvinyl-pyrrolidone additive which included the use of a lithium iodide hydrate that allowed charging but was susceptible to increases in impedance due to solid–electrolyte interphase (SEI) layer formation over time.[Reference Weinstein, Yourey, Gural and Amatucci6] A follow-up report evaluated two strategies in addressing the solid–electrolyte interface including the use of a hydrated lithium iodide starting composite to form a hydrated SEI layer that reduced the formation of “soft shorts,” or included the use of an alloying current collector such as In, Al, and Ga.[Reference Yourey, Weinstein, Halajko and Amatucci7] Separately, the authors reported visualization of the dendritic growth of lithium plating on an interdigitated cell design.[Reference Yourey, Weinstein, Halajko and Amatucci8]
Previously we reported a fully self-forming solid state rechargeable battery based on the Li/I2 couple using a composite lithium iodide/lithium iodide-(3-hydroxypropionitrile)2 (LiI–LiI(HPN)2) solid electrolyte. Proof of concept was demonstrated for a fully self-forming, rechargeable Li/I2 battery with the inclusion of LiI(HPN)2 by open circuit voltage (OCV) stability, identification of the formation of an I2–LiI(HPN)2 complex upon charge, and reduction of the cell impedance as a result of charging the cell.[Reference Abraham, Huang, Smith, Marschilok, Takeuchi and Takeuchi9] The chemistry of the full cell, consisting of an anode, cathode, and separator, self-formed upon initial charge, is described below:
 $${\rm LiI}\to ({\rm 1\ - 2}n){\rm LiI}+{\rm 2}n\;{\rm Li}+{\rm } n{\rm I}_{\rm 2}$$
Herein, the role of the solid electrolyte–current collector interface is investigated with an LiI–LiI(HPN)2 solid electrolyte in a self-forming cell configuration. Characterization of the solid electrolyte component prior to activation is provided by scanning electron microscopy (SEM) and energy dispersive spectroscopy (EDS). Characterization after activation was conducted using x-ray diffraction (XRD) of both the positive and negative interfaces of the solid electrolyte. Increases in Coulombic efficiency of ~2× after multiple cycles were observed by incorporating thin Li metal into the negative electrode side of the solid–electrolyte interface. This self-forming Li/I2 battery system is appealing for systems requiring high-energy density and safe function with low power requirements, including applications in implantable medical devices, power sources for long-life sensors, as well as backup power for electronics.
Experimental
Lithium iodide-(3-hydroxypropionitrile)2 (LiI(HPN)2) was synthesized following a previous report[Reference Wang, Wang, Li, Meng and Chen10] where LiI and 3-hydroxypropionitrile were combined via heating in a molar ratio of 1:2. The capacity of the active material of the cells was determined by considering only the capacity contribution of LiI as active material, and does not take into account any capacity contribution from the LiI(HPN)2 additive. The synthesized LiI(HPN)2 was combined with lithium iodide (LiI) following a previously reported procedure to form composite solid electrolytes.[Reference Abraham, Huang, Smith, Marschilok, Takeuchi and Takeuchi9] Coin-type cells were constructed using the composite solid electrolytes (either 86% LiI/14% LiI(HPN)2 or 80% LiI/20% LiI(HPN)2 (by mass)) with a diameter of 10 mm and an average thickness of 0.4 mm. Cells were fabricated using either stainless-steel (ss) or gold (Au) current collectors. For cells with an additional Li interface, thin lithium metal (~70 µm) was used between the solid electrolyte and the current collector on the negative electrode side. Thin Li foil was punched using a hollow punch and attached to a stainless-steel current collector. A wire bristled brush was used to remove any residual oxide layer as well as ensure even contact between the current collector–Li and the Li–solid electrolyte interfaces. The lithium was stacked with the solid electrolyte prior to crimping the cell. Cells were crimped for 30 s to ensure even crimping. Electrochemical impedance spectroscopy (EIS) was obtained in a frequency range of 1 MHz to 1 Hz at 30 °C. Galvanostatic cycling with potentiostatic limitation for charge and discharge cycles was collected using constant current normalized per surface area of the electrode. All cell testing was performed using a BioLogic VSP. All materials handling and processing was performed within a dry room (dewpoint −40 °C) and cell assembly was carried out within an argon-filled inert atmosphere glovebox maintained at <5 ppm O2 and <0.5 ppm H2O.
Solid electrolyte characterization
SEM and EDS data were obtained using a JEOL 6010Plus instrument, with backscattering electron (BSE) images acquired at 10 kV, secondary electron images SEI and EDS data obtained at 20 kV. EDS data were collected using a pre-set value of 60 s for ten scans on pristine 80 LiI–20 LiI(HPN)2 solid electrolytes. X-ray diffraction data were collected using a Rigaku Miniflex on a pristine or charged 80 LiI–20 LiI(HPN)2 solid electrolyte from 10 to 90° 2θ.
Results and discussion
SEM characterization of pristine and charged solid electrolyte
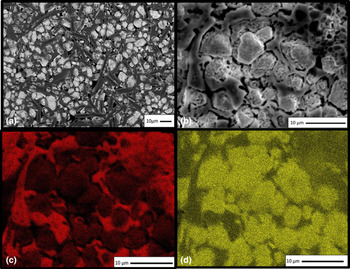
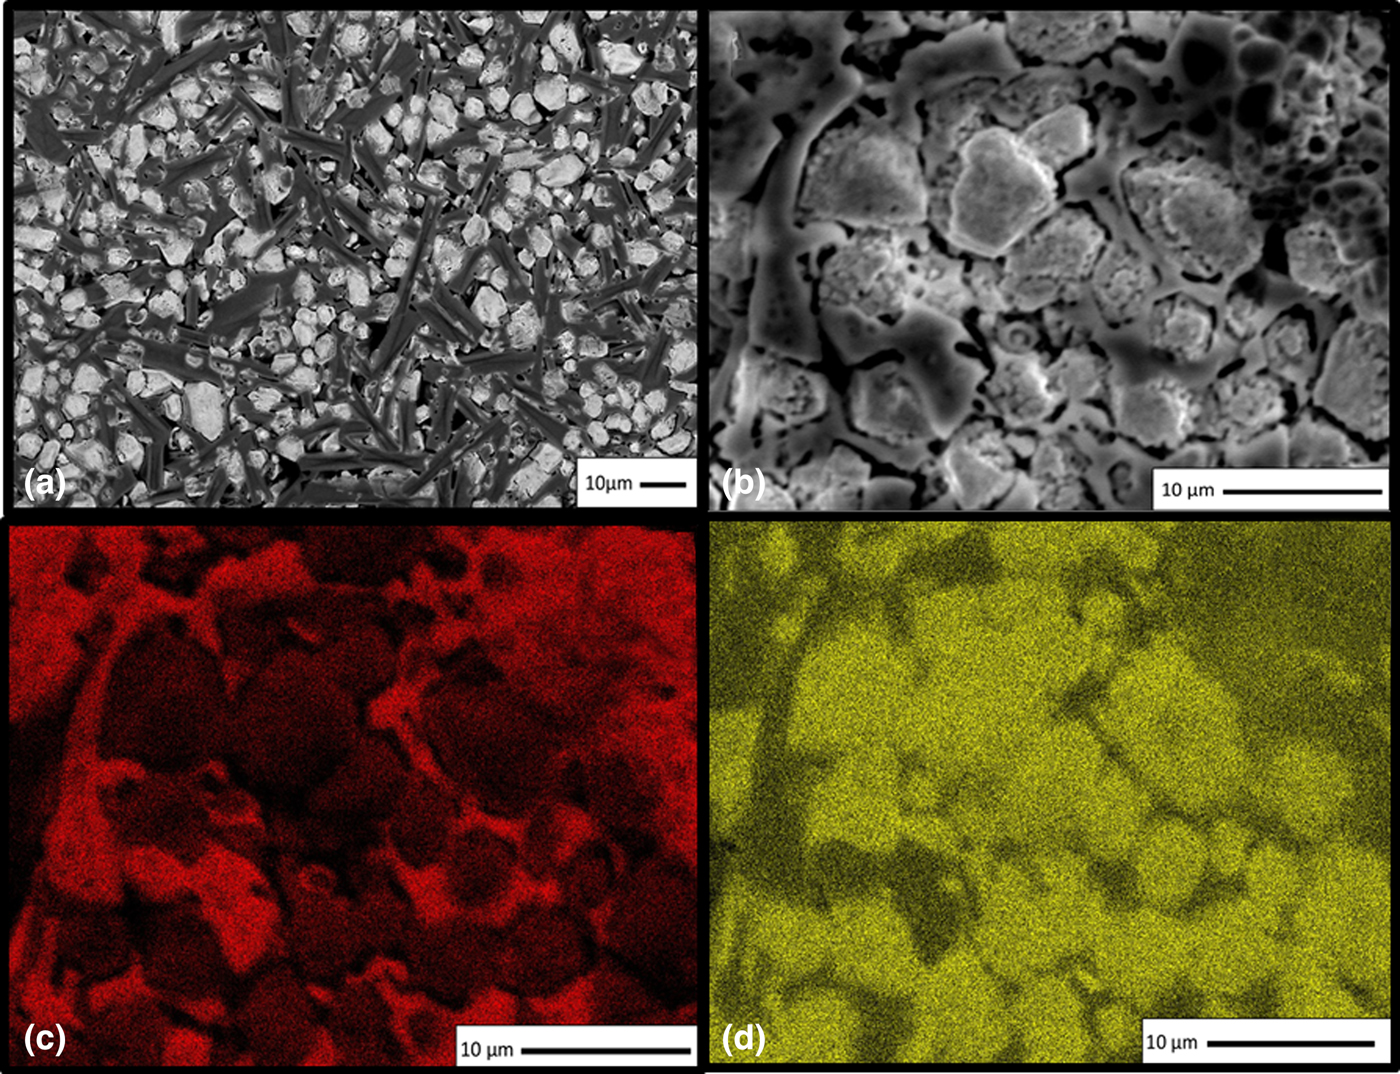
SEM data were collected to observe the surface homogeneity of the pristine 80 LiI–20 LiI(HPN)2 solid electrolyte, Fig. 1. BSE images showed the morphology of the composite with uniformly distributed LiI(HPN)2 rods and 5–6 µm aggregates of LiI particles, Fig. 1(a). EDS was used to identify the carbon in LiI(HPN)2, chemical formula LiI(C3H5NO)2, and differentiate from the more iodine-rich LiI. Figure 1(b) shows the area selected for EDS mapping of carbon (C) and iodine (I), shown in Figs. 1(c) and 1(d), respectively. It was found that the carbon provided the framework for the rod structure of LiI(HPN)2 [Fig. 1(c)] while the iodine, primarily as LiI, formed the particle structure [Fig. 1(d)]. Thus, SEM characterization demonstrated the formation of an integrated composite LiI–LiI(HPN)2 solid electrolyte.
SEM of pristine LiI–LiI(HPN)2 composite solid electrolyte: (a) backscatter image, (b) secondary electron image, and EDS maps of (c) carbon and (d) iodine.
After charging the solid electrolyte to 58% of its theoretical capacity, SEM and BSE images and EDS maps were acquired on both sides, cathode, and anode, Figs. S1 and S2 respectively, of the charged LiI-LiI(HPN)2 composite solid electrolyte. The SEM and BSE images indicate significant changes in particle shape and sizes after electrochemical charge (Figs. S1A-B and S2A-B), with more integrated carbon (C) and iodine (I) evident in the EDS maps on both sides of the charged electrode (Figs. S1C-D and S2C-D) compared with the pristine electrode [Figs. 1(c)–1(d)].
XRD characterization of pristine and charged solid electrolyte
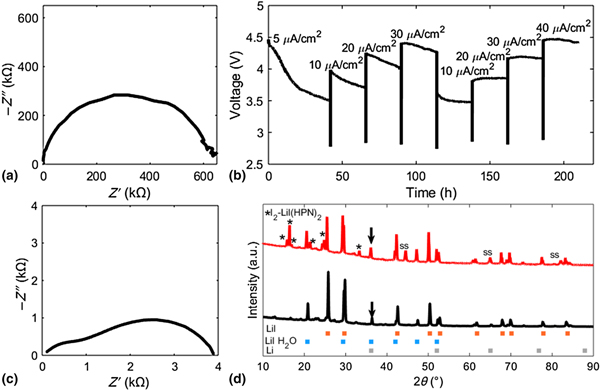
X-ray diffraction patterns were first obtained on an as prepared 80 LiI–20 LiI(HPN)2 uncharged solid electrolyte, where both positive and negative facing sides of the solid electrolyte are equivalent in composition. Initially, synthesized LiI(HPN)2 was matched to previously reported single-crystal data which was assigned as LiI(HPN)2 with a monoclinic structure.[Reference Wang, Li, Xue, Wang, Meng and Chen11] The incorporation of LiI to form the composite 80 LiI–20 LiI(HPN)2 solid electrolyte introduced additional peaks, including peaks at 29.6°, 42.5°, and 50.4° 2θ that were attributed to LiI (ICSD #27983).[Reference Liu, Shadike, Ding, Sang and Fu12] The presence of lithium iodide monohydrate (LiI·H2O) (PDF# 00-019-0720) was also observed in the pristine composite electrolyte with distinct peaks at 20.7° and 47.3° 2θ. It is notable to point out the position of several other LiI·H2O peaks that overlap with the peak position of the Li (PDF# 00-001-0592) metal reference pattern at 36.1° and 52.5° 2θ. These peak positions where Li overlaps with LiI·H2O are observed in the pristine composite electrolyte [Fig. 2(d)] and had an increase in peak intensity upon charging. Since an increase in peak intensity upon charging was not readily observed with other LiI·H2O peaks, this increase in intensity could be potentially attributed to Li metal formation upon charging.
AC impedance of solid electrolyte in coin cell configuration before (a) and after (c) charging. Voltage profile of step-wise charging of solid electrolyte at varied current densities (5, 10, 20, 30, 10, 20, 30, and 40 µA/cm2). XRD pattern of solid electrolyte before (black) (b) and after (red) charging (d) to 58% SOC.
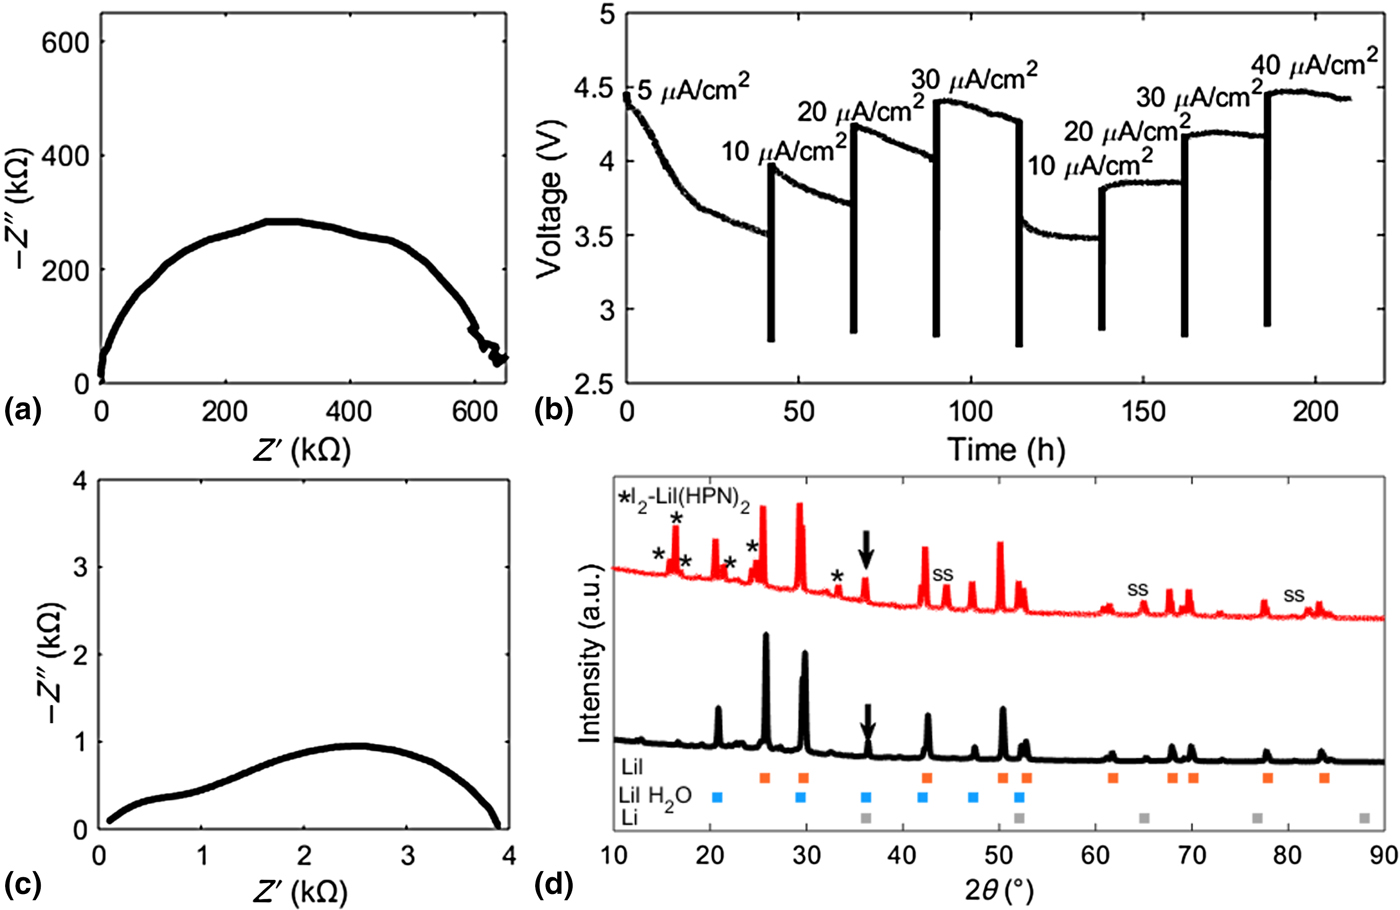
After initial XRD of the pristine solid electrolyte, the cells were charged to 58% of theoretical capacity (93 mAh/g) after eight sequential charging steps. A current density of 5 µA/cm2 was used initially to form the Li metal anode and I2–LiI(HPN)2-based cathode. Upon charging to 58% total capacity, during a pause before the next charging step, the OCV was 2.78 V, denoting formation of discrete anode and cathode components, similar to the expected Li/I2 OCV observed in prior reports.[Reference Weinstein, Yourey, Gural and Amatucci6,Reference Abraham, Huang, Smith, Marschilok, Takeuchi and Takeuchi9,Reference Liu, Liu, Zhan, Fu and Li13] In subsequent charging steps the current density was gradually increased over seven additional charge steps to 40 µA/cm2 [Fig. 2(b)]. The benefit of the initial 5 µA/cm2 charge step can be seen in the 1 V decrease in overpotential during the initial charging step. As the anode and cathode components are formed during the initial charge, the decrease in polarization during each charge step allowed for an eightfold increase in current density during the charge test. The reduced overpotential relative to the highest current density (40 µA/cm2) can also be correlated with the ~160× reduction in impedance from the initial value of 635 to 3.88 kΩ after the stepwise charging [Figs. 2(a) and 2(c)]. XRD characterization of the charged solid electrolyte was obtained on both anode and cathode sides of the solid electrolyte, with Fig. 2(d) showing the pattern where the negative side of the pellet faced the x-ray. There was no observed difference in intensity between the diffraction pattern of the anode and cathode sides, attributed to penetration of the x-rays through the solid electrolyte during both measurements. Notably, the peak at 36.1° 2θ which only corresponds to the lithium monohydrate and/or the Li metal peak increases in relative intensity post charge as noted by the arrow [Fig. 2(d)] suggesting successful formation of lithium metal. Additional peaks were observed at 16°, 24°, and 33° 2θ that correspond to the presence of an I2–LiI(HPN)2 complex, consistent with the previously reported diffraction pattern.[Reference Liu, Liu, Zhan, Fu and Li13] The observance of these peaks indicates formation of an I2-based cathode upon charging.
Comparison of stainless-steel–stainless-steel and stainless-steel–Li interfaces
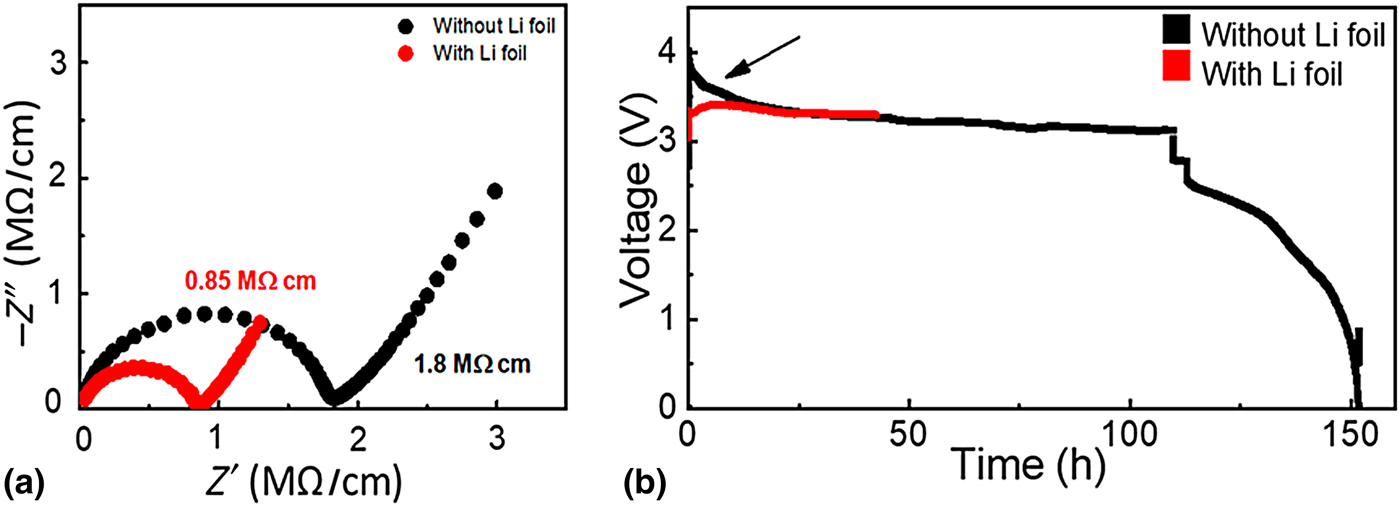
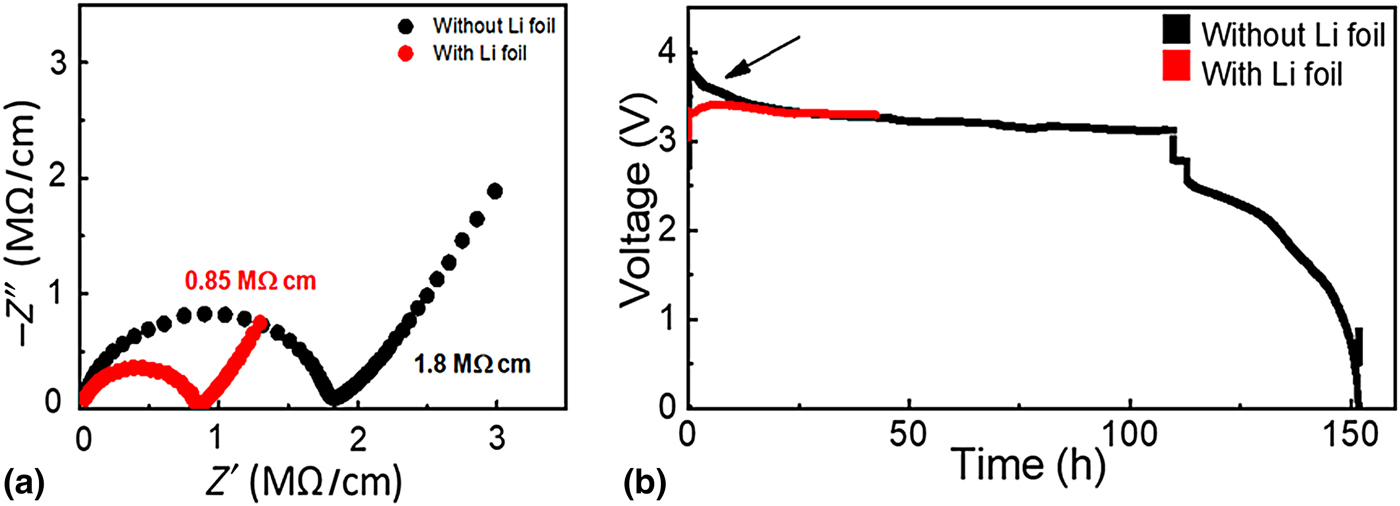
Coin cells were constructed with 86 LiI–14 LiI(HPN)2 solid electrolytes where cells either contained a stainless-steel current collector at the negative and positive interfaces, or the addition of a thin (~70 µm) layer of Li foil at the negative interface. Before charging, EIS was obtained, and the cell without Li foil had an impedance value that was >2× that of the Li foil containing cell (1.8 MΩ/cm for the ss–ss only cell compared with 0.85 MΩ/cm for the Li-containing cell) [Fig. 3(a)]. Initially the cells are activated by a charge step, where they were charged at constant current (10 µA/cm2) to 5% state of charge (SOC). As noted by the arrow in Fig. 3(b), upon charging there is a notable difference in overpotential observed between the cell constructs with and without the added Li foil. The Li foil containing cell showed a charge potential of around 3.3 V, with a fairly horizontal plateau. In comparison, the cell containing the same solid electrolyte, but without any external Li foil had a larger overpotential reaching ~4 V, before reaching a similar voltage under charge as the cell with Li foil after ~0.70% charge. Thus, with charge of ~0.70%, the overpotential of the two cell designs was the same with or without the incorporation of lithium foil.
(a) Pre-charge impedance comparison of solid electrolyte with stainless-steel and Li–stainless-steel interfaces. (b) Comparison of overpotential of cells.
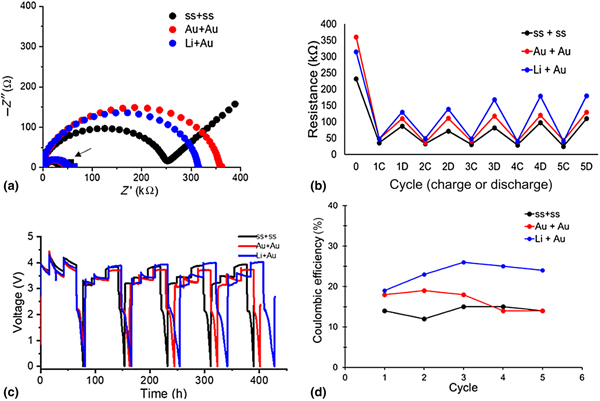
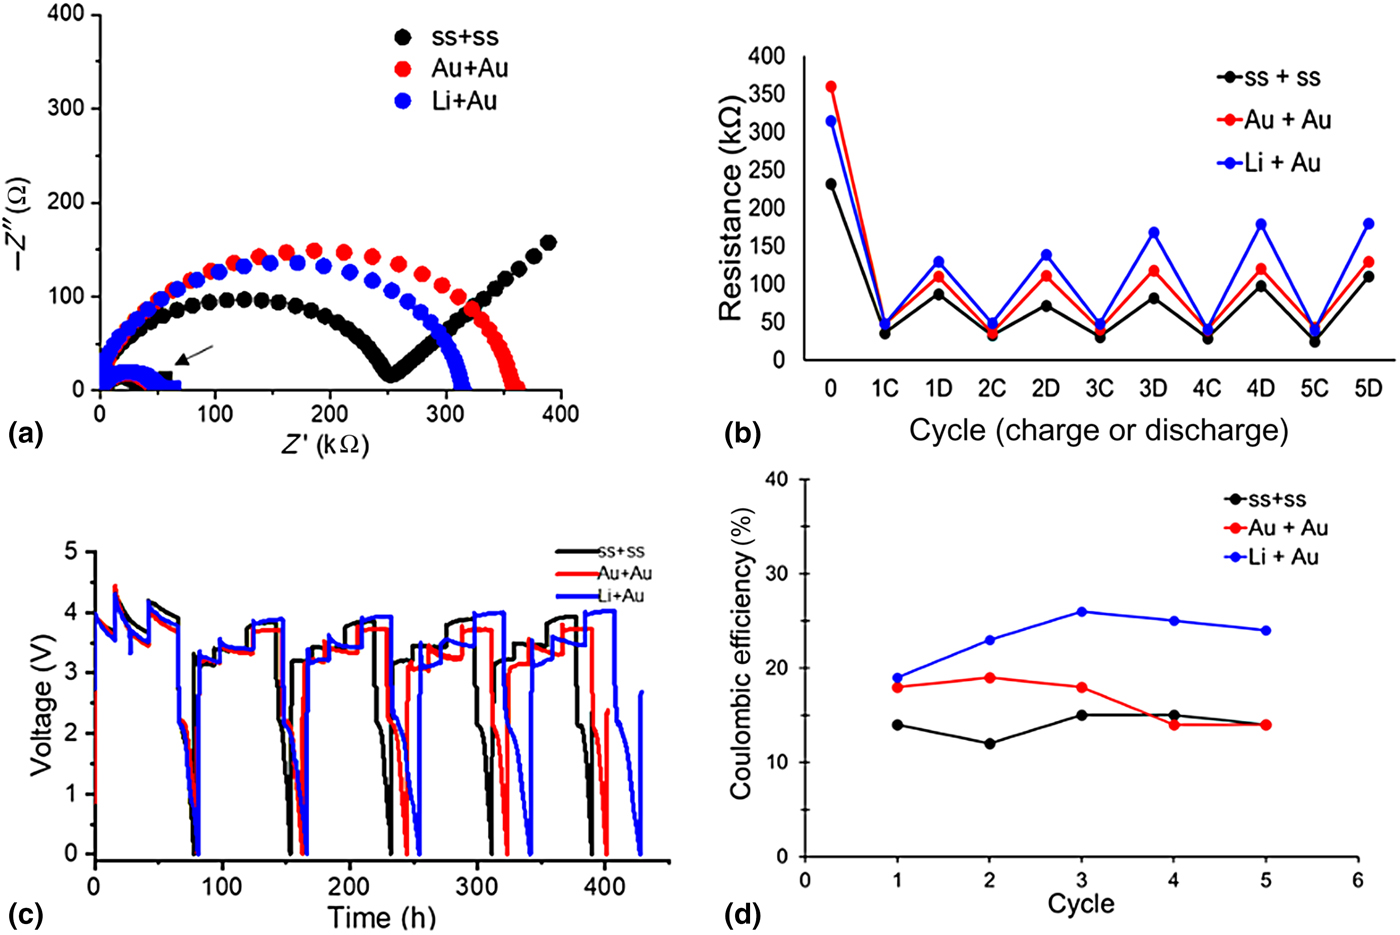
A new set of cells containing the 80 LiI–20 LiI(HPN)2 were fabricated with either stainless–stainless (ss–ss) (anode–cathode), gold–gold, or Li–gold interfaces. AC impedance was obtained before charge [Fig. 4(a)], and after charging to 5% capacity (0.63 mAh) [Fig. 4(a), post-charge denoted by an arrow]. Before charging, cells both with and without Li foil had an impedance in the kΩ range, and a typical variation in pre-charge impedance with ss–ss interfaces ranged from 200 to 300 kΩ before charge. Cells were tested by step-wise charging, where they were charged at 5, 10, and 20 µA/cm2 then discharged at 10 µA/cm2 to 0.1 V for a total of five charge–discharge cycles. The resistance (in kΩ) was shown as a function of charge or discharge with respect to the cycle number [Fig. 4(b)]. The resistance shown in Fig. 4(b) was determined from AC impedance measurement, where the resistance value was obtained from the low frequency x-axis intercept of the Nyquist plots. All three cell configurations showed a reduction in resistance upon the first charge, with a gradual increase of resistance upon subsequent discharge cycles. An interesting trend was observed regarding the charge and discharge resistances reported beginning with the first charge cycle [Fig. 4(d)]. Upon initial charge, the cell containing stainless-steel current collectors had a near sixfold reduction in resistance, compared with an ~6.5-fold reduction for the cell that contained a lithium foil and single gold interface (Li + Au), and a ~7.5-fold reduction for the cell construction with two gold interfaces (Au + Au). Upon discharge, all three cell designs returned to much lower resistance compared with their initial resistance values, yet higher than the values when charged. Over the course of the following four charge-discharge cycles, the post charge resistance returned near to the original value for each of the three cell constructions [with cycle 5 being within 10–17% of the original (cycle 1) charge values]. However, the cells varied much more noticeably between cycle 1 and cycle 5 on their reported discharge resistances [within 15–29% of the original (cycle 1) discharge value]. Interestingly, among the tested cells, the cells with the lithium and gold interfaces had the highest Coulombic efficiency even though the resistance on discharge was the highest among the group [Fig. 4(d)]. These results imply that there is some loss of active lithium in the cell charge process leading to inefficiency that is offset by inclusion of supplemental lithium metal in the cell design.
(a) Pre-charge AC impedance and impedance after 5% charge (arrow). (b) Comparison of resistance as a function of charge or discharge cycle. (c) Voltage versus time curves of step-wise charging of cells for five charge–discharge cycles. (d) Comparison of Coulombic efficiency for each cycle.
Conclusion
Herein, we explored interface effects of varying the solid electrolyte–current collector interface using either stainless-steel, gold, or Li metal. The addition of Li metal improved the Coulombic efficiency of the HPN containing LiI solid electrolytes. The addition of Li metal to the anode interface contributed to a reduced overpotential observed during the initial charge step.
The addition of a Li source increased the Coulombic efficiency by nearly a factor of two compared with the cells without Li foil, in spite of higher observed resistance after discharge. The results imply that there is some loss of active lithium over repeated charge/discharge cycles.
Supplementary material
The supplementary material for this article can be found at https://doi.org/10.1557/mrc.2019.42
Acknowledgments
This work was supported by the U.S. Department of Energy Office of Energy Efficiency and Renewable Energy under the Advanced Battery Materials Research program, award DE-EE0007785. Alyson Abraham and Mikaela Dunkin acknowledge support from the Graduate Assistance in Areas of National Need Fellowship. Bingjie Zhang thanks David Bock for helpful suggestions regarding SEM sample preparation. Esther Takeuchi acknowledges the generous support of William and Jane Knapp as the Jane Knapp Chair of Energy and the Environment.