INTRODUCTION
Humans are constantly engaged in searching for visual information in the world around them (Mort & Kennard, Reference Mort and Kennard2003). Being able to perform complex daily activities such as driving or spatial orientation is highly dependent on the quality of visual search (Shinoda, Hayhoe, & Shrivastava, Reference Shinoda, Hayhoe and Shrivastava2001). Brain damage could lead to disturbed search organization (Rabuffetti et al., Reference Rabuffetti, Farina, Alberoni, Pellegatta, Appollonio, Affanni and Ferrarin2012; Ten Brink, Van der Stigchel, Visser-Meily, & Nijboer, Reference Ten Brink, Van der Stigchel, Visser-Meily and Nijboer2016), which is related to difficulties in daily life activities (Machner, Sprenger, Sander, et al., Reference Machner, Sprenger, Sander, Heide, Kimmig, Helmchen and Kömpf2009). Deficits in search organization are, therefore, important to detect in clinical populations.
Measures to detect potential search organization deficits are generally not used in clinical practice. However, object cancellation tests—frequently used in standard neuropsychological assessment, especially to detect visuospatial neglect—are suitable to measure search organization (Dalmaijer, Van der Stigchel, Nijboer, Cornelissen, & Husain, Reference Dalmaijer, Van der Stigchel, Nijboer, Cornelissen and Husain2014; Huang & Wang, Reference Huang and Wang2008; Ten Brink, Van der Stigchel, et al., Reference Ten Brink, Van der Stigchel, Visser-Meily and Nijboer2016; Woods & Mark, Reference Woods and Mark2007). During such tests, participants have to mark multiple targets on a template. The total number of missed targets is used as an indication for deficits in visual perception and attention, whereas the difference in omitted targets between the left and right side of the stimulus field can be used as an indication for lateralized inattention (Wilson, Cockburn, & Halligan, Reference Wilson, Cockburn and Halligan1987).
Measures that provide insight in the degree of search organization, however, can also be extracted from such tests. Search organization measures during cancellation include the number of path crossings, consistency and distance. The number of path crossings between consecutive cancelled targets (i.e., intersections rate), for example, can be used as an indication of the degree of disorganized search. Another measure of search organization regards the consistency of the overall search pattern (i.e., best r), which indicates whether one searched in the same direction throughout the test, for example in a columnar manner or row after row. Finally, the average distance between consecutive cancelled targets can be computed, with a lower distance reflecting more organized search compared to a higher distance between targets (Dalmaijer et al., Reference Dalmaijer, Van der Stigchel, Nijboer, Cornelissen and Husain2014; Mark, Woods, Ball, Roth, & Mennemeier, Reference Mark, Woods, Ball, Roth and Mennemeier2004; Rabuffetti et al., Reference Rabuffetti, Farina, Alberoni, Pellegatta, Appollonio, Affanni and Ferrarin2012; Ten Brink, Van der Stigchel, et al., Reference Ten Brink, Van der Stigchel, Visser-Meily and Nijboer2016).
In the current study, we aimed to unravel the cognitive functions associated with search organization during cancellation in stroke patients. Whereas healthy participants typically show organized, symmetrical search patterns (Huang & Wang, Reference Huang and Wang2008; Rabuffetti et al., Reference Rabuffetti, Farina, Alberoni, Pellegatta, Appollonio, Affanni and Ferrarin2012; Samuelsson, Hjelmquist, Jensen, & Blomstrand, Reference Samuelsson, Hjelmquist, Jensen and Blomstrand2002; Warren, Moore, & Vogtle, Reference Warren, Moore and Vogtle2008), stroke patients tend to search less organized (Chatterjee, Mennemeier, & Heilman, Reference Chatterjee, Mennemeier and Heilman1992; Donnelly et al., Reference Donnelly, Guest, Fairhurst, Potter, Deighton and Patel1999; Ten Brink, Van der Stigchel, et al., Reference Ten Brink, Van der Stigchel, Visser-Meily and Nijboer2016). More specific, stroke patients with right hemispherical damage are more likely to exhibit disorganized visual search during cancellation compared to patients with left hemispherical damage (Rabuffetti et al., Reference Rabuffetti, Farina, Alberoni, Pellegatta, Appollonio, Affanni and Ferrarin2012; Ten Brink, Biesbroek, et al., Reference Ten Brink, Biesbroek, Kuijf, Van der Stigchel, Oort, Visser-Meily and Nijboer2016; Weintraub & Mesulam, Reference Weintraub and Mesulam1988). The cognitive processes associated with search organization, as measured with intersections rate and best r, are, however, largely unknown. Knowledge regarding the associations between measures of search organization and common neuropsychological tests is potentially helpful in interpretation of impairment of established cognitive domains and the association to, in this case, quality of visual search.
We evaluated the association between intersections rate and best r with other cognitive domains that were measured by means of clinically validated neuropsychological tests. To address this aim, we performed exploratory factor analyses with a sample of stroke patients as, in addition to the aforementioned clinical value, we expected sufficient variation across test performances compared to, for example, a sample of healthy subjects. We focused on intersections rate and best r, as they appear to be sensitive to measure search organization in a stroke population (Rabuffetti et al., Reference Rabuffetti, Farina, Alberoni, Pellegatta, Appollonio, Affanni and Ferrarin2012; Ten Brink, Van der Stigchel, et al., Reference Ten Brink, Van der Stigchel, Visser-Meily and Nijboer2016), and have high convergent validity (Woods & Mark, Reference Woods and Mark2007). We did not include the average distance, as this measure is additionally influenced by the direction of search next to the organization of search (Ten Brink, Van der Stigchel, et al., Reference Ten Brink, Van der Stigchel, Visser-Meily and Nijboer2016).
Prior studies suggest an association between neglect and disorganized search (Rabuffetti et al., Reference Rabuffetti, Farina, Alberoni, Pellegatta, Appollonio, Affanni and Ferrarin2012; Samuelsson et al., Reference Samuelsson, Hjelmquist, Jensen and Blomstrand2002; Ten Brink, Van der Stigchel, et al., Reference Ten Brink, Van der Stigchel, Visser-Meily and Nijboer2016), although this association has not always been reported (Mark et al., Reference Mark, Woods, Ball, Roth and Mennemeier2004). We included cancellation and line bisection (LB) tests, the most commonly used tests to measure neglect (Ferber & Karnath, Reference Ferber and Karnath2001), and observations of neglect in activities of daily living (ADL). Related to neglect is the quality of visual perception and construction, which might be important for search organization (Mark et al., Reference Mark, Woods, Ball, Roth and Mennemeier2004). To assess visual perception and construction, we included the Rey Complex Figure Test (RCFT). Furthermore, we included a test that is closely related to visual search (Singh et al., Reference Singh, Fridriksson, Perry, Tryon, Ross, Fritz and Herter2017), but also executive functioning: the Trail Making Test (TMT). Although the TMT and cancellation test both measure visual search, the TMT regards search speed instead of organization.
Next, search organization might relate to executive functioning, since it would require some form of planning (Dalmaijer et al., Reference Dalmaijer, Van der Stigchel, Nijboer, Cornelissen and Husain2014; Mark et al., Reference Mark, Woods, Ball, Roth and Mennemeier2004). Executive functioning, however, entails several subfunctions. We included tests that measure (among other functions) spatial planning and rule learning (i.e., Tower Test and Brixton Test). We did not necessarily expect an association between disorganized search and these higher-order executive functions. An association between visual search and (spatial) working memory has, however, been described (lesion: Humphreys & Chechlacz, Reference Humphreys and Chechlacz2015; Ten Brink, Biesbroek, et al., Reference Ten Brink, Biesbroek, Kuijf, Van der Stigchel, Oort, Visser-Meily and Nijboer2016; behavior: Singh et al., Reference Singh, Fridriksson, Perry, Tryon, Ross, Fritz and Herter2017). As our study was retrospective, the choices of the neuropsychological tests were restricted to the available data. No measures of visuospatial working memory were available. Instead, measures of short-term auditory memory and verbal working memory were included to test potential associations with the memory domain in general.
In all our selected neuropsychological tests (except the verbal memory tests), a motor response was required. We, therefore, reran analyses in patients with high arm motor strength to evaluate whether associations were not distorted by impaired motor functioning. Finally, a right-hemisphere dominance exists for visuo-perception and spatial attention. Analyses were, therefore, repeated for subgroups based on lesion side, to gain additional insight in underlying cognitive processes of search organization within these subgroups.
METHODS
Participants
We retrospectively used routinely collected data of stroke patients who were admitted for inpatient rehabilitation in De Hoogstraat Rehabilitation center, The Netherlands, between November 2011 and June 2017. Inclusion criteria for the current study were: (1) clinical diagnosed symptomatic stroke, first or recurrent; (2) unilateral lesion (to be able to perform sub analyses with left and right hemisphere patients); (3) age of at least 18 years; (4) data on the shape cancellation test (SC) available; and (5) data on at least four of the selected tests available. Patients were excluded when the neglect screening and neuropsychological assessment were administered with more than two weeks in between, as spontaneous neurobiological recovery and/or acquired compensation strategies during cognitive rehabilitation might lead to discrepancies in performance.
Procedure and Tests
At admission, the rehabilitation physician noted age, sex, level of education, stroke date, stroke history (first, recurrent), etiology (ischemic, hemorrhagic, subarachnoid hemorrhage), hemisphere of stroke (left, right, bilateral), Mini-Mental State Examination (MMSE) or Montreal Cognitive Assessment (MoCA), presence of language communication deficits (“Stichting Afasie Nederland” score; SAN), Motricity Index, and Barthel Index.
Patients were invited for a neglect screening and a neuropsychological assessment as part of usual care. During the neglect screening, a SC and LB were administered. Additionally, patients’ behavior during basic activities of daily living was observed and scored by a nurse (Catherine Bergego Scale; CBS). Regarding the neuropsychological assessment, we selected the Balloons Test as an additional measure for neglect, the RCFT copy for visuospatial perception and construction, the TMT-A for psychomotor speed, the TMT-B for executive functioning/working memory, the Tower Test for spatial planning, the Brixton Test for rule learning, and the Digit Span for short-term auditory memory (Forward; DSF) and verbal working memory (Backward; DSB). These tests were selected as they: (a) reflect different cognitive functions, so the major cognitive domains are represented; and (b) were assessed most frequently, resulting in a relatively large group of patients who performed at least four tests. Due to limited taxability, fatigue, or verbal impairments, not all tests were administered in each patient.
The research and consent procedures were performed in accordance with the standards of the Declaration of Helsinki and the research protocol was approved by the Ethics Committee of De Hoogstraat Rehabilitation.
Demographic and clinical characteristics
Education level was assessed using seven categories of a Dutch classification system, according to Verhage, 1 being the lowest (less than primary school) and 7 being the highest (academic degree) (Verhage, Reference Verhage1964).
Global cognitive functioning was screened with either the MMSE (Folstein, Folstein, & McHugh, Reference Folstein, Folstein and McHugh1975) or the MoCA (Nasreddine et al., Reference Nasreddine, Phillips, Bédirian, Charbonneau, Whitehead, Collin and Chertkow2005). Both tests globally assess cognitive functioning. Scores range from 0 (no items right) up to 30 (all items right). We converted MMSE scores into MoCA scores to create a single, pooled MoCA score. We applied the following formula: MoCA = (1.124 * MMSE) – 8.165 (Solomon et al., Reference Solomon, DeBros, Budson, Mirkovic, Murphy and Solomon2014).
The quality of communication was measured with the SAN (Deelman, Koning-Haanstra, Liebrand, & van den Burg, Reference Deelman, Koning-Haanstra, Liebrand and van den Burg1981). Scores range from 1 (no communication through language possible) to 7 (speech and understanding of language are unimpaired).
Motor strength for the upper and lower extremity was assessed with the Motricity Index (Collin & Wade, Reference Collin and Wade1990), a short 3-item test to assess the loss of strength in a limb. Scores range from 0 (no activity, paralysis) up to 33 (maximum normal muscle force) for each extremity. In the case of 99 points, one point is added to reach a total score of 100.
Functional independence was measured with the Barthel Index (Collin, Wade, Davies, & Horne, Reference Collin, Wade, Davies and Horne1988), which measures the extent to which patients can function independently in their ADL. Scores range from 0 (completely dependent) up to 20 (completely independent).
Neglect screening
Shape cancellation
The digitized SC consisted of 54 small targets (0.6° × 0.6°), 52 large distractors, and 23 words and letters (widths ranging from 0.95° to 2.1° and heights ranging from 0.45° to 0.95°), presented on a computer monitor (Van der Stoep et al., Reference Van der Stoep, Visser-Meily, Kappelle, de Kort, Huisman, Eijsackers and Nijboer2013). The stimulus presentation was approximately 18.5° wide and 11° high. Patients were instructed to click on all targets. After each mouse click, a small circle appeared at the clicked location and remained on the screen. No time limit was given.
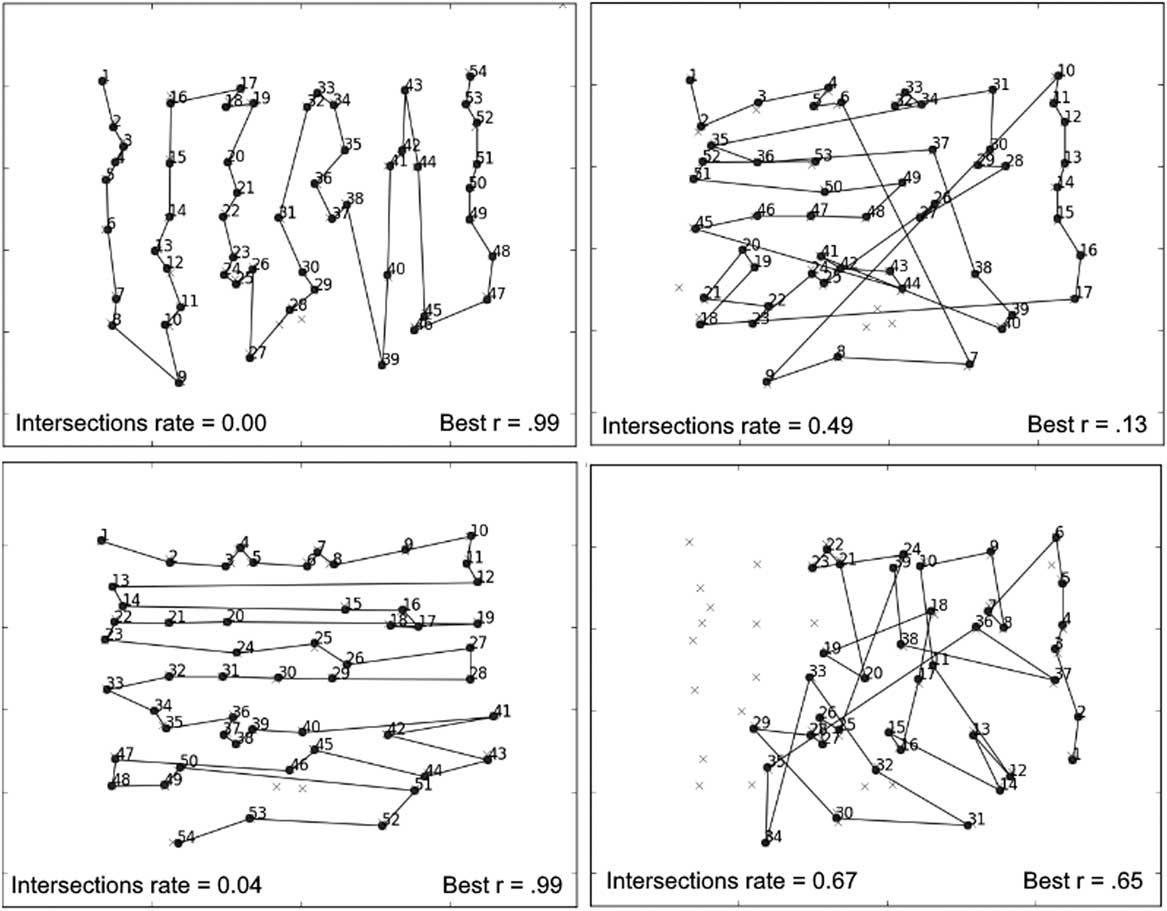
We computed the number of lines that crossed paths between previously canceled targets, divided by the total number of cancellations that were not immediate revisits (i.e., intersections rate; formulas are described in Dalmaijer et al., Reference Dalmaijer, Van der Stigchel, Nijboer, Cornelissen and Husain2014, Eqs. [3–8]). An organized search pattern includes as few intersections as possible, resulting in a low value for intersections rate (Figure 1).
Representative examples of search patterns and values of intersections rate and best r, obtained by four patients who were included in the current study. Black dots indicate cancelled targets. The numbers indicate the chronological order of the canceled targets. The paths between cancelled targets depict the search pattern. Missed targets are depicted by an “X.” Note that the middle two targets were used as an example, and not included in our analyses.

In addition, we computed whether patients searched consistently in one direction during the whole test (Mark et al., Reference Mark, Woods, Ball, Roth and Mennemeier2004). We calculated the Pearson correlation coefficient (r) from the linear regression of the x- or y-values of all marked locations relative to the order in which they were marked. The highest absolute correlation of these two (best r) was selected to represent the degree to which calculations were pursued orthogonally (formulas are described in Dalmaijer et al., Reference Dalmaijer, Van der Stigchel, Nijboer, Cornelissen and Husain2014, Eq. [9]). Best r ranges from 0 (inconsistent search) to 1 (consistent search; Figure 1).
Finally, we computed the absolute omission difference score, as an indication for neglect. All measures were computed using the CancellationTools software (Dalmaijer et al., Reference Dalmaijer, Van der Stigchel, Nijboer, Cornelissen and Husain2014).
Line bisection
This test consisted of three horizontal lines (22° long and 0.2° thick) that were presented upper right, lower left, and in the horizontal and vertical center of a computer screen (Van der Stoep et al., Reference Van der Stoep, Visser-Meily, Kappelle, de Kort, Huisman, Eijsackers and Nijboer2013). The amount of horizontal shift between lines was 15% of the line length. The stimulus presentation was approximately 19° wide and 5.7° high. Patients had to mark the midpoint of each line. The three lines were presented four times in a row, after which the absolute average deviation from the midpoint was calculated of all trials, ranging from 0° (no neglect) to 11° (severe neglect).
Catherine Bergego Scale
The CBS is an observation scale for neglect in ADL (Azouvi et al., Reference Azouvi, Olivier, de Montety, Samuel, Louis-Dreyfus and Tesio2003; Ten Brink et al., Reference Ten Brink, Nijboer, Van Beekum, Van Dijk, Peeters, Post and Visser-Meily2013). It assesses performance in personal, peripersonal, and extrapersonal space. For 10 items, neglect severity has to be scored, resulting in a total score of 0 (no neglect) to 30 (severe neglect). A score of ≥6 is usually considered as an indication for neglect.
Neuropsychological assessment
Balloons Test
This test is designed to detect visual inattention (Edgeworth, Robertson, & McMillan, Reference Edgeworth, Robertson and McMillan1998). In subtest B, 180 balloons (circles with a vertical line in the lower part) and 20 circles are presented on an A3 paper. Participants have to mark all circles. The laterality score of subtest B (ranging from 0% to 50%, higher scores indicating better performance) was used as an outcome measure for neglect.
Rey Complex Figure Test
The RCFT copy was designed to diagnose disorders in visuospatial perception and visuospatial construction (Biesbroek et al., Reference Biesbroek, van Zandvoort, Kuijf, Weaver, Kappelle, Vos and Postma2014; Bouma, Mulder, Lindeboom, & Schmand, Reference Bouma, Mulder, Lindeboom and Schmand2012). Participants are asked to copy the Rey Complex Figure. The accuracy of the drawing is scored based on clearly defined criteria. The total score ranges from 0 (none of the elements were accurately copied) to 36 (perfectly accurate copy).
Trail Making Test
The TMT-A subtest is used to examine psychomotor speed. It consists of a set of 25 circles that contain numbers (1 to 25). Instructions are to connect the circles in ascending order as fast as possible (Bouma et al., Reference Bouma, Mulder, Lindeboom and Schmand2012). In the TMT-B subtest, executive functioning is examined. The participant has to alternate between numbers and letters (1 – A – 2 – B, etc.). For both subtests, the total duration is recorded.
Tower Test
The Tower Test (Delis, Kaplan, & Kramer, Reference Delis, Kaplan and Kramer2007) measures spatial planning, rule learning, inhibition of impulsive and perseverative responding, and the ability to establish and maintain an instructional set. Participants are presented with a board containing three vertical pegs, and five disks with varying diameters. At each of nine trials, an example tower has to be built, and the participant has to obey certain rules. The total score is based on a scoring system that depends on the number of steps per trial (range 0–30), with higher scores indicating better performance.
Brixton Test
The Brixton Spatial Anticipation Test (“Brixton Test”) is a visuospatial sequencing test with rule changes (Burgess & Shallice, Reference Burgess and Shallice1997). Participants are presented with 56 pages, each containing an array of 10 circles set in two rows of five, with each circle numbered from 1 to 10. One of the circles is filled with a blue color. The participant is shown one page at the time. The position of the blue circle differs per page, and participants have to indicate where they think the blue circle will be located on the next page. The locations are governed by a series of simple rules that change without warning. The total number of errors was computed (range 0–55).
Digit Span
The Digit Span subtest from the WAIS-III-NL and WAIS-IV-NL consists of two parts: DSF and DSB (Wechsler, Reference Wechsler2012). The test administrator reads out loud a series of digits. Each part consists of eight items of each two series, that increase in length up to a maximum of 10 digits. During the DSF, short-term auditory memory is measured, and the participant has to repeat the sequence in the same order. During the DSB, the participant has to repeat the items backward to measure verbal working memory. The longest sequence that was correctly repeated was used as an outcome measure (range 2–10).
Statistical Analyses
All analyses were carried out in IBM SPSS Statistics version 23 (IBM Corp., 2015). We used descriptive statistics to report demographic and clinical characteristics, and test scores. In addition, we reported Pearson correlation coefficients (r) between all variables.
We performed an explorative factor analysis (Principal Axis Factoring) to unravel the underlying structure of the outcome variables in the model. We applied an oblimin rotation (Direct Oblimin), as we believe dimensions to be correlated. Variables were: intersections rate, best r, SC omission difference score, LB (average deviation), CBS (total score), Balloons Test (laterality score), RCFT copy (total score), TMT-A, TMT-B (duration in seconds), Tower Test (total score), Brixton Test (number of errors), DSF and DSB (longest sequence). All values were measured on a continuous scale. Since for many patients data on one or more tests was missing, we used the option “Exclude cases pairwise.” Data points that were 3.5 SD from the mean on one or more outcome measures were considered outliers and excluded from all analyses.
Analyses were repeated for patients with right and left brain damage separately, and for patients with high motor function (defined as a Motricity Index score of ≥66 and being able to use the dominant hand).
RESULTS
Participants
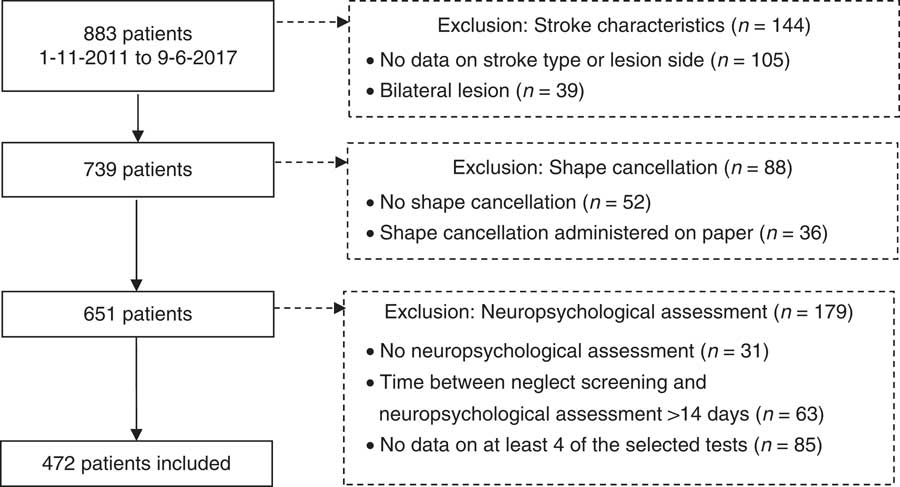
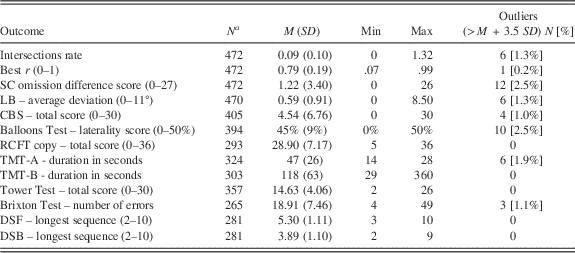
Of 883 stroke patients, 472 met the inclusion criteria and were included in the current study (Figure 2). Demographic and clinical characteristics are depicted in Table 1. In 68% of patients, the neglect screening and neuropsychological assessment were performed within the same week. In Table 2, descriptive scores on the neuropsychological tests are provided. With respect to the measures of search organization, 21% of patients scored outside the normal range regarding intersections rate (based on the average [0.03] + 2 SD [0.05] of healthy control subjects), and 18% obtained an abnormal best r score (based on the average [0.88] + 2 SD [0.12] of healthy control subjects) (Ten Brink, Van der Stigchel, et al., Reference Ten Brink, Van der Stigchel, Visser-Meily and Nijboer2016). Of all patients, 33 patients were outliers and were removed from all analyses. Of the 439 included patients, 92% could use their dominant hand to perform the neuropsychological tests.
Flowchart of patient inclusion.

Clinical characteristics at admission to rehabilitation, median scores (IQR), or frequencies [%]

MoCA = Montreal Cognitive Assessment; SAN = Stichting Afasie Nederland.
a Group sizes differ since not all clinical data was available for all patients.
b Days post-stroke at the time of the neglect screening.
Mean scores, standard deviations, ranges of scores, and number of outliers on visual search measures and neuropsychological tests

CBS = Catherine Bergego Scale; DSB = Digit Span Backward; DSF = Digit Span Forward; LB = line bisection; RCFT = Rey Complex Figure Test; SC = shape cancellation test; TMT = Trail Making Test.
a Group sizes differ between measures since not all patients performed all neuropsychological tests. The minimum number of participants that performed a combination of two of the tests was 159 (for the Brixton Test and the RCFT).
See Supplementary Table 1 for demographic and clinical characteristics, and Supplementary Table 2 for descriptive scores on the neuropsychological tests for the subgroups (i.e., patients with right-sided brain damage, left-sided brain damage, high motor scores; all without outliers).
Exploratory Factor Analyses
All patients
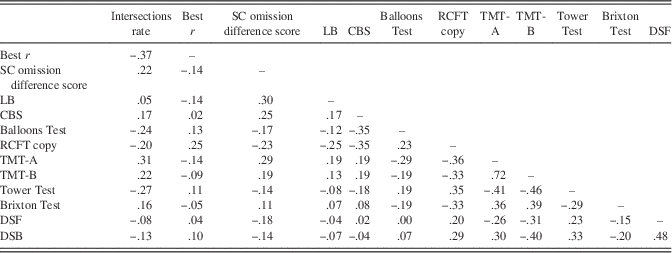
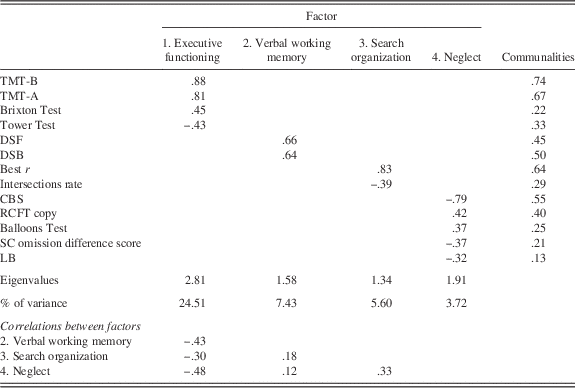
First, all variables correlated at least .3 with at least one other variable, suggesting reasonable factorability (Table 3). Furthermore, the Kaiser-Meyer-Olkin measure (KMO) was .76, thus, above the recommended value of .6, indicating that data were sufficient for exploratory factor analyses. The Barlett’s test of sphericity, χ2(78) = 432.82, p < .05, showed that there were patterned relationships between the variables. The diagonals of the anti-image correlation matrix were all over .5, supporting the inclusion of each variable in the factor analysis. Using an eigenvalue cut-off of 1.0, there were four factors that explained a cumulative variance of 41.27%. We have labelled these factors as “Executive functioning” (i.e., TMT-A, TMT-B, Brixton Test, Tower Test), “Verbal memory” (i.e., DSF, DSB), “Search organization” (i.e., intersections rate, best r) and “Neglect” (i.e., CBS, RCFT copy, Balloons Test, SC omission difference score, LB). Table 4 shows the factor loadings after rotation using a significant factor criterion of .3. The factor Executive functioning correlated moderately with Verbal working memory, Search organization, and Neglect. Furthermore, Search organization correlated moderately with Neglect. Small correlations were seen between Verbal working memory and Search organization, and Verbal working memory and Neglect.
Correlation matrix of all measures (N = 439), Pearson correlation coefficients (r) are reported

CBS = Catherine Bergego Scale; DSB = Digit Span Backward; DSF = Digit Span Forward; LB = line bisection; RCFT = Rey Complex Figure Test; SC = shape cancellation test; TMT = Trail Making Test.
Results of the exploratory factor analyses (N = 439)

CBS = Catherine Bergego Scale; DSB = Digit Span Backward; DSF = Digit Span Forward; LB = line bisection; RCFT = Rey Complex Figure Test; SC = shape cancellation test; TMT = Trail Making Test.
Patients with right hemisphere damage
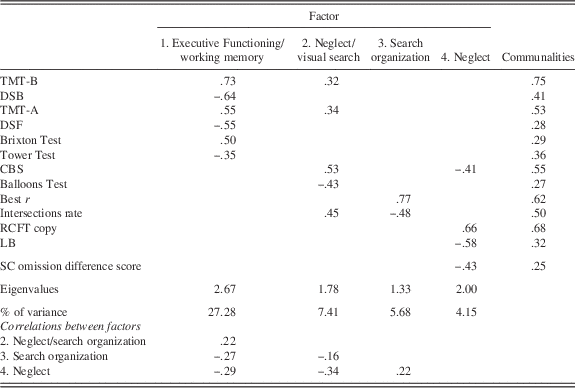
All variables correlated at least .3 with at least one other variable and the diagonals of the anti-image correlation matrix were all over .5. The KMO was .75 and the Barlett’s test of sphericity was significant, χ2(78) = 271.12, p < .05. There were four factors that explained a cumulative variance of 44.52% (Table 5). The first factor was labelled as “Executive functioning/working memory” (i.e., TMT-A, TMT-B, DSB, DSF, Brixton Test, Tower Test). The second factor was labelled as “Neglect/visual search” (i.e., CBS, Balloons Test, intersections rate, and to a lesser extent, TMT-A, TMT-B). Finally, the factor “Search organization” (i.e., intersections rate, best r) and the factor “Neglect” (i.e., CBS, RCFT copy, LB, SC omission difference score) were obtained. The factors Neglect/visual search and Neglect showed moderate correlations, whereas the other factors showed small correlations between each other.
Results of the exploratory factor analyses, including only patients with right-sided brain damage (N = 231)

CBS = Catherine Bergego Scale; DSB = Digit Span Backward; DSF = Digit Span Forward; LB = line bisection; RCFT = Rey Complex Figure Test; SC = shape cancellation test; TMT = Trail Making Test.
Patients with left hemisphere damage
The SC omission difference score, CBS, LB, and Balloons Test were removed from the model as they were not significant. All variables correlated at least .3 with at least one other variable and the diagonals of the anti-image correlation matrix were all over .5. The KMO was .63. The Barlett’s test of sphericity was significant, χ2(36) = 159.03, p < .05. There were three factors that explained a cumulative variance of 46.81% (Table 6): “Executive functioning” (i.e., TMT-A, TMT-B, Brixton Test, RCFT copy, Tower Test), “Verbal memory” (i.e., DSB, DSB, Tower Test), and “Search organization” (i.e., intersections rate, best r). A moderate correlation was seen between Executive functioning and Verbal working memory, whereas the other factors showed small correlations.
Results of the exploratory factor analyses, including only patients with left-sided brain damage (N = 208)

CBS = Catherine Bergego Scale; DSB = Digit Span Backward; DSF = Digit Span Forward; RCFT = Rey Complex Figure Test; TMT = Trail Making Test.
Patients with high motor function
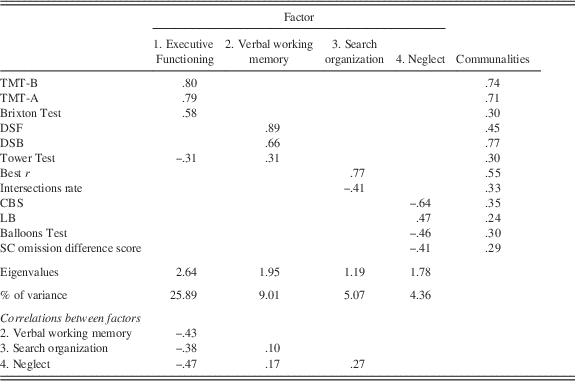
The RCFT copy was removed from the model as it was not significant. All variables correlated at least .3 with at least one other variable and the diagonals of the anti-image correlation matrix were all over .5. The KMO was .73. The Barlett’s test of sphericity was significant, χ2(66) = 236.70, p < .05. There were four factors that explained a cumulative variance of 44.34% (Table 7): “Executive functioning” (i.e., TMT-B, TMT-A, Brixton Test, Tower Test), “Verbal working memory” (i.e., DSF, DSB, Tower Test), “Search organization” (i.e., best r, intersections rate), and “Neglect” (i.e., CBS, LB, Balloons Test, SC omission difference score). The factor Executive functioning showed moderate correlations with the other factors, whereas the correlations between the other factors was small.
Results of the exploratory factor analyses, including only patients with no or little motor deficits in the arm (N = 223)

CBS = Catherine Bergego Scale; RCFT = Rey Complex Figure Test; SC = shape cancellation test; TMT = Trail Making Test.
DISCUSSION
The aim of the current study was to investigate associations between search organization during cancellation and other cognitive domains: neglect, visuospatial perception and construction, psychomotor speed, executive functioning, spatial planning, short-term auditory memory, and verbal working memory. To address this aim, we included 439 stroke patients and performed exploratory factor analyses. Our exploratory factor analysis revealed four key factors (eigenvalues >1.0; see Table 4). We have labelled these factors as “Executive functioning” (i.e., TMT-A, TMT-B, Brixton Test, Tower Test), “Verbal memory” (i.e., DSF, DSB), “Search organization” (i.e., intersections rate, best r), and “Neglect” (i.e., CBS, RCFT copy, Balloons Test, SC omission difference score, LB).
In our subsample of patients with right hemisphere damage, again, four factors summarized the underlying covariation (Table 5). The first factor consisted of several executive and verbal memory tests (i.e., TMT-A, TMT-B, DSB, DSF, Brixton Test, Tower Test). The second factor included a combination of neglect and visual search measures (i.e., CBS, Balloons Test, intersections rate, and to a lesser extent, TMT-A, TMT-B). Finally, the factor “Search organization” (i.e., intersections rate, best r) and the factor “Neglect” (i.e., CBS, RCFT copy, LB, SC omission difference score) were obtained. Measures of visual search (i.e., intersections rate, TMT-A, TMT-B) related with measures of neglect (i.e., CBS, Balloons Test), which is in line with prior findings (Rabuffetti et al., Reference Rabuffetti, Farina, Alberoni, Pellegatta, Appollonio, Affanni and Ferrarin2012; Ten Brink, Van der Stigchel, et al., Reference Ten Brink, Van der Stigchel, Visser-Meily and Nijboer2016). Neglect and search organization seem different constructs, however, as search organization and neglect appeared to be separate domains as well in this sample.
For patients with left hemisphere damage, neglect variables were, not surprising, not significant, thus no “Neglect” factor was present (Table 6). The remaining three factors roughly compared with the main analyses: “Executive functioning” (i.e., TMT-A, TMT-B, Brixton Test, RCFT copy, Tower Test), “Verbal memory” (i.e., DSB, DSB, Tower Test), and “Search organization” (i.e., intersections rate, best r). This indicates that, although there is a positive relation between search organization and presence of neglect, search organization appears to be an important additional cognitive function next to existing functions that are measured during neuropsychological assessment. Overall, search organization measures constituted one separate cluster in all analyses.
We labeled the clusters based on the assumed shared functions of the measures within the cluster, yet most tests are sensitive to several different processes and could, therefore, belong to more than one cluster. The TMT, for example, measures search speed but is also considered to assess executive functioning. With respect to psychomotor speed, hemiparesis could have had a negative impact on the model. Limb weakness leads to impairment of both gross and fine motor skills and slows down motor responses. We, therefore, repeated our analysis in patients who were able to use their dominant hand and obtained high arm motor scores, and the results were largely comparable (Table 7).
With respect to short-term as well as working memory, the “sensory modality” of the tests probably have had an influence on the lack of association with the search organization measures. Whereas search organization was measured with visuo-spatial tests, short-term and working memory were measured with verbal tests, but not their visuo-spatial counterparts. We did not have enough data of stroke patients on visuo-spatial short-term and working memory to also include these in our model.
Regarding the lack of association between search organization and higher-order spatial planning (such as applying spatial rules), test complexity might be a likely candidate for explanation. Several studies showed that the number of cancelled targets is affected by characteristics of the test. For example, less targets are cancelled when more targets are present (Chatterjee, Thompson, & Ricci, Reference Chatterjee, Thompson and Ricci1999) or with higher (non-spatial) cognitive demands (Ricci et al., Reference Ricci, Salatino, Garbarini, Ronga, Genero, Berti and Neppi-Mòdona2016). Such factors might affect search organization too. Maybe even more relevant, are specific test instructions. In the current test, patients were not explicitly instructed to search in an organized manner or to search fast, and no specific order of cancellation was required to successfully complete the test (which is the case in the neuropsychological test that was used to assess higher-order spatial planning; the Tower Test). As a result, search organization during cancellation may be a relatively automatic behavior, which could explain the weak relationship with other cognitive domains. In future studies, it could be informative to study effects of different instructions on search organization, and how this changes the association with other tests. For example, planned organized search might relate more to other tests in which active planning is required, such as the Tower Task.
A recent lesion-symptom mapping study showed that stroke patients with less search organization had lesions in the right hemisphere, in particular, the temporoparietal junction (Ten Brink, Biesbroek, et al., Reference Ten Brink, Biesbroek, Kuijf, Van der Stigchel, Oort, Visser-Meily and Nijboer2016). These brain areas overlap with regions that have previously been associated with conjunctive search and spatial working memory (Humphreys & Chechlacz, Reference Humphreys and Chechlacz2015). Based on the involved brain areas (Ten Brink, Biesbroek, et al., Reference Ten Brink, Biesbroek, Kuijf, Van der Stigchel, Oort, Visser-Meily and Nijboer2016), and the behavioral results of the current neuropsychological study, we hypothesize that disorganized search is caused by disturbed spatial processes, rather than deficits in high-level executive function or planning. It should be noted, however, that these are speculations and more research is needed to test this hypothesis.
Finally, it must be stressed that, with the current exploratory factor analysis, we performed a first step to unravel the relation between search organization measures and other cognitive measures. Our main model explained 41.26% of the variance. This magnitude of explained variance can be considered as high and significant, given the heterogeneity of outcome measures and factors, capturing different aspects of the assumed underlying cognitive functions. Further research is needed to obtain a complete picture of the relation with search organization and other cognitive functions.
Limitations
A limitation of the current study is its retrospective nature. The choice of the neuropsychological tests for individual patients was based on the capacities of the patient, such as language or motor skills, and sometimes on the specific questions of the rehabilitation team. For example, patients with severe deficits in language production were not able to perform verbal memory tests. As a result, in the current sample, relatively little patients with left hemispherical damage were included, and, in general, the quality of communication was quite good.
The choices of the neuropsychological tests for the analyses were also restricted to the available data. The lack of associations between certain cognitive functions and search organization does not rule out the possibility that associations would have been found when other tests or outcome measures were used. Based on the literature, measures of, for example, spatial working memory, would have been important to include in our analyses. In most models of visual search, the implicit idea is that we remember where we have looked so that previously inspected locations are not returned to (Peterson, Kramer, Wang, Irwin, & McCarley, Reference Peterson, Kramer, Wang, Irwin and McCarley2001). Both retrospective memory (i.e., keeping track of examined objects or locations) and prospective memory (i.e., strategic planning a series of shifts to specific objects) could, therefore, be involved in visual search (Peterson, Beck, & Vomela, Reference Peterson, Beck and Vomela2007). Studies have shown that the relative contributions of different processes of visual search, such as spatial planning and working memory, vary across tests (e.g., based on test complexity) and individuals (e.g., stroke patients versus healthy subjects; Singh et al., Reference Singh, Fridriksson, Perry, Tryon, Ross, Fritz and Herter2017). Future, prospective, research should at least include visuo-spatial versions of memory tests for better comparison of the sensory modalities.
Additionally, several studies have examined eye movements during visual search tests to unravel underlying cognitive processes (e.g., Peterson et al., Reference Peterson, Kramer, Wang, Irwin and McCarley2001; Shinoda et al., Reference Shinoda, Hayhoe and Shrivastava2001). Measuring eye movements is thought to reflect visual search more directly compared to cancellation patterns, as one could have searched locations in a different order than the order the targets were eventually cancelled. In a small study (i.e., 16 stroke patients), however, it was found that the number of saccades and the degree of search organization based on motor responses (i.e., in a TMT task) were negatively related with each other (Singh et al., Reference Singh, Fridriksson, Perry, Tryon, Ross, Fritz and Herter2017). This indicates that measuring eye movements during visual search could yield comparable results compared to measuring cancellation patterns during visual search.
On the other hand, the seemingly obvious relation between eye movements and attention could be disturbed after brain damage. In a case study with a patient suffering from optic ataxia, this patients’ fixation did not directly suggest attention for the fixated goal (Khan et al., Reference Khan, Blangero, Rossetti, Salemme, Luauté, Deubel and Pisella2009). This could indicate that evaluating the pattern of cancelled targets might, therefore, be a proper measure for visual search in a clinical setting with a heterogeneous patient population. Currently, however, no studies with large enough cohorts of stroke patients have been performed regarding the relation between eye movements and attention. It is, therefore, unclear which measure would best reflect aspects of visual search. Future studies could target the direct associations between eye movements and search organization derived from behavioral measures, by using eye tracking during visual search tasks (such as cancellation or TMT).
One of the other issues in this study could have been the problem of “method variance”. Method variance means that measures extracted from the same test will have larger associations, as the same stimuli are used (Yong & Pearce, Reference Yong and Pearce2013). However, the SC omission difference score and the measures of search (all derived from the same test) were not in the same cluster, suggesting that the problem of method variance at least did not cause all results. In addition, tests were administered in two different sessions with a variable time window of 1–14 days. Given that recovery (spontaneous or due to training) takes place in this particular phase post-stroke onset, patients with a longer time window in between sessions might have had better scores on the second session compared to the first one. This could have influenced the association between the search variables and other neuropsychological clusters. If anything, however, the association between the search variables and the cognitive measures that were administered within the same session (i.e., the neglect measures) would then potentially be stronger, which we did not observe.
Finally, some potentially relevant information was not, or insufficiently, available, such as information on stroke territories or visual field defects. The presence of a visual field defect could contribute to disturbed visuospatial perception and visual search. Excluding patients with occipital lesions or visual field defects, however, would lead to the loss of an important patient group, as patients with posterior damage often show neglect and would then be underrepresented in the sample (Mort, Reference Mort2003). In addition, pure visual input failure does not fully account for disorganized search (Behrmann, Ebert, & Black, Reference Behrmann, Ebert and Black2004; Machner, Sprenger, Kömpf, et al., Reference Machner, Sprenger, Kömpf, Sander, Heide, Kimmig and Helmchen2009; Machner, Sprenger, Sander, et al., Reference Machner, Sprenger, Sander, Heide, Kimmig, Helmchen and Kömpf2009).
Conclusion and Implications
To summarize, the results of the exploratory factorial analyses show that measures of search organization constitute one cognitive cluster of their own, next to “Executive functioning,” “Verbal memory,” and “Neglect.” Measuring search organization during cancellation may provide useful additional insights into the visuospatial processes and attention of stroke patients, the change over time, or the effects of a given treatment. Possibly, patients with disorganized search could experience negative consequences in ADL. Importantly, measures of search organization can easily being extracted during assessment of computerized cancellation tests (Dalmaijer et al., Reference Dalmaijer, Van der Stigchel, Nijboer, Cornelissen and Husain2014; Donnelly et al., Reference Donnelly, Guest, Fairhurst, Potter, Deighton and Patel1999; Huang & Wang, Reference Huang and Wang2008). Future research needs to examine what the consequences of disorganized search are in daily life, whether search organization can be trained during rehabilitation, for example with prism adaptation (De Wit, Ten Brink, Visser-Meily, & Nijboer, Reference De Wit, Ten Brink, Visser-Meily and Nijboer2016), and whether training generalizes to daily life.
ACKNOWLEDGMENTS
The authors declare that they have no conflict of interest. The study was funded by a grant from NWO (Netherlands organization for Scientific Research; grant 451-10-013) to TCWN and a grant by the “Revalidatiefonds” (R2012134) to T.C.W.N. and J.M.A.V.M. None of the funders had any role in study design; in the collection, analysis and interpretation of data; in the writing of the report; nor in the decision to submit the article for publication.
Supplementary Material
To view supplementary material for this article, please visit http://doi.org/10.1017/S1355617717001254.