Ageing in Europe
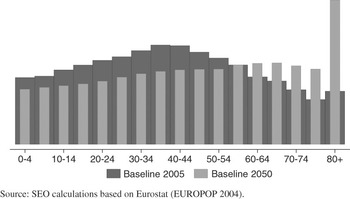
Although age distributions differ between countries, the ageing challenge is apparent everywhere. In the coming decades, the average age will increase all over Europe. The most recent population projection published by Eurostat1 signals that the ‘working age population’ in the EU-25 (people aged 15–64) will drop from 305 million in 2005 to 255 million in 2050, while the population aged 65+ will rise from 77 million to 135 million. The total population will remain more or less constant, but the share of working age population will fall from 67.2% to 56.7%. The effect of ageing on the EU-25 age distribution is shown in detail in Figure 1.
Age distribution of the future EU-25 labour force (baseline projection)

The figure compares the relative age distribution of 2005 with that of 2050. The height of the bars represents the relative size of the age group in the total population, the blue bars for the 2005 population and the green bars for the 2050 population. All the dark bars together sum to 100%, as do all the light bars together. In the next decades the middle ‘bulk’ of 2005 will shift to the right and the share of ‘older elderly’ (aged 80+) will more than double. The consequence is a ‘potential employment gap’ because a lower proportion of economically active people have to meet the same demand for goods and services.
The European ‘potential employment gap’
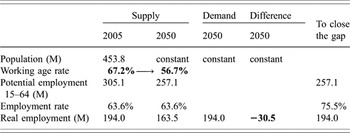
The effect of a declining working age rate on the potential labour supply is best illustrated by the hypothetical calculation of the potential employment gap in Table 1. The first columns show the 2005 employment situation. Out of 450 million people in the EU, 67.2% (305 million) are between the ages of 15–64. The employment rate among this potential labour force is 63.6%, which means that, in fact, 194 million people are currently employed.
Calculation of the potential employment gap, EU-25 (purely ageing effect)

Source: SEO calculations based on Europop2004.
However, in 2050 the working age rate will have dropped to 56.7%, purely as a consequence of ageing. Now, for illustrative purposes, we isolate the ageing effect by assuming population size remains constant over time.2 The ageing effect then translates into a potential labour force of only 257 million in 2050. If European employment rates remain at their current levels, that would mean a labour supply of only 163.5 million. Because population size remained constant, demand will also remain at the same level so the potential gap3 between labour supply and demand will be roughly 30 million. Among other solutions, this potential gap might be closed by raising the employment rate. If, on average, 75.5% of the new labour force were to participate in employment, labour supply would increase to (75.5% × 257 million) 194 million people, thereby again equalling demand.
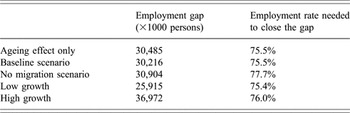
Relaxing the assumption of constant population, similar calculations can be made for the four different scenarios in the Eurostat projections (see Table 2).
Potential employment gap: absolute and relative size in four scenarios

Source: SEO calculations based on Europop2004.
The baseline projection differs from the calculation in Table 1 only in a small decrease of the population size. This does affect the absolute but not the relative size of the employment gap, because demand is supposed to decrease proportionally. In addition, in the baseline scenario, an employment rate of 75.5% will close the potential employment gap. Under the low growth and high growth scenarios, results are quite similar (when measured in relative terms). The (hypothetical) no migration scenario, however, differs; that is, because migrants are more often of working age, disallowing immigration leads to a smaller potential labour force. This means that a larger share of the potential should be activated, until an employment rate of 77.7% is reached. I will elaborate more on the characteristics of migrants in the next chapter.
Implicit in the potential employment gap calculations above are the following assumptions:
• constant demand (per capita),
• constant inactivity rate,
• constant length of average working week,
• constant labour productivity,
• migration along Eurostat projections 2005–2050,
• migrant supply fits demanded type of labour exactly.
To what extent these assumptions are realistic depends largely on the country and economic sector under consideration. For example, if a country’s employment rate is already quite high, it will be more difficult to increase it any further. Other possible solutions and national differences will be briefly discussed in the next paragraph. Some assumptions are just necessary because of a lack of empirical estimates: if better data become available, these assumptions could be replaced. For example, after the recent publication of Cedefop’s medium-term forecast of future skill needs, one can argue that the assumption of constant demand could be replaced by a yearly growth of 0.6% to 0.8%. Similarly, real labour productivity growth might also be allowed to be positive then.4 The migration projections that I use are the same as in the recent Cedefop forecast and stem from Eurostat sources. On a national level one could probably find more recent and better migration figures, although it will probably remain the most vulnerable part in any supply side projection.
National differences and how to close the gap
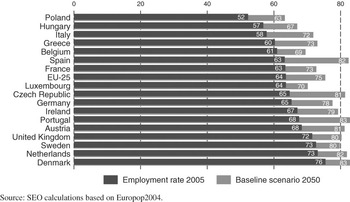
Employment gaps subsist in almost all EU-25 countries, the countries that face the largest challenge are the countries with older populations or low net migration (see Figure 2). Several policy options might be considered, but the usefulness, eligibility and effectiveness will differ strongly between countries and between the different sectors of economies. This is true not only because of structural economic differences, but also because finding the optimal mix is subject to national preferences and traditions. A ‘one size fits all’ policy solution is not available. The most frequently suggested options are:
Employment rate needed to close the gap

• Increasing employment participation,
• in terms of persons, or
• hours worked per person (the former seems more plausible than the latter),
• make employees take pensions at a later age,
• stimulate part-time pensions instead of the currently dominant all-or-nothing pension schemes.
• Stimulating population growth. This option is still suggested now and then, but is really not sustainable in the long run and will only make things worse. It will only be effective after 25 years, and after 65 years the problem will have returned on a much larger scale.
• Increasing productivity. An efficient and realistic option in the manufacturing and the agricultural sector. However, much harder to achieve in labour-intensive service sectors, where constant (real) productivity seems a realistic assumption.
• Decrease output (GDP) per capita. For an economist, this is obviously the most unfavourable option, although it is the necessary outcome ‘if everything else fails’…
• Sectoral shifts of labour. As labour is scarce it might move from the lower-paying sectors to the higher-paying sectors. Normally, this would also mean a shift to the more productive sectors. This of course will not bridge the overall employment gap, but merely shift the problem from one sector to another while increasing overall productivity.
• Extra labour migration (in fact a regional shift of labour). If arranged so as to be beneficial to both the host country and the immigrant, it is an economically sensible option. However, it can be useful only if immigrants supply the skills the labour markets need. Temporary migration should also be considered. In addition it should be noted that, in the baseline scenario, ‘normal’ migration is already included.
The role of labour migration
Migration is clearly the most ‘unpredictable’ variable in every labour supply projection. At the same time, it is also often the most disputed. Too often, however, the political and public debate is based on sentiments, and not on scientific insights or empirical facts. In this section I want to present some of these facts, hopefully thereby enhancing the current debate.
Changing character of migration
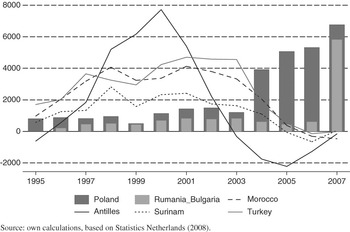
When thinking of labour migration, many people still visualize low-skilled Turkish or African males, as was common during the last 40 years of the 20th century. But those traditional migration patterns are now rapidly changing, at least in Western Europe. Tighter migration policies on the one hand, and EU enlargement on the other hand are causing rapid changes. For example, in the Netherlands, migration rates of all traditional migrant countries (Turkey, Morocco, Surinam and the Dutch Antilles) are falling and, since 2006, are even negative: emigration is higher than immigration.5 At the same time, net migration from Poland is increasing sharply, as well as migration from Romania and Bulgaria, since their entry into the EU (see Figure 3).
Net migration from ‘traditional’ and ‘new’ migrant countries to NL

Most other Western European countries also experience a shift from intercontinental migration to within-EU migration (from East to West). Recent studies show that these ‘new migrants’ are further characterized by a much higher employment rate than the ‘old migrants’, a relatively low age (between 20–40) and a higher return migration (labour migration is partly used to fill seasonal gaps in the western labour markets). Another important fact is that many of the Eastern European migrants are working in low-skilled jobs.6–8
Skill composition of traditional immigrants
The changing character of migration, shown in the previous paragraph, shows that it might not be useful to think of immigrants as one homogenous group. Kahn,Reference Kahn9 in a study on Switzerland, US, Canada and New Zealand, states that ‘the distribution of immigrant skills is in most cases bimodal, while that of natives is single-peaked’. He suggests the presence of two distinct immigrant populations, one quite similar to natives and one with clearly lower skills. This implies that, in terms of employment, there would be no real difference between immigrants and natives in the top of the skill distribution, while at the bottom end immigrants would be overrepresented among the inactive. That was indeed found to be the case, except for US male immigrants. The larger share of low-wage jobs in the US economy was found to offer more opportunities to male immigrants compared with the other countries, while – at the same time – low wages lead immigrant women in the US to supply less labour than immigrant women in the other countries.
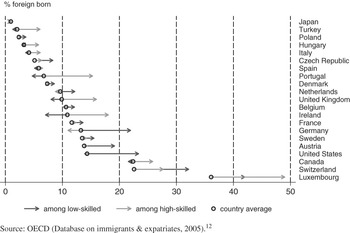
To what extent these findings can be corroborated with European data is shown here.10Figure 4 presents the average share of immigrants in a country, compared with the immigrant share among the high-skilled population and among the low-skilled population. If the dark arrow points to the right, immigrants are overrepresented among the low-skilled working age population. If the dark arrow points to the left, immigrants are underrepresented. If the light arrow points to the right, immigrants are overrepresented among the higher educated, etc. We define immigrants here as ‘foreign-born’. In 13 of the 20 countries, immigrants are overrepresented among the higher educated, in 11 countries they are overrepresented among the lower educated. This means that, in some countries, the distribution of immigrants among educational level is indeed bimodal in our definition.11 In Switzerland, Sweden, France and the Czech Republic, the foreign-born are overrepresented among both low-skilled as well as among the high-skilled. Turkey, Portugal, UK, Ireland & Switzerland show a substantive overrepresentation of high skilled immigrants; in Portugal, the UK and Ireland, this goes together with an underrepresentation of lower skilled immigrants. In the countries with relatively many immigrants the low-skilled immigrants are overrepresented (except for Canada).
Immigrants overrepresented among both low-skilled and high-skilled

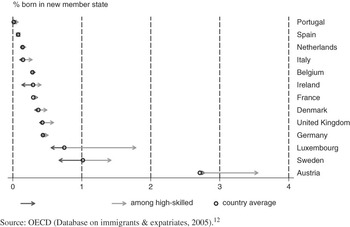
Instead of looking at foreign born immigrants, we can also look at the differences between natives and migrants from the ten new member states, in a similar way. Figure 5 shows that differences between the local population in the EU-15 and migrants from the new member states were only relevant in Luxembourg, Sweden and Austria. Only in the latter was more than 1% of the population born in one of the new member states, in the year 2000. In all countries the Eastern European migrant population had higher average education than the native population.
NMS immigrants in the EU-15 have nearly similar skill distribution

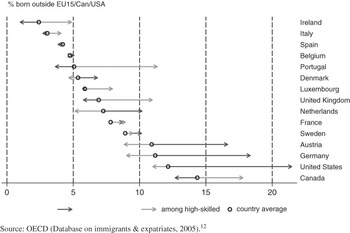
In Figure 6 the immigrant population is defined as non-western: born outside the EU-15, USA or Canada. These migrants are relatively low skilled in Germany, Austria, the Netherlands & Denmark; they are relatively high skilled in Portugal, Ireland, the UK, Luxembourg and Italy. Immigrants’ educational distribution is bipolar in France and Sweden. Compared with Europe, Canada and the US have more non-Western immigrants; in the US they are mainly low skilled, in Canada mainly high skilled.
Overrepresentation of non-western immigrants among skill groups

All the above shows that migration has many different faces. It is not only low-skilled labour that immigrates and high-skilled labour that emigrates, as is sometimes suggested. In many countries, at least two different migrant groups can be characterized, one relatively high skilled and one relatively low skilled.
The recent trend of intra-European migration means a rise in migration of high-skilled labour, although often working in low-skilled jobs. Even when focusing only on immigrants from non-Western countries outside the EU, they turn out to be relatively high skilled in the one country and relatively low skilled in the other; a lot seems to depend on institutional differences, such as current and historical immigration policies, cultural links and (wage) structure of the economy. But the recent possibilities for (nearly) free labour migration of EU27 citizens are, in the author’s opinion, irreversible, intra-European labour migrants will probably characterize European migration for the next period. This structural character implies the challenge of securing the fact that immigrant labour remains beneficial to both the immigrant and the host country.
Databases
Eurostat, several databases, mostly collected in the Labour Force Survey, http://epp.eurostat.ec.europa.eu/portal/page?_pageid=1090,30070682,1090_30298591&_dad=portal&_schema=PORTAL
OECD ‘Database on Foreign-born and Expatriates’; 29 countries, most data collected from the 2000 Census, stocks and flows. This is the source for the OECD Trends in International Migration publications. http://www.oecd.org/document/51/0,2340,en_2649_37415_34063091_1_1_1_37415,00.html
EuroPop2004 population projections can be found on the Eurostat website under the theme of ‘Population and social conditions’ in the Data section.
Ernest Berkhout graduated from Utrecht University in the field of Social & Institutional Economics. He also participated for over 2 years in an international research project comparing EU and US labour market determinants conducted by Professor Schettkat (Utrecht University) and Professor Freeman (NBER/Harvard). In 1999 he started working at SEO Economic Research, where he is now employed as senior researcher in the Labour & Education Economics department.
His main interests are:
• international, sectoral and individual differences in wages and education;
• ageing, labour force participation, temporary work and labour migration;
• higher education and the transition to the labour market;
• economic modelling of tourism.
More information is available on http://www.seo.nl/en/organisation/employees/arbeidenkennis/97.html