I. INTRODUCTION
The study of new minerals using powder diffraction is not new. However, many of the remaining problems are particularly challenging. It is not uncommon that minerals approved by the International Mineralogical Association have no crystal structure associated with them. Most mineral structures over the years have been solved using single-crystal techniques, but many mineral crystal structures remain unsolved as the samples are not appropriate for the conventional single-crystal work. Given that the capabilities of powder-diffraction techniques (hardware and software) have advanced greatly over the past 10 years, some of those missing mineral structures could be finally solved. In addition, minerals often exhibit microstructural behavior that has been difficult to deal with in the past but could now be revisited. These issues are not exclusive to minerals however, small samples being a fact of life in areas such as high-pressure synthesis and ex situ battery studies. The latter studies can also feature microstructure issues in common to layered minerals and even the new SRM1979 ZnO nanomaterials standard (Cline et al., Reference Cline, Leoni, Black, Henins, Bonevich, Whitfield and Scardi2013).
II. EXPERIMENTAL ISSUES
A. Handling small samples
The difficulties involved in handling and analyzing very small samples are common knowledge to those analyzing functional-materials, but thankfully often an exception rather than the rule. When working on minerals either the rarity or difficulty in separating out pure samples can make it the rule. Nothing focuses the mind more than handling an extremely small and rare mineral sample, produced after painstaking work with a microscope to separate out sufficient grains to have even a remote chance of a successful analysis. Such a sample was the Australian mineral widgiemoolthalite (Nickel et al., Reference Nickel, Robinson and Mumme1993), with the additional knowledge in the back of the mind that the mining waste-pile where it was discovered in Western Australia no longer exists. Widgiemoolthalite adds an extra dimension with having a very strong reflection around 3°2θ (CuKα) or 31 Å which is awkward on a laboratory instrument even with focusing capillary geometry. Consequently, rather than risking such a precious sample jamming inside a more suitable 0.3 mm capillary, the larger 0.5 mm capillary was used instead. This had the not unexpected result that the sample “walked” along the capillary as it rotated, limiting the amount of time it could remain in the X-ray beam. In order to collect high-quality data, a number of shorter runs were obtained, repositioning the sample between each run. The data were then summed and the capillary background subtracted. Figure 1 shows a comparison of a single run and the final summed data. The structure of widgiemoolthalite has not yet been solved or unambiguously indexed, but the final data are of sufficient quality that efforts are ongoing.
(Color online) Plot of one of the individual 30 min datasets and the summed data from ten 30 min datasets after subtracting the capillary background.

B. Radiation damage
Radiation damage is an everyday and serious problem for people doing diffraction work on proteins and other biological samples (Garman, Reference Garman2010) and various methods are used to prevent or reduce its effect on the data produced. It is not something that people working with minerals or functional oxides usually have to deal with. The mineral angastonite (South Australia) was recognized quite recently (Mills et al., Reference Mills, Groat, Wilson, Birch, Whitfield and Raudsepp2008). The sample was slightly larger than the widgiemoolthalite described above but still occupied a little over 2 mm in a 0.5 mm quartz capillary. As a large, triclinic unit-cell it was very difficult to index from laboratory diffraction-data even using focusing optics. Using additional information such as the density measurement and a low-temperature dataset, indexing was successful using a 2150 Å3 cell in P-1 [Figure 2(a)]. Attempts at structure solution have to date been unsuccessful and a natural progression was to collect high-resolution synchrotron data at 0.7 Å (close to MoKα) to better resolve the numerous reflections. Surprisingly, the angastonite sample was observed to degrade in the synchrotron beam [Figure 2(b)], so a laboratory dataset is still the best currently available for this mineral. Radiation damage with proteins is well known but minerals are usually assumed to be stable.
(Color online) (a) Le Bail fit to the room-temperature laboratory data of angastonite using the 2150 Å3 unit cell in P  $\bar 1$ described in Mills et al. (Reference Mills, Groat, Wilson, Birch, Whitfield and Raudsepp2008). (b) Degradation of angastonite with successive scans in the synchrotron beam.
III. STRUCTURE SOLUTION FROM POWDER-DIFFRACTION DATA
A. Direct methods
Although most mineral structures have been solved using single-crystal techniques, the determination of mineral crystal structures from powder-diffraction data is nothing new. The direct-method approaches used in the single-crystal diffraction work can be used successfully, although the arbitrary partitioning of intensities in overlapped reflections in Le Bail (Reference Le Bail, Duroy and Fourquet1988) or Pawley (Reference Pawley1981) refinement introduces ambiguity not present in single-crystal data.
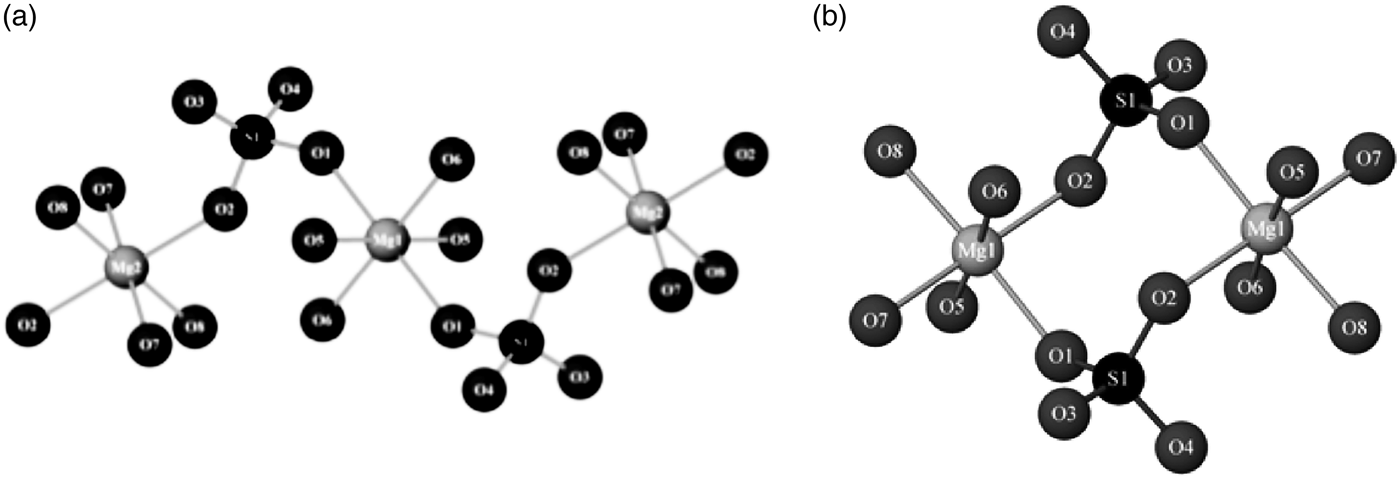
A recent mineral structure solved from powder-diffraction data using direct methods was cranswickite (MgSO4.4H2O; Peterson, Reference Peterson2011), which was named after the late Australian-crystallographer Lachlan Cranswick. The mineral is also notable in that it was initially identified in the field using a Terra portable X-ray diffractometer modeled on the ChemMin instrument on the NASA Curiosity rover. It is otherwise indistinguishable from a different MgSO4·4H2O mineral called starkeyite and is metastable under relative-humidity conditions found in most laboratories. Fittingly the structure was solved in Canada from capillary data obtained with a laboratory diffractometer. EXPO2009 was used to determine the structure (Altomare et al., Reference Altomare, Camalli, Cuocci, Giacovazzo, Moliternia and Rizzi2009). Figure 3 compares the different connectivity of the MgO6 and SiO4 polyhedra in starkeyite and cranswickite.
Comparison of the connectivity of the MgO6 octahedra and SiO4 tetrahedra in (a) cranswickite, and (b) the otherwise identical starkeyite (Peterson, Reference Peterson2011).
B. Simulated annealing
The real-space approach of simulated annealing has been found to be very successful in solving structures from “low-resolution data”. Powder-diffraction data are often regarded as low resolution by definition, and laboratory X-ray data ups the ante in terms of lower instrument resolution together with the X-ray form factor fall off. In a sense, simulated annealing is structure solution by the Rietveld method, in that structural and other restraints may be applied to prevent a problem falling over the cliff of overparameterization. The structures of organics and other molecular systems have been a field where the use of rigid-body constraints and restraints makes simulated annealing a natural fit. This has been evident in the success of the DASH software package (David et al., Reference David, Shankland, van de Streek, Pidcock, Motherwell and Cole2006) in the solution of organic structures. Inorganic structures are not excluded however, the software FOX (Favre-Nicolin and Cerny, Reference Favre-Nicolin and Cerny2002) initially focusing on features such as polyhedral rigid-bodies and atom merging. Simulated annealing has seen more modest use for new mineral structures. One system where it was used successfully on a natural mineral sample was jadarite (Whitfield et al., Reference Whitfield, Le Page, Grice, Stanley, Jones, Rumsey, Blake, Roberts, Stirling and Carpenter2007) using the TOPAS package (Bruker-AXS, 2008). Here a combination of polyhedral rigid-bodies, anti-bump, bond length, and coordination restraints was used together with information from infrared spectroscopy to find a candidate structure from quite low-resolution capillary data for final refinement. The structure was later confirmed using better laboratory data and high-resolution synchrotron data (Figure 4).
(Color online) (a) Polyhedral representation of the jadarite structure (b) fit of the structure to 11BM synchrotron data (GOF = goodness-of-fit).
A very similar methodology was used in triclinic chromotropic-material 4,5,6,7-tetrafluorobenzo-2,1,3-telluradiazole (Cozzolino et al., Reference Cozzolino, Whitfield and Vargas-Baca2010), where a poorly scattering sample produced borderline-quality data for a complex structure (Figure 5). The only additional factor in the organometallic case was the use of a ring-flattening restraint.
(Color online) (a) Difference plot between 5 and 80°2θ for the refinement of 4,5,6,7-tetrafluorobenzo-2,1,3-telluradiazole at 84 K, and (b) resulting structure showing the ribbon chains along the c-axis.
C. Charge flipping
Charge-flipping as a technique was originally envisaged for high-resolution diffraction data (Oszlányi and Süo, Reference Oszlányi and Süto2004), but the algorithm is so quick that it has become popular for first trials with powder-diffraction data. It has been shown to be particularly powerful with zeolites where modifications to the basic algorithm and use of microscopy data allowed previously intractable problems to be solved such as zeolite IM-5 shown in Figure 6 (Baerlocher et al., Reference Baerlocher, Gramm, Massuger, McCusker, He, Hovmoller and Zoi2007).
(Color online) Framework of the zeolite IM-5 laid over the calculated-structure envelope (Baerlocher et al., Reference Baerlocher, Gramm, Massuger, McCusker, He, Hovmoller and Zoi2007).
Unsurprisingly the method has also been applied to minerals, including yet another phase of hydrated MgSO4 (Ma et al., Reference Ma, Bish, Wang and Chipera2009), and a mineral from Montreal, Canada called strontiodresserite [(Sr,Ca)Al2(CO3)2(OH)4·H2O]. Strontiodresserite is somewhat unusual for a mineral in that it is extremely crystalline. In this regard, it is similar to jadarite in that reflections are observed in the CuKα diffraction pattern all the way to 140°2θ. Charge-flipping will not always find all of the atom positions in a structure but with laboratory X-ray data there is a good chance that it will find the heavier atoms. This partial solution is still invaluable as it can be used to vastly reduce the search space in a subsequent simulated-annealing. This is exactly what was done in the case of strontiodresserite, where the heavy Sr and the AlO6 octahedra were easily located by charge-flipping and the rest by simulated annealing. Rietveld refinement of the result yielded the structure shown in Figure 7. Density-functional theory (DFT) calculations confirmed both the structure and the space group chosen in the final refinement as well as locating the hydrogen atoms in the hydroxides and water molecule.
(Color online) Polyhedral representation of the structure of strontiodresserite (Whitfield et al., Reference Whitfield, Mitchell, Le Page and Roberts2010a.
III. MICROSTRUCTURE AND FAULTING
A. Hydrotalcites
The layered hydrotalcites at first appear to have a simple structure, but the high symmetry R  $\bar 3$ m space group belies a significant amount of disorder which is difficult to deal with. Synthetic hydrotalcites are not usually very crystalline, but a number of minerals with the hydrotalcite structure are extremely crystalline indeed and should be good candidates for detailed structural analysis. One such mineral is woodallite [Mg6Cr2(OH)16Cl2·4H2O], but when a Le Bail fit is carried out significant problems become apparent in the difference plot (Figure 8) because of apparent anisotropic peak broadening.
(Color online) Le Bail fit to diffraction data from woodallite.
The R  $\bar 3$ m layer structure of hydrotalcites look familiar, but not identical, to anyone used to working with lithium-battery cathode materials, and in fact similar anisotropic broadening-behavior has been seen before in charged and chemically delithiated materials as seen in Figure 9(a) (Whitfield et al., Reference Whitfield, Niketic, Le Page and Davidson2006). The classical way of representing such broadening graphically is the Williamson–Hall plot, where anomalous behavior is immediately apparent. Stacking fault behavior in R
 $\bar 3$m should follow the selection rule h–k ≠ 3n (Warren, Reference Warren1969), but it quickly becomes apparent from Figure 9(b) that the 003 and 113 reflections should not broaden from the selection rules but in fact do so. In rapidly delithiated Li1.2Mn0.4Ni0.3Co0.1O2, the additional broadening comes from inhomogeneity in the lithium layers causing buckling.
(Color online) (a) Reversible anisotropic broadening of Li1.2Mn0.4Ni0.3Co0.1O4 during the first discharge and second charge. (b) Williamson–Hall plot of the pristine Li1.2Mn0.4Ni0.3Co0.1O2 and cycled materials at each end of the first two cycles (OCV = open-circuit voltage). Reflections indicated for R  $\bar 3$m space group.
When the broadening is effectively modeled to extract the true peak intensities, the refined structures make crystallographic sense with respect to bond-lengths, etc., where before they did not. In the absence of the additional broadening in 003 and 113, the woodallite and stichtite follow more closely the expected behavior from Warren (Reference Warren1969). Stacking (deformation) faults in a cubic-close packed (ccp) structure is expected to produce peak shifts and peak-shape anisotropy in addition to the hkl-dependent broadening.
The lack of obvious peak shifts in the Le Bail fit is suggestive that twinning faults are largely responsible for the observed behavior. This can be modeled quite readily using the selection rule where l = odd and l = even reflections have slightly different broadening. In addition to charge-balance occupation constraints (Whitfield et al., Reference Whitfield, Davidson, Mitchell, Wilson and Mills2010b), once the broadening is taken into account the structure refinement can yield a good fit to the data (Figure 10), and anion occupancies close to those found by a suite of other analytical techniques (Mills et al., Reference Mills, Whitfield, Kampf, Wilson, Dipple, Raudsepp and Favreau2012).
(Color online) Full-structure refinement of woodallite, including both charge-balance occupancy constraints and the Warren ccp twinning fault correction.
IV. CONCLUSION
Powder diffraction is applied in a very diverse range of fields and lessons learned in one area are often applicable in another. Minerals can exhibit a different range of challenges from the synthetic materials found in the laboratory. The hydrotalcites are a good example in this regard. Synthetic hydrotalcites are usually poorly crystalline, the diffraction patterns often looking nothing like those of the natural stichtite or woodallite samples. Why should the chemist or other materials researcher bother with minerals? Carrying out small studies on materials outside your normal “comfort zone” can be a good training tool when done properly and add useful expertise into your “quiver” of tools for future problems. The challenge of working with small, yet sometimes irreplaceable samples forces you to critically evaluate how you carry out things from sample preparation to data collection.
ACKNOWLEDGEMENTS
The painstaking efforts of Stuart Mills (ex of University of British Columbia and now Museums Victoria) and Sasha Wilson (ex of University of British Columbia and now Monash University) in preparing many of the mineral samples mentioned in this paper cannot be emphasized enough. The author also thanks Ron Peterson of Queens University for materials relating to cranswickite, Peter Stephens for attempting in vain to collect synchrotron data on a sample of angastonite, and Bob Von Dreele for the 11BM jadarite data. A portion of this research at the ORNL's Spallation Neutron Source was sponsored by the Scientific User Facility Office Division, Office of Basic Energy Sciences, US Department of Energy.