1 Introduction
Most studies of turbulent mixing in the literature (e.g. see Warhaft Reference Warhaft2000; Gotoh & Yeung Reference Gotoh, Yeung, Davidson, Kaneda and Sreenivasan2013) are Eulerian in nature, being concerned with concentration or temperature fields defined at a fixed set of measurement locations or grid points in space. However, a Lagrangian approach that follows the trajectories of molecules of a diffusing substance (or equivalent marker particle for temperature) is physically a more natural way (Monin & Yaglom Reference Monin and Yaglom1971; Sawford & Pinton Reference Sawford, Pinton, Davidson, Kaneda and Sreenivasan2013) to treat scalar transport. These molecules or markers are transported by the fluid flow, but also undergo Brownian motion relative to the fluid, at a rate set by the molecular diffusivity,
 ${\it\kappa}$
(Saffman Reference Saffman1960). Frequently, turbulent transport captured by the motion of infinitesimal fluid elements in a Lagrangian frame (Pope Reference Pope1994; Yeung Reference Yeung2002; Toschi & Bodenschatz Reference Toschi and Bodenschatz2009) is thought to be the dominant process. Nevertheless, there are practical reasons, such as high molecular diffusivity (as in odours from organic substances in waste management), and closeness to localized sources or boundaries, that require explicit consideration of molecular diffusion (Durbin Reference Durbin1980; Sawford & Hunt Reference Sawford and Hunt1986; Thomson Reference Thomson2003). In addition, it is of fundamental interest to understand the circumstances under which the statistics of molecular trajectories can be replaced or approximated by the statistics of fluid particle displacements. Consequently, it is important to understand the interaction between turbulence and molecular diffusion for a range of Reynolds numbers and Schmidt numbers (
 $Sc={\it\nu}/{\it\kappa}$
, where
 ${\it\nu}$
is the kinematic viscosity).
On scales large compared with the molecular mean free path, to a very close approximation, molecular trajectories can be represented by the trajectories of Brownian particles which move according the stochastic differential equation (Pope Reference Pope1998)
 $$\begin{eqnarray}\displaystyle \text{d}\boldsymbol{x}^{m}(t)=\boldsymbol{u}(\text{}\boldsymbol{x}^{m}(t),t)\,\text{d}t+\sqrt{2{\it\kappa}}\,\text{d}\boldsymbol{W}(t), & & \displaystyle\end{eqnarray}$$
where
 $\boldsymbol{x}^{m}(t)$
is the molecular position at time
 $t$
,
 $\boldsymbol{u}(\text{}\boldsymbol{x}^{m}(t),t)$
is the instantaneous Eulerian velocity evaluated at
 $\boldsymbol{x}^{m}(t)$
and
 $\boldsymbol{W}(t)$
is a standardized three-dimensional (3D) isotropic Wiener process (Gardiner Reference Gardiner1983). Henceforth, we refer to such Brownian particles as ‘molecules’. Although direct measurements are clearly difficult (more than for fluid particles), (1.1) provides a starting point for theoretical and numerical analyses. In particular, in direct numerical simulations (DNS), molecules can be tracked forwards in time as for fluid particles, with the Wiener process contribution implemented by drawing Gaussian random numbers at every time step. If a passive contaminant is released from a localized source, the subsequent displacement of molecules away from the source has a direct impact on the extent of spatial spreading achieved over a period of time. However, mixing also inherently involves how small parcels of contaminant material previously far apart and of different properties may be brought close together. A close connection to the Eulerian framework is in fact made by studying backward trajectories, especially for pairs close together at a chosen time of reference (Thomson Reference Thomson1990; Sawford, Yeung & Borgas Reference Sawford, Yeung and Borgas2005; Srinivasan & Papavassiliou Reference Srinivasan and Papavassiliou2012) – efficient mixing would be indicated if there is a strong likelihood for such pairs to have come from locations far apart.
In this paper we have two primary objectives, which we address using DNS of (for simplicity) stationary forced isotropic turbulence. The first is to quantify and understand the properties of the trajectories of molecules taken singly and in pairs, in both forward and backward reference frames. Both high- and low-diffusivity regimes are considered, with the Schmidt number varied from 0.001 to 1000. We examine ballistic and diffusive behaviours at small and large times respectively, including comparisons with theoretical results given by Saffman (Reference Saffman1960) where applicable. Because Brownian motion is not differentiable, a molecule does not have a well-defined velocity. However, as Saffman (Reference Saffman1960) showed, an integral time scale based on the fluid velocity along the molecular trajectories can be used to infer a turbulent diffusivity. In addition, we are interested in any behaviour at intermediate times that may resemble classical Richardson scaling (where mean-squared separation grows as
 $t^{3}$
) for fluid particle pairs. Results are compared with those for fluid particle pairs in high-Reynolds-number DNS (Buaria, Sawford & Yeung Reference Buaria, Sawford and Yeung2015) and theoretical predictions for molecular pairs (Eyink Reference Eyink2011; Benveniste & Drivas Reference Benveniste and Drivas2014).
Our second objective is to establish and demonstrate, explicitly, a direct connection between molecular dispersion and passive scalar mixing at the same Schmidt number and Reynolds number. It is well known that the Schmidt number in applications can vary widely, and there are fundamental differences between weakly diffusive (
 $Sc\gg 1$
) (Batchelor Reference Batchelor1959) and highly diffusive (
 $Sc\ll 1$
) (Batchelor, Howells & Townsend Reference Batchelor, Howells and Townsend1959) regimes. Both of these asymptotic regimes introduce difficulties for Eulerian investigations (Donzis, Sreenivasan & Yeung Reference Donzis, Sreenivasan and Yeung2010; Yeung & Sreenivasan Reference Yeung and Sreenivasan2014). However, regardless of the value of
 $Sc$
, in the Lagrangian framework, the covariance between scalar fluctuations separated by a distance
 $r$
in space at a given time (
 $t$
) is determined by the displacement statistics of two molecules that are a distance
 $r$
apart at time
 $t$
(Durbin Reference Durbin1980; Borgas et al.
Reference Borgas, Sawford, Xu, Donzis and Yeung2004). For incompressible flow, either backwards or forwards formulations of these statistics can be used, but the backwards formulation is computationally more efficient and mathematically more tractable (Sawford et al.
Reference Sawford, Yeung and Borgas2005). In the limit
 $r\rightarrow 0$
we recover the single-point scalar variance (
 $\langle {\it\phi}^{2}\rangle$
). A very appealing scenario for verifying this Eulerian–Lagrangian correspondence is the case of passive scalar fluctuations driven by a uniform mean gradient, which has received much attention in the Eulerian framework (Overholt & Pope Reference Overholt and Pope1996; Yeung, Xu & Sreenivasan Reference Yeung, Xu and Sreenivasan2002; Watanabe & Gotoh Reference Watanabe and Gotoh2006), especially for
 $Sc\lesssim 1$
. In this case, there is a particularly simple connection between the backwards relative dispersion of a pair of particles and the scalar dissipation rate. This allows us to use backwards molecular trajectories to obtain precise information on processes contributing to net increase (i.e. production) or decrease (i.e. dissipation) of passive scalar fluctuations.
Because in DNS basic governing equations are integrated forward in time, extraction of backward statistics is a non-trivial task. Nevertheless, recently we (Buaria et al.
Reference Buaria, Sawford and Yeung2015) have been able to obtain reliable results on fluid particle pairs using a postprocessing algorithm that scales well to large problem sizes and particle counts appropriate for high Reynolds numbers. Extension of this algorithm to molecules and pairs of molecules is straightforward. As in Buaria et al. (Reference Buaria, Sawford and Yeung2015), we have obtained results at Taylor-scale Reynolds numbers from 140 to 1000. However, because molecular diffusion effects become less pronounced at higher Reynolds numbers, in the present work we put a greater emphasis on results over a wide range of Schmidt numbers at moderate Reynolds numbers. The results at early times agree well with the exact theoretical results of Saffman (Reference Saffman1960). At intermediate times, evidence for Richardson scaling is stronger for molecules of
 $Sc\sim O(1)$
than for fluid particles, but absent for molecules of
 $Sc\ll 1$
which are dominated by molecular diffusion. With sufficient care in the numerical procedures we find that our Lagrangian estimates of production and dissipation of scalar fluctuations, which are applicable at any Schmidt number, agree well with Eulerian results.
The rest of the paper is organized as follows. In § 2 we begin with a summary of the theoretical background underlying this work, with a focus on asymptotic limiting behaviours (including some results from Saffman (Reference Saffman1960)) for statistics of molecules taken singly and in pairs, as well as their role in a Lagrangian description of turbulent mixing and its connection to the corresponding Eulerian formulation. Several key aspects of the DNS numerical approach specific to molecules are noted in § 3. In § 4 we provide results on one-molecule statistics, including the substance autocorrelation and the molecular integral time scale as a function of Reynolds number and Schmidt number. In § 5 we present statistics of molecular pair separation and examine evidence for possible Richardson scaling behaviour in both forward and backward statistics. In § 6 we present Lagrangian results for turbulent mixing based on molecular trajectories, which are shown to be in good agreement with Eulerian results on passive scalars driven by a uniform mean gradient. Finally, in § 7 we summarize the conclusions of this work and briefly discuss several possible future extensions. Appendices A and B give some details of derivations used in §§ 2.2 and 6 respectively.
2 Theory
In this section we present the theoretical background for our numerical results in this paper, including the statistics of the displacement of single molecules (§ 2.1), the separation between pairs of molecules at specified initial separations in both forward and backward reference frames (§ 2.2), and the connection between Lagrangian and Eulerian results for passive scalar mixing (§ 2.3). For stationary turbulence we expect the theoretical results derived by Saffman (Reference Saffman1960) for one-molecule statistics to hold equally well for both forward and backward dispersion. However, for pairs, it is important to make the distinction. It is well known that backward relative dispersion at intermediate times is stronger than forward dispersion (Sawford et al. Reference Sawford, Yeung and Borgas2005; Berg et al. Reference Berg, Luthi, Mann and Ott2006). There has been, in fact, considerable recent interest in backward dispersion of fluid particles (Jucha et al. Reference Jucha, Xu, Pumir and Bodenschatz2014; Buaria et al. Reference Buaria, Sawford and Yeung2015) as well as theoretical work on molecular trajectories (Eyink Reference Eyink2011; Benveniste & Drivas Reference Benveniste and Drivas2014). However, current knowledge of molecular path statistics especially with regard to their Schmidt number dependence and connection to Eulerian passive scalar statistics is still limited.
2.1 Dispersion of single molecules
Saffman (Reference Saffman1960) showed that the mean-square displacement of a single molecule consists of a diffusive Brownian motion contribution and a turbulence term based on the ‘substance autocorrelation’ function (
 ${\it\rho}_{m}$
), which is the fluid velocity autocorrelation along molecular trajectories. A tensor-form result assuming isotropy is
 $$\begin{eqnarray}\displaystyle \langle Y_{i}^{m}Y_{i}^{m}\rangle (t)=\langle u_{i}u_{i}\rangle \int _{0}^{t}\int _{0}^{t}{\it\rho}_{m}(t^{\prime },t^{\prime \prime })\,\text{d}t^{\prime }\,\text{d}t^{\prime \prime }+6{\it\kappa}t, & & \displaystyle\end{eqnarray}$$
where
 $Y_{i}^{m}(t)=x_{i}^{m}(t)-x_{i}^{m}(0)$
is the molecular displacement (we use superscript
 $m$
to denote single-molecule quantities in contrast to
 $+$
for fluid particles). If the turbulence is stationary and isotropic with root mean square component velocity
 ${\it\sigma}_{u}$
, then
 ${\it\rho}_{m}$
is a function of the time lag (
 ${\it\tau}=|t^{\prime }-t^{\prime \prime }|$
) alone and (2.1) becomes
 $$\begin{eqnarray}\displaystyle \langle Y_{i}^{m}Y_{i}^{m}\rangle (t)=6{\it\sigma}_{u}^{2}\int _{0}^{t}(t-{\it\tau}){\it\rho}_{m}({\it\tau})\,\text{d}{\it\tau}+6{\it\kappa}t, & & \displaystyle\end{eqnarray}$$
which can be compared with
 $$\begin{eqnarray}\displaystyle \langle Y_{i}^{+}Y_{i}^{+}\rangle (t)=6{\it\sigma}_{u}^{2}\int _{0}^{t}(t-{\it\tau}){\it\rho}_{L}({\it\tau})\,\text{d}{\it\tau} & & \displaystyle\end{eqnarray}$$
for fluid particles, where
 ${\it\rho}_{L}({\it\tau})$
is the Lagrangian velocity autocorrelation. A term that represents the interaction between molecular diffusion and turbulence can be defined as
 $$\begin{eqnarray}\displaystyle {\rm\Delta}(t)=\langle Y_{i}^{m}Y_{i}^{m}\rangle (t)-6{\it\kappa}t-\langle Y_{i}^{+}Y_{i}^{+}\rangle (t). & & \displaystyle\end{eqnarray}$$
We address both small- and large-time limits. At small
 ${\it\tau}$
, Saffman used a Taylor-series expansion to write the substance autocorrelation in the form
 $$\begin{eqnarray}\displaystyle {\it\rho}_{m}({\it\tau})={\it\rho}_{L}({\it\tau})-\frac{1}{3}\frac{{\it\kappa}{\it\omega}^{2}}{{\it\sigma}_{u}^{2}}|{\it\tau}|+O({\it\tau}^{2}),\quad \text{for}~|{\it\tau}|/t_{{\it\eta}}\ll \min (1,Sc), & & \displaystyle\end{eqnarray}$$
where
 ${\it\omega}^{2}$
is the mean enstrophy and
 $t_{{\it\eta}}$
is the Kolmogorov time scale. We note here that
 ${\it\rho}_{L}({\it\tau})=1-O({\it\tau}^{2})$
for small time lags, so that the second term on the right-hand side is entirely due to the interaction of the turbulent and molecular motions. The small-time limit here is defined by both
 $t_{{\it\eta}}$
and the time scale of molecular diffusion,
 $Sct_{{\it\eta}}$
. Thus, as
 $Sc$
decreases, and molecular diffusion acts faster, the value of
 $t$
required to observe this power law also becomes much smaller. The presence of a linear (
 $|{\it\tau}|$
) term in (2.5) reflects the non-differentiable nature of the velocity at the molecular position. To non-dimensionalize the second term in (2.5) we use the relations
 $\langle {\it\omega}_{i}{\it\omega}_{i}\rangle =\langle {\it\epsilon}\rangle /{\it\nu}$
and
 $\langle {\it\epsilon}\rangle =15{\it\nu}{\it\sigma}_{u}^{2}/{\it\lambda}^{2}$
, where
 $\langle {\it\epsilon}\rangle$
is the mean dissipation rate and
 ${\it\lambda}$
is the Taylor length scale, to obtain
 $$\begin{eqnarray}\displaystyle {\it\rho}_{m}({\it\tau})={\it\rho}_{L}({\it\tau})-\frac{\sqrt{15}}{3}\frac{1}{R_{{\it\lambda}}}\frac{1}{Sc}\frac{|{\it\tau}|}{t_{{\it\eta}}}+O({\it\tau}^{2}),\quad \text{for}~|{\it\tau}|/t_{{\it\eta}}\ll \min (1,Sc), & & \displaystyle\end{eqnarray}$$
where
 $R_{{\it\lambda}}={\it\sigma}_{u}{\it\lambda}/{\it\nu}$
is the Taylor-scale Reynolds number.
By substituting this in (2.2) and non-dimensionalizing by Kolmogorov variables we arrive at the following:
 $$\begin{eqnarray}\displaystyle \frac{\langle Y_{i}^{m}Y_{i}^{m}\rangle (t)}{{\it\eta}^{2}}=\frac{6}{Sc}\frac{t}{t_{{\it\eta}}}+\frac{3R_{{\it\lambda}}}{\sqrt{15}}\left(\frac{t}{t_{{\it\eta}}}\right)^{2}-\frac{1}{3Sc}\left(\frac{t}{t_{{\it\eta}}}\right)^{3}+O(t^{4}), & & \displaystyle\end{eqnarray}$$
where terms on the right-hand side represent the direct effect of molecular diffusion, fluid particle motion in the ballistic limit, and the interaction between turbulence and molecular diffusion. The diffusion term has the same form at any time
 $t$
, while the
 $t^{2}$
ballistic term requires
 $|{\it\tau}|/t_{{\it\eta}}\ll 1$
and the
 $t^{3}$
interaction term requires
 $t/t_{{\it\eta}}\ll \min (1,Sc)$
. It is apparent that, at any time
 $t$
, the relative importance of different terms in (2.7) depends on both
 $R_{{\it\lambda}}$
and
 $Sc$
as well as
 $t/t_{{\it\eta}}$
, while the interaction term itself (when written in Kolmogorov scaling) depends on
 $Sc$
only, as
 $$\begin{eqnarray}\displaystyle {\rm\Delta}(t)/{\it\eta}^{2}=-\frac{1}{3Sc}(t/t_{{\it\eta}})^{3}+O(t^{4}). & & \displaystyle\end{eqnarray}$$
At asymptotically large times, with a ‘molecular’ integral time scale defined as
 $T_{m}=\int _{0}^{\infty }\!{\it\rho}_{m}({\it\tau})\,\text{d}{\it\tau}$
, the mean-square displacement approaches a diffusive regime of linear growth (Taylor Reference Taylor1921), i.e.
 $$\begin{eqnarray}\displaystyle \langle Y_{i}^{m}Y_{i}^{m}\rangle (t)\approx 6{\it\sigma}_{u}^{2}T_{m}t+6{\it\kappa}t,\quad \text{for}~t\gg T_{m}. & & \displaystyle\end{eqnarray}$$
With this and a similar result for
 $\langle Y_{i}^{+}Y_{i}^{+}\rangle$
in terms of the Lagrangian integral time scale (
 $T_{L}$
), the interaction term in (2.4) becomes
 $$\begin{eqnarray}\displaystyle {\rm\Delta}(t)=6{\it\sigma}_{u}^{2}(T_{m}-T_{L})t,\quad \text{for}~t\gg T_{m},T_{L}. & & \displaystyle\end{eqnarray}$$
Saffman (Reference Saffman1960) also gave an approximate result for
 ${\it\rho}_{m}({\it\tau})$
at time lags
 ${\it\tau}\gg t_{{\it\eta}}$
:
 $$\begin{eqnarray}\displaystyle {\it\rho}_{m}({\it\tau})={\it\rho}_{L}({\it\tau})-a\frac{{\it\kappa}{\it\omega}}{{\it\sigma}_{u}^{2}}{\it\rho}_{L}({\it\tau}), & & \displaystyle\end{eqnarray}$$
where
 $a$
is a proportionality constant, which (Saffman Reference Saffman1960) estimated to be approximately
 $0.23$
. On substituting into (2.2), it can be shown that the interaction term then scales in the same way as
 $\langle Y_{i}^{+}Y_{i}^{+}\rangle$
, such that for
 $t\gg t_{{\it\eta}}$
, the ratio
 $$\begin{eqnarray}\displaystyle {\rm\Delta}/(\langle Y_{i}^{+}Y_{i}^{+}\rangle )\approx -a\sqrt{15}Sc^{-1}{R_{{\it\lambda}}}^{-1} & & \displaystyle\end{eqnarray}$$
becomes constant. On applying this relation for
 $t\gg (T_{m},T_{L})$
, (2.10) also gives
 $$\begin{eqnarray}\displaystyle 1-T_{m}/T_{L}\approx a\sqrt{15}Sc^{-1}{R_{{\it\lambda}}}^{-1}, & & \displaystyle\end{eqnarray}$$
which can be tested using the DNS data available in the present work.
2.2 Dispersion of molecular pairs
Consider two molecules at positions
 $\boldsymbol{x}^{m,1}(t)$
and
 $\boldsymbol{x}^{m,2}(t)$
respectively. Using (1.1), the separation vector
 $\boldsymbol{r}(t)=\boldsymbol{x}^{m,1}(t)-\boldsymbol{x}^{m,2}(t)$
evolves by
 $$\begin{eqnarray}\displaystyle \text{d}\boldsymbol{r}(t)=[\boldsymbol{u}(\text{}\boldsymbol{x}^{m,1},t)-\boldsymbol{u}(\text{}\boldsymbol{x}^{m,2},t)]\,\text{d}t+\sqrt{4{\it\kappa}}\,\text{d}\boldsymbol{W}^{(r)}, & & \displaystyle\end{eqnarray}$$
where
 $\text{d}\boldsymbol{W}^{(r)}=(\text{d}\boldsymbol{W}^{(1)}-\text{d}\boldsymbol{W}^{(2)})/\sqrt{2}$
is also a standardized incremental Wiener process (since the Brownian motion of each molecule is independent). The mean-square relative displacement for molecule pairs is given by
 $$\begin{eqnarray}\displaystyle \langle |\boldsymbol{r}(t)-\boldsymbol{r}(0)|^{2}\rangle =\int _{0}^{t}\int _{0}^{t}\langle \boldsymbol{u}^{(r)}(t^{\prime })\boldsymbol{\cdot }\boldsymbol{u}^{(r)}(t^{\prime \prime })\rangle \,\text{d}t^{\prime }\,\text{d}t^{\prime \prime }+12{\it\kappa}t, & & \displaystyle\end{eqnarray}$$
where
 $\boldsymbol{u}^{(r)}(t)$
is the relative fluid velocity between molecular positions
 $\boldsymbol{x}^{m,1}(t)$
and
 $\boldsymbol{x}^{m,2}(t)$
. Asymptotic behaviours at small, large and intermediate times are addressed below.
Unlike fluid particles, molecules can separate even if they happen to be coincident at a given time. For the case
 $\boldsymbol{r}(0)=\mathbf{0}$
, and under the conditions
 $|\boldsymbol{r}(t)|=r(t)\ll {\it\eta}$
and
 $t\ll t_{{\it\eta}}$
, Saffman (Reference Saffman1960) obtained a small-time result which can be written as
 $$\begin{eqnarray}\displaystyle \langle r^{2}(t)\rangle =12{\it\kappa}t+{\textstyle \frac{4}{3}}{\it\kappa}t^{3}/t_{{\it\eta}}^{2}+O(t^{4}). & & \displaystyle\end{eqnarray}$$
However, we are interested in a more general result that is also applicable to the small-time behaviour of molecular pairs with small but finite initial separation. This requires a derivation based on Taylor-series expansions in both time and space, which is presented in appendix A. Under the conditions
 $r(t)\ll {\it\eta}$
(and hence
 $|\boldsymbol{r}(0)|=r_{0}\ll {\it\eta}$
) and
 $t\ll t_{{\it\eta}}$
, the result obtained, to
 $O(t^{3})$
, can be written in Kolmogorov variables as
 $$\begin{eqnarray}\displaystyle \frac{\langle |\boldsymbol{r}(t)-\boldsymbol{r}(0)|^{2}\rangle }{{\it\eta}^{2}}=\left(\frac{r_{0}}{{\it\eta}}\right)^{2}\left[\frac{1}{3}\left(\frac{t}{t_{{\it\eta}}}\right)^{2}-\frac{7~S_{{\it\epsilon}}}{18\sqrt{15}}\left(\frac{t}{t_{{\it\eta}}}\right)^{3}\right]+\frac{12}{Sc}\left[\frac{|t|}{t_{{\it\eta}}}+\frac{1}{9}\left(\frac{|t|}{t_{{\it\eta}}}\right)^{3}\right], & & \displaystyle \nonumber\\ \displaystyle & & \displaystyle\end{eqnarray}$$
where
 $S_{{\it\epsilon}}$
is the so-called dissipation skewness (Kerr Reference Kerr1985), which is directly related to the third moment of the longitudinal velocity gradients. In (2.17) the first bracketed term represents the contribution from fluid particle dispersion, whereas the second bracketed term is essentially Saffman’s result for coincident molecular pairs. It is clear that if
 $r_{0}=0$
, we recover Saffman’s result in (2.16), while for
 $Sc\rightarrow \infty$
, we recover the results for fluid particle pairs. This equation holds for forward relative dispersion. We have introduced the absolute value of the time in the Saffman term in (2.17) because for backward relative dispersion, which can be obtained by replacing
 $t$
by
 $-t$
, this term is unchanged (see appendix A), whereas the sign of the fluid particle
 $t^{3}$
term in the first bracket changes (Jucha et al.
Reference Jucha, Xu, Pumir and Bodenschatz2014; Buaria et al.
Reference Buaria, Sawford and Yeung2015). In general, under the specified conditions, the
 $t^{2}$
and
 $t$
terms in both brackets will dominate compared with their respective
 $t^{3}$
counterparts. However, the relative magnitude of the
 $t^{2}$
term in the first bracket, compared with both the
 $t$
and
 $t^{3}$
terms in the second bracket, depends strongly on
 $r_{0}/{\it\eta}$
and
 $Sc$
. For weak molecular diffusion (
 $Sc\gg 1$
), we can find a range of time given by
 $Sc^{-1}(r_{0}/{\it\eta})^{-2}\ll t/t_{{\it\eta}}\ll 1$
for which the
 $t^{2}$
term dominates over the
 $t$
term (and hence also the
 $t^{3}$
term) in the second bracket. However, for strong molecular diffusion, the linear
 $t$
term will always dominate over the
 $t^{2}$
term, since
 $r_{0}\ll {\it\eta}$
. Similarly, the Saffman
 $t^{3}$
interaction term in the second bracket dominates compared with the
 $t^{2}$
term for
 $(r_{0}/{\it\eta})^{2}\ll Sc^{-1}t/t_{{\it\eta}}$
and
 $t/t_{{\it\eta}}\ll \min (1,Sc)$
. On the other hand, for any fixed
 $r_{0}$
, the
 $t^{2}$
term dominates (over the
 $t^{3}$
term in the second bracket) for small enough time
 $t/t_{{\it\eta}}\ll Sc(r_{0}/{\it\eta})^{2}$
.
For arbitrary (not necessarily small) values of
 $r_{0}$
we can use (2.15) directly, to obtain, to leading order,
 $$\begin{eqnarray}\displaystyle \frac{\langle |\boldsymbol{r}(t)-\boldsymbol{r}(0)|^{2}\rangle }{{\it\eta}^{2}}=\frac{\langle D_{LL}(r_{0})+2D_{NN}(r_{0})\rangle }{{\it\eta}^{2}}\left(\frac{t}{t_{{\it\eta}}}\right)^{2}+\frac{12}{Sc}\left(\frac{t}{t_{{\it\eta}}}\right)+O(t^{3}), & & \displaystyle\end{eqnarray}$$
where
 $D_{LL}(\cdot )$
and
 $D_{NN}(\cdot )$
are the Eulerian longitudinal and transverse structure functions respectively. The
 $t^{2}$
term on the right-hand side is the same as the fluid particle relative displacement at small times for any value of
 $r_{0}$
(Sawford, Yeung & Hackl Reference Sawford, Yeung and Hackl2008). For
 $r_{0}\ll {\it\eta}$
, using a Taylor-series expansion, this term gives the
 $t^{2}$
term in (2.17).
In the large-time limit, when the displacements of both molecules become independent of each other, the mean-square relative displacement becomes twice the mean-squared displacement of a single molecule. Accordingly, by (2.9), at times
 $t\gg T_{m}$
, we obtain
 $$\begin{eqnarray}\displaystyle \langle |\boldsymbol{r}(t)-\boldsymbol{r}(0)|^{2}\rangle \approx 12{\it\sigma}_{u}^{2}T_{m}t+12{\it\kappa}t. & & \displaystyle\end{eqnarray}$$
In practice, because of memory effects in the displacement, the time needed to show clear agreement with (2.19) may be well over 10 integral time scales (Yeung Reference Yeung1994).
At intermediate times, it is reasonable to look for an ‘inertial’ scaling range where the mean-squared separation is independent of both the small-scale and large-scale motions, as well as the memory of initial separations. An extension of Richardson scaling for fluid particle pairs to molecules then suggests (Sawford & Pinton Reference Sawford, Pinton, Davidson, Kaneda and Sreenivasan2013)
 $$\begin{eqnarray}\displaystyle \langle |\boldsymbol{r}(t)-\boldsymbol{r}(0)|^{2}\rangle =g_{m}\langle {\it\epsilon}\rangle t^{3},\quad \text{for}~\max (t_{{\it\eta}},t_{0},t_{{\it\kappa}})\ll t\ll T_{m}, & & \displaystyle\end{eqnarray}$$
where
 $g_{m}$
is Richardson’s constant,
 $t_{0}=(r_{0}^{2}/\langle {\it\epsilon}\rangle )^{1/3}$
is the Batchelor time scale, which measures the memory of the initial separation (
 $r_{0}$
), and
 $t_{{\it\kappa}}=({\it\kappa}/\langle {\it\epsilon}\rangle )^{1/2}$
is the time scale of the interaction of molecular diffusion with inertial range eddies. Since backward dispersion is stronger than forward dispersion especially at intermediate times, the Richardson constant for backward dispersion is larger than that for forward dispersion, as reported in recent studies (Buaria et al.
Reference Buaria, Sawford and Yeung2015; Bragg, Ireland & Collins Reference Bragg, Ireland and Collins2016) of fluid particle pairs. At the same time, observation of Richardson scaling generally requires a higher Reynolds number in the case of backward dispersion, because, as a result of the more rapid growth, the transition to the diffusive regime occurs earlier in the backwards case (Buaria et al.
Reference Buaria, Sawford and Yeung2015). For molecules, an additional question is how the scaling depends on the Schmidt number. One of our objectives in this paper is to investigate Richardson scaling for both forward and backward molecular dispersion over wider ranges of Reynolds and Schmidt numbers than have been reported by other authors (Eyink Reference Eyink2011; Eyink & Benveniste Reference Eyink and Benveniste2013; Benveniste & Drivas Reference Benveniste and Drivas2014).
2.3 Connections to Eulerian passive scalar mixing
In the Lagrangian theory of scalar mixing, the moments of the scalar concentration field can be expressed in terms of both the forward and backward displacement of marked molecules (Sawford & Pinton Reference Sawford, Pinton, Davidson, Kaneda and Sreenivasan2013). We decompose the instantaneous scalar field
 $\tilde{{\it\phi}}$
into the sum of the mean
 ${\it\Phi}$
and fluctuation
 ${\it\phi}$
. In general, the
 $n$
th-order moment of
 $\widetilde{{\it\phi}}$
due to a source
 $S(\boldsymbol{x},t)$
can be obtained in terms of backward displacements as
 $$\begin{eqnarray}\displaystyle \langle \widetilde{{\it\phi}}^{n}(\boldsymbol{x},t)\rangle & = & \displaystyle \int _{-\infty }^{t}\cdots \int _{-\infty }^{t}\int _{V}\cdots \int _{V}P(\boldsymbol{x}_{1},t_{1};\ldots ;\boldsymbol{x}_{n},t_{n}\mid \boldsymbol{x},t)\nonumber\\ \displaystyle & & \displaystyle \times \,S(\boldsymbol{x}_{1},t_{1})\ldots S(\boldsymbol{x}_{n},t_{n})\text{d}\boldsymbol{x}_{1}\ldots \text{d}\boldsymbol{x}_{n}\,\text{d}t_{1}\ldots \text{d}t_{n},\end{eqnarray}$$
where
 $P(\boldsymbol{x}_{1},t_{1};\ldots ;\boldsymbol{x}_{n},t_{n}\mid \boldsymbol{x},t)$
is the probability density function (PDF) for
 $n$
molecules to be at positions
 $\boldsymbol{x}_{1},\ldots ,\boldsymbol{x}_{n}$
at earlier times
 $t_{1},\ldots ,t_{n}<t$
respectively, subject to the condition that they have all arrived at
 $\boldsymbol{x}$
at time
 $t$
. We note that the average here is over realizations of the Brownian motion and a random ensemble of velocity fields. This relation is exact and is the fundamental connection between the displacement statistics of molecular trajectories and scalar concentration statistics. The advantages of the backwards formulation are twofold. First, it is mathematically simpler in that the scalar moments are defined in terms of moments of the source function: by carrying out the integrations in space (2.21) also leads to
 $$\begin{eqnarray}\displaystyle \langle \widetilde{{\it\phi}}^{n}(\boldsymbol{x},t)\rangle =\int _{-\infty }^{t}\cdots \int _{-\infty }^{t}\langle S(\boldsymbol{x}^{m,1}(t_{1}))\ldots S(\boldsymbol{x}^{m,n}(t_{n}))\mid \boldsymbol{x},t\rangle \,\text{d}t_{1}\ldots \text{d}t_{n}. & & \displaystyle\end{eqnarray}$$
Second, it is computationally more efficient since only trajectories ending at the measurement location
 $(\boldsymbol{x},t)$
need to be sampled.
For the special case of an instantaneous uniform scalar gradient source in the
 $x_{1}$
direction
 $S(\boldsymbol{x},t)=Gx_{1}{\it\delta}(t)$
in stationary isotropic turbulence, (2.21) can be simplified for
 $n=2$
to obtain the scalar variance. Borgas et al. (Reference Borgas, Sawford, Xu, Donzis and Yeung2004) and Sawford et al. (Reference Sawford, Yeung and Borgas2005) showed that
 $$\begin{eqnarray}\displaystyle \langle {\it\phi}^{2}\rangle & = & \displaystyle G^{2}\langle Y_{1}^{m,1}(0)Y_{1}^{m,2}(0)\mid r_{0}(t)=0\rangle \nonumber\\ \displaystyle & = & \displaystyle G^{2}\langle (Y_{1}^{m})^{2}\rangle -{\textstyle \frac{1}{2}}G^{2}\langle r_{1}^{2}(0)\mid r_{0}(t)=0\rangle ,\end{eqnarray}$$
where
 $\langle Y_{1}^{m,1}(0)Y_{1}^{m,2}(0)\mid r_{0}(t)=0\rangle$
is the conditional covariance of the
 $x_{1}$
component of the backward displacements at time zero of a pair of molecules labelled at time
 $t$
,
 $\langle (Y_{1}^{m})^{2}\rangle$
is the
 $x_{1}$
component of the one-particle dispersion over a time period
 $t$
(equivalent for both backward and forward dispersion) and
 $\langle r_{1}^{2}\rangle$
is the
 $x_{1}$
component of the backward relative dispersion at time zero, such that at the final time
 $t$
, the separation distance (
 $r_{0}$
) between two molecules becomes zero. In isotropic turbulence it is also appropriate (and effective for improved sampling) to consider an ensemble average over gradient sources oriented along each of the three coordinate axes. It follows from (2.23) that
 $$\begin{eqnarray}\displaystyle \langle {\it\phi}^{2}\rangle ={\textstyle \frac{1}{3}}G^{2}\langle Y_{i}^{m}Y_{i}^{m}\rangle -{\textstyle \frac{1}{6}}G^{2}\langle r_{i}r_{i}\rangle _{r_{0}(t)=0}, & & \displaystyle\end{eqnarray}$$
where we have simplified our notation for conditioning on
 $r_{0}(t)=0$
. By substituting
 $\langle Y_{i}^{m}Y_{i}^{m}\rangle$
from (2.2) and differentiating with respect to
 $t$
, it follows that
 $$\begin{eqnarray}\displaystyle \partial \langle {\it\phi}^{2}\rangle /\partial t=2G^{2}{\it\kappa}_{t}+2G^{2}{\it\kappa}-\frac{1}{6}G^{2}\frac{\text{d}}{\,\text{d}t}\langle r_{i}r_{i}\rangle _{r_{0}(t)=0}, & & \displaystyle\end{eqnarray}$$
where
 ${\it\kappa}_{t}$
denotes
 ${\it\sigma}_{u}^{2}\int _{0}^{t}{\it\rho}_{m}({\it\tau})\,\text{d}{\it\tau}$
(from (2.2) using the Leibniz rule for integrals), which in the large-time limit equals
 ${\it\sigma}_{u}^{2}T_{m}$
.
Equation (2.21) can be generalized to calculate joint velocity–scalar moments in terms of a similar integral over the joint velocity–displacement PDF. The result for the velocity–scalar covariance is (Sawford et al. Reference Sawford, Yeung and Borgas2005)
 $$\begin{eqnarray}\displaystyle \langle u_{i}{\it\phi}\rangle =-G{\it\kappa}_{t}{\it\delta}_{i{\it\alpha}}, & & \displaystyle\end{eqnarray}$$
for a mean gradient
 $G$
in the
 $x_{{\it\alpha}}$
direction. The gradient-transport nature of this relation suggests that
 ${\it\kappa}_{t}$
may be interpreted as the eddy diffusivity of the scalar fluctuations corresponding to the molecular motions.
Many Eulerian studies of turbulent mixing have considered a passive scalar field driven by a uniform mean gradient (
 $\boldsymbol{{\rm\nabla}}{\it\Phi}$
), governed by the equation
 $$\begin{eqnarray}\displaystyle \partial {\it\phi}/\partial t+\boldsymbol{u}\boldsymbol{\cdot }\boldsymbol{{\rm\nabla}}{\it\phi}=-\boldsymbol{u}\boldsymbol{\cdot }\boldsymbol{{\rm\nabla}}{\it\Phi}+{\it\kappa}{\rm\nabla}^{2}{\it\phi}. & & \displaystyle\end{eqnarray}$$
The scalar variance evolves by
 $$\begin{eqnarray}\displaystyle \partial \langle {\it\phi}^{2}\rangle /\partial t=P-{\it\chi}, & & \displaystyle\end{eqnarray}$$
where
 $P=-2\langle \boldsymbol{u}{\it\phi}\rangle \boldsymbol{\cdot }\boldsymbol{{\rm\nabla}}{\it\Phi}$
is the scalar production and
 ${\it\chi}=2{\it\kappa}\langle \boldsymbol{{\rm\nabla}}{\it\phi}\boldsymbol{\cdot }\boldsymbol{{\rm\nabla}}{\it\phi}\rangle$
is the scalar dissipation. Unlike in work focused on a stationary state, here we are interested in both production and dissipation as functions of time from
 $t=0$
onwards. With the choice
 $\boldsymbol{{\rm\nabla}}{\it\Phi}=G\hat{e_{1}}$
(and averaging results for
 $\boldsymbol{{\rm\nabla}}{\it\Phi}$
along other coordinate directions), we obtain
 $P=2G^{2}{\it\kappa}_{t}$
from (2.26), which is also the first term on the right-hand side of (2.25). Thus, by comparing (2.25) with (2.28), we obtain
 $$\begin{eqnarray}\displaystyle {\it\chi}(t)=\frac{1}{6}G^{2}\frac{\text{d}}{\text{d}t}\langle r_{i}r_{i}\rangle _{r_{0}(t)=0}-2G^{2}{\it\kappa}. & & \displaystyle\end{eqnarray}$$
It now follows from substitution into (2.28) and using (2.24) that
 $$\begin{eqnarray}\displaystyle P(t)=\frac{1}{3}G^{2}\frac{\text{d}}{\text{d}t}\langle Y_{i}^{m}Y_{i}^{m}\rangle -2G^{2}{\it\kappa}. & & \displaystyle\end{eqnarray}$$
Thus, we have exact results for the scalar production and dissipation in terms of the rate of change of the one- and two-molecule backward dispersion. In the current work, we first characterize the statistics of single molecules and pairs of molecules, comparing with Saffman’s theoretical results wherever applicable. For molecular pairs, we are naturally more interested in backward statistics. Comparisons with Eulerian results are made primarily for
 $Sc\sim O(1)$
because this is the range where the detailed time history in the Eulerian frame is most readily available.
3 Numerical approach and database
We have performed simulations of stationary isotropic turbulence over a range of Reynolds numbers. The Eulerian velocity and scalar fields are computed using a pseudo-spectral approach in space and a second-order Runge–Kutta integration in time. Stationarity in the velocity field is achieved by maintaining (Donzis & Yeung Reference Donzis and Yeung2010) the energy spectrum in the lowest few wavenumber shells at values suggested by long-time averages derived from previous simulations which used stochastic forcing (Eswaran & Pope Reference Eswaran and Pope1988). For scalar fields the fluctuations are initially absent but subsequently generated by a uniform mean gradient. Although the forcing scheme employed tends to minimize temporal oscillations of the kinetic energy and dissipation rate, statistics in specific directions can still vary significantly at a given time instant. In order to minimize limitations in statistical sampling, for each value of
 $Sc$
we simulate and subsequently average over results for three scalars with
 $\boldsymbol{{\rm\nabla}}{\it\Phi}$
in different coordinate directions.
Molecules are tracked by integrating (1.1) using an extension of a parallelized particle-tracking algorithm used recently for fluid particles (Buaria et al.
Reference Buaria, Sawford and Yeung2015). To advance from time
 $t_{n}$
to
 $t_{n+1}=t_{n}+{\rm\Delta}t$
we calculate the predictor step estimate of the new position
 $\boldsymbol{x}^{m}(t_{n+1})$
by the formula
 $$\begin{eqnarray}\displaystyle \boldsymbol{x}^{m,\ast }=\boldsymbol{x}^{m}(t_{n})+{\rm\Delta}t\boldsymbol{u}(\boldsymbol{x}^{m}(t_{n}),t_{n})+\sqrt{2{\it\kappa}{\rm\Delta}t}\boldsymbol{Z}, & & \displaystyle\end{eqnarray}$$
where
 $\boldsymbol{Z}$
is a standardized Gaussian random variable in 3D, and the Wiener process increment is implemented as
 $\text{d}\boldsymbol{W}=\sqrt{{\rm\Delta}t}~\boldsymbol{Z}$
. The end result, after the corrector step, is
 $$\begin{eqnarray}\displaystyle \boldsymbol{x}^{m}(t_{n+1})=\boldsymbol{x}^{m}(t_{n})+{\textstyle \frac{1}{2}}{\rm\Delta}t[\boldsymbol{u}(\boldsymbol{x}^{m}(t_{n}),t_{n})+\boldsymbol{u}(\boldsymbol{x}^{m,\ast },t_{n+1})]+\sqrt{2{\it\kappa}{\rm\Delta}t}\boldsymbol{Z}. & & \displaystyle\end{eqnarray}$$
The fluid velocities at the two molecular positions shown in (3.2) are calculated by cubic-spline interpolation (Yeung & Pope Reference Yeung and Pope1988). This scheme is strong order
 $1/2$
and weak order 1 (Kloeden & Platen Reference Kloeden and Platen1992). However, in contrast to Eulerian simulations, no special numerical constraints arise for the time step or grid spacing at either very low or very high Schmidt number (Donzis et al.
Reference Donzis, Sreenivasan and Yeung2010; Yeung & Sreenivasan Reference Yeung and Sreenivasan2014), although it is obviously important to have a substantial number of molecules for statistical sampling. This approach is similar to the thermal marker technique of Papavassiliou & Hanratty (Reference Papavassiliou and Hanratty1995).
To obtain both forward and backward displacement statistics, we use our recently developed postprocessing approach (Buaria et al.
Reference Buaria, Sawford and Yeung2015). While single-molecule statistics are relatively simple to obtain, two-molecule statistics require a careful approach in forming pairs of desired initial separation from the entire population. For a given trajectory extending from
 $t=0$
to
 $t=T$
, the initial separation for forward pairs is simply
 $r_{0}=|\boldsymbol{r}(t=0)|$
, whereas for backward pairs the initial separation is defined as
 $r_{0}=|\boldsymbol{r}(t^{\prime }=0)|$
, where
 $t^{\prime }=T-t$
is the backward time. Thus, forward and backward statistics are compared using the properties of
 $\boldsymbol{r}(t)$
and
 $\boldsymbol{r}(t^{\prime })$
. However, since the turbulence is stationary, the statistics evaluated at any time
 $t^{\prime }$
are equivalent to those evaluated at time
 $-t$
. Henceforth, for convenience, we will use
 $t$
to represent both forward and backward times, unless specified otherwise. Since pairs are formed from a population of many millions, samples of
 $r_{0}$
vary continuously over a wide range and are (see § 5) sorted into bins of finite width. This method allows us to compute the backward statistics without the need to store numerous time-resolved snapshots of the velocity field, which would be extremely memory-intensive, especially as the Reynolds number increases. Since final-time positions are not prescribed, we have no samples of initially coincident molecular pairs in the backward frame, and pairs of small
 $r_{0}$
are correspondingly fewer in number. However, in most cases adequate sampling is achieved for pairs of initial separation down to as small as
 ${\it\eta}/4$
, which, as seen later in § 6, is generally sufficiently small as an approximation to
 $r_{0}=0$
. More details about the methodology can be found in Buaria et al. (Reference Buaria, Sawford and Yeung2015).
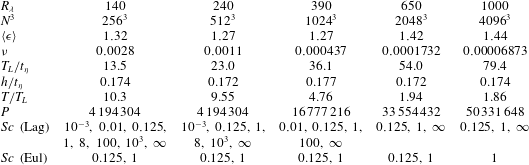
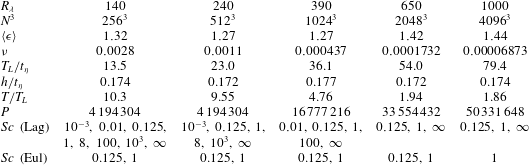
Table 1 gives a summary of the database used in the current work along with the main simulation parameters. In all cases the solution domain is of length
 $2{\rm\pi}$
on each side, and the grid spacing is approximately twice the Kolmogorov length scale
 ${\it\eta}$
. As mentioned earlier, the forcing scheme used (Donzis & Yeung Reference Donzis and Yeung2010) tends to limit the variations in kinetic energy and mean dissipation rate, and thus both
 ${\it\eta}$
and
 $t_{{\it\eta}}$
can be taken as constant throughout each simulation. Most of the simulation parameters are the same as reported in our recent work (Buaria et al.
Reference Buaria, Sawford and Yeung2015) focused on fluid particle pairs, except that the time span of both Eulerian and Lagrangian simulation at
 $R_{{\it\lambda}}=650$
and 1000 is limited by computational expense. In the smaller simulations we have tracked molecules at several values of the Schmidt number spanning many decades. For time-dependent Eulerian scalar fields we have limited ourselves to
 $Sc=0.125$
and 1 (and only the latter in the more expensive
 $4096^{3}$
simulation).
Parameters of the simulations performed: the Taylor-scale Reynolds number (
 $R_{{\it\lambda}}$
), the number of grid points (
 $N^{3}$
), the mean dissipation rate (
 $\langle {\it\epsilon}\rangle$
), the kinematic viscosity (
 ${\it\nu}$
), the ratio of the Lagrangian integral time scale (
 $T_{L}$
) to the Kolmogorov time scale (
 $t_{{\it\eta}}$
), the output time interval (
 $h$
) in Kolmogorov scales, the time span of the simulation (
 $T$
) in integral time scales, the number of molecules (
 $P$
) tracked for each value of the Schmidt number (
 $Sc$
) and the values of
 $Sc$
computed for each case in both the Lagrangian (Lag) and the Eulerian (Eul) part. The case
 $Sc=\infty$
corresponds to fluid particles.
4 Single-molecule statistics
Single-molecule statistics (where each molecule is an independent sample) provide a basic characterization of molecular trajectory properties and are also related to the production of scalar variance (§ 2.3). In this section we do not differentiate between forward and backward results, since in stationary turbulence these statistics are equivalent.
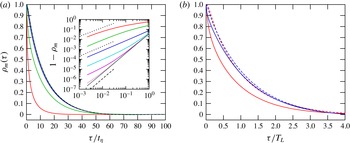
Substance autocorrelation: (a) as a function of the non-dimensional time lag (
 ${\it\tau}/t_{{\it\eta}}$
) for
 $R_{{\it\lambda}}=140$
and, from bottom to top, for
 $Sc=0.001$
(red),
 $0.01$
(green),
 $0.125$
(blue),
 $1$
(cyan), 8 (magenta), 100 (pink), 1000 (dark green) and
 $\infty$
(dashed black); data for
 $Sc=100$
and 1000 are almost indistinguishable from
 $Sc=\infty$
; the inset shows
 $1-{\it\rho}_{m}$
on log–log scales with
 $Sc$
increasing downwards, with dotted and dashed straight lines indicating slopes
 $1$
and
 $2$
respectively; (b) versus the time lag scaled by
 $T_{L}$
, for
 $Sc=0.01$
(solid) and
 $\infty$
(dashed), at
 $R_{{\it\lambda}}=140$
(red) (lower lines) and
 $390$
(blue) (upper lines).

As suggested in § 2.1, the first quantity to examine is the substance autocorrelation,
 ${\it\rho}_{m}({\it\tau})$
, which by stationarity is an even function of the time lag (
 ${\it\tau}$
). Figure 1 shows, as a function of time lag, (a)
 ${\it\rho}_{m}({\it\tau})$
for a range of
 $Sc$
at given
 $R_{{\it\lambda}}$
, and (b) data for a range of
 $R_{{\it\lambda}}$
at given
 $Sc$
. The case
 $Sc=\infty$
corresponds to fluid particles. In (a), with
 $R_{{\it\lambda}}$
held fixed at 140, as
 $Sc$
decreases, we observe that the autocorrelation drops off to zero faster with time. This faster decorrelation at decreasing
 $Sc$
is expected, because Brownian motion contributions to the displacements at successive time instants are independent and uncorrelated, and these contributions become stronger at higher molecular diffusivity. However, the departure from the fluid particle case is substantial only for
 $Sc\ll 1$
, showing that the effects of molecular diffusion are weak compared with turbulent transport unless
 $Sc$
is less than unity.
It is well understood that since the velocity of a fluid particle is differentiable in time, the fluid particle velocity autocorrelation
 ${\it\rho}_{L}({\it\tau})$
has a parabolic decay near
 ${\it\tau}=0$
, i.e.
 $$\begin{eqnarray}\displaystyle {\it\rho}_{L}({\it\tau})\approx 1-\frac{{\it\tau}^{2}}{{\it\lambda}_{t}^{2}}\quad \text{for}~|{\it\tau}|\rightarrow 0, & & \displaystyle\end{eqnarray}$$
where
 ${\it\lambda}_{t}$
is the Taylor time scale related to the acceleration variance
 ${\it\sigma}_{a}^{2}$
as
 $\sqrt{2}{\it\sigma}_{u}/{\it\sigma}_{a}$
. By expressing
 ${\it\sigma}_{a}$
in Kolmogorov variables and substituting this in (2.6) we obtain
 $$\begin{eqnarray}\displaystyle {\it\rho}_{m}({\it\tau})=1-\frac{\sqrt{15}}{R_{{\it\lambda}}}\frac{a_{0}^{2}}{2}\left(\frac{{\it\tau}}{t_{{\it\eta}}}\right)^{2}-\frac{\sqrt{15}}{3}\frac{1}{R_{{\it\lambda}}}\frac{1}{Sc}\frac{|{\it\tau}|}{t_{{\it\eta}}},\quad \text{for}~|{\it\tau}|/t_{{\it\eta}}\ll \min (1,Sc), & & \displaystyle\end{eqnarray}$$
where
 $a_{0}$
is the Kolmogorov-scaled acceleration variance (which is known to increase with Reynolds number as a result of intermittency (Yeung et al.
Reference Yeung, Pope, Lamorgese and Donzis2006)). The linear term in (4.2) will dominate if
 ${\it\tau}/t_{{\it\eta}}\ll a_{0}^{2}Sc$
, which is more easily satisfied at low
 $R_{{\it\lambda}}$
and low
 $Sc$
. To examine this behaviour, in the inset in figure 1(a) we show
 $1-{\it\rho}_{m}$
versus
 ${\it\tau}/t_{{\it\eta}}$
on log–log scales. The approach to linear behaviour at small time lags is very readily seen for
 $Sc<1$
. For
 $Sc>1$
there is a range of times
 $a_{0}^{-2}Sc^{-1}\ll t/t_{{\it\eta}}\ll 1$
over which the quadratic term in (4.2) dominates. Thus, for
 $Sc>1$
, we can observe that the curves nearly overlap (as the quadratic term is independent of
 $Sc$
) and display slope 2 at early time lags.
The effect of the Reynolds number on the Schmidt number dependence is seen in figure 1(b), which shows the substance autocorrelation for
 $Sc=0.01$
and the fluid particle velocity autocorrelation (i.e.
 $Sc=\infty$
). The difference between the two solid lines is substantial, showing that at fixed
 $Sc$
the decorrelation with increasing time lag occurs more slowly when the Reynolds number increases. However, it is also clear that at higher Reynolds number the difference between the solid and dashed blue (upper) lines is weak, which indicates that the sensitivity to
 $Sc$
is much diminished as the Reynolds number increases.
Lagrangian integral time scale for molecular trajectories.

The areas under the curves in figures 1(a) and 1(b) are (based on the normalization chosen) equal to the ratios
 $T_{m}/t_{{\it\eta}}$
and
 $T_{m}/T_{L}$
respectively. These ratios are themselves related through the factor
 $T_{L}/t_{{\it\eta}}$
, which increases with the Reynolds number. Table 2 shows the variation of
 $T_{m}/T_{L}$
with
 $Sc$
at
 $R_{{\it\lambda}}$
up to 390. (At
 $R_{{\it\lambda}}$
650 and 1000 the simulation time
 $T/T_{L}$
is too short to estimate
 $T_{m}/T_{L}$
reliably.) It can be seen that
 $T_{m}/T_{L}$
is relatively low for
 $Sc\ll 1$
and approaches unity as
 $Sc$
increases. In addition, as the Reynolds number increases,
 $T_{m}/T_{L}$
at a given
 $Sc$
becomes closer to unity. This is consistent with the fact that as the Reynolds number increases the influence of molecular diffusion also becomes very weak. However, for finite Reynolds number, the effects of molecular diffusion must be taken into account, especially if
 $Sc$
is low and
 $R_{{\it\lambda}}$
is modest.
(a) Single-molecule Kolmogorov-scaled mean-square displacement at
 $R_{{\it\lambda}}=140$
, for
 $Sc=0.001$
(red),
 $0.01$
(green),
 $0.125$
(blue),
 $1$
(cyan),
 $8$
(magenta),
 $100$
(orange) and
 $1000$
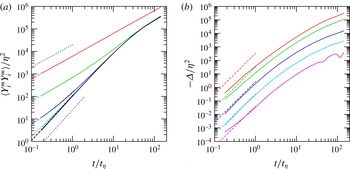
(black), increasing from top to bottom (the last three cases being virtually indistinguishable). The dashed colour lines are the corresponding small-time results given by (2.7). The dotted black lines are for slopes 1 and 2. (b) The negative of the interaction term given by (2.4), scaled by Kolmogorov variables, for
 $R_{{\it\lambda}}=140$
and
 $Sc=0.001$
, 0.01, 0.125, 1 and 8 (same colours as in (a)), increasing from top to bottom. The dashed colour lines represent Saffman’s small-time results given by (2.8).

Figure 2 shows (a) the mean-square displacement and (b) the magnitude of the interaction term (defined in (2.4)), both normalized by Kolmogorov variables. As a result of molecular diffusion, the behaviour of the mean-square displacement at small times, as given by (2.7), is very different depending on the Schmidt number. For sufficiently small times
 $t/t_{{\it\eta}}\ll Sc^{-1}R_{{\it\lambda}}^{-1}$
the linear diffusion term dominates, as is readily seen for
 $Sc<1$
in figure 2(a), where
 $Sc$
is varied over a wide range at fixed
 $R_{{\it\lambda}}$
. For large
 $Sc$
and/or large
 $R_{{\it\lambda}}$
this linear growth is restricted to very small times and there is a range of times
 $Sc^{-1}R_{{\it\lambda}}^{-1}\ll t/t_{{\it\eta}}\ll 1$
over which the quadratic ballistic term dominates. This is readily seen in the collapse of curves for
 $Sc>1$
onto the fluid particle result for
 $Sc=\infty$
. At large times, all curves approach a diffusive regime where the growth of the mean-square displacement is linear, as given by (2.9). However, the curve for
 $Sc=0.001$
lies far above all the others, which is because in this case the diffusivity is so high that the second term in (2.9) dominates. By using
 ${\it\sigma}_{u}^{2}T_{m}={\it\kappa}_{t}$
as defined earlier, the mean-square displacement equals
 $6({\it\kappa}_{t}+{\it\kappa})t$
, such that the slope in the large-time limit is determined by the additive effect of the turbulent and molecular diffusivities. The Schmidt number dependence at other Reynolds numbers also follows similar trends, but at higher
 $R_{{\it\lambda}}$
generally a lower
 $Sc$
is needed for molecular diffusion to be dominant.
A more sensitive test of Schmidt number effects is to plot the interaction term given by (2.4), which explicitly quantifies the effects of molecular diffusion on turbulence. In figure 2(b) it can be seen that, although there is some numerical noise resulting from taking differences between small values which are very close to each other, the agreement with (2.9) is good for moderate and high
 $Sc$
. However, with decreasing
 $Sc$
the DNS data fall increasingly below the theory. This is because, as noted before, (2.8) holds only at times
 $t/t_{{\it\eta}}\ll Sc$
, which is not satisfied in the data range of figure 2(b).
Variation of the molecular integral time scale with respect to the Lagrangian time scale as a function of
 $Sc$
for
 $R_{{\it\lambda}}=140$
(circles, in red),
 $240$
(triangles, in green) and
 $390$
(squares, in blue). The open and closed symbols represent estimates based on the substance autocorrelation and the interaction term respectively. The dashed lines are at slope
 $-1$
.

On the other hand, at large times, the interaction term is given by (2.10), in which the relative magnitudes of the integral time scales
 $T_{m}$
and
 $T_{L}$
are important. In figure 3 we show data for
 $1-T_{m}/T_{L}$
versus
 $Sc$
, which provides a test for the functional form suggested in (2.13), with each dashed line corresponding to a different value of the parameter
 $a$
therein. At high
 $Sc$
, or at moderate
 $Sc$
at high
 $R_{{\it\lambda}}$
,
 $T_{m}$
becomes very close to
 $T_{L}$
and the quantity
 $1-T_{m}/T_{L}$
can become unreliable, or even spuriously negative, especially if
 $T_{m}$
or
 $T_{L}$
is affected by limitations such as the length of the simulation. As a result, some data points corresponding to cases listed in table 2 are not shown in this figure which is drawn on logarithmic scales. Nevertheless, good agreement with the
 $Sc^{-1}$
dependence of Saffman’s theoretical result is observed over a range of moderate Schmidt numbers, but with the parameter
 $a$
dependent on the Reynolds number. At very low
 $Sc$
, the discrepancy between theory and DNS is substantial, which is not surprising since physically both
 $T_{m}$
and
 $T_{L}$
must be non-negative with
 $T_{m}\leqslant T_{L}$
, so
 $1-T_{m}/T_{L}\leqslant 1$
.
5 Statistics of molecule pairs
In this section we present results for the forward and backward dispersion of molecular pairs. Since the turbulence is isotropic, the dependence on the initial separation vector is through its magnitude (
 $r_{0}$
) only. The statistics of molecule pairs are extracted using the same approach as our recent work on fluid particle pairs (Buaria et al.
Reference Buaria, Sawford and Yeung2015), where samples of a continuous variation of
 $r_{0}$
are sorted into finite bins of logarithmic spacing. To enhance the sampling without sacrificing resolution in
 $r_{0}$
, we choose overlapping bins within a factor of four, defined as
 $2^{i-3}\leqslant r_{0}/{\it\eta}\leqslant 2^{i-1}$
for
 $i=0,1,2,3,\ldots$
onwards. To identify a bin, we use
 $\tilde{r}_{0}/{\it\eta}$
, which is the geometric mean between its lower and upper bounds, normalized by the Kolmogorov scale, i.e.
 $\tilde{r}_{0}/{\it\eta}=2^{i-2}$
for
 $i=0,1,2,3,\ldots$
onwards. Consequently, all of the pair statistics reported here are averages over the sample of initial separations in each bin, and so are reported as functions of
 $\tilde{r}_{0}$
rather than the random variable
 $r_{0}$
. Earlier studies focused on fluid particles (Sawford et al.
Reference Sawford, Yeung and Borgas2005; Berg et al.
Reference Berg, Luthi, Mann and Ott2006) have shown that backward dispersion is similar to forward dispersion at both very short and very long times but stronger at intermediate times. More recently, it has been recognized that (Jucha et al.
Reference Jucha, Xu, Pumir and Bodenschatz2014; Buaria et al.
Reference Buaria, Sawford and Yeung2015) the forward and backward dispersion do differ at early but finite times, at a rate that grows as
 $t^{3}$
, which could be overlooked if only the leading
 $t^{2}$
terms in the Taylor-series expansions for both forward and backward mean-square relative displacement were retained.
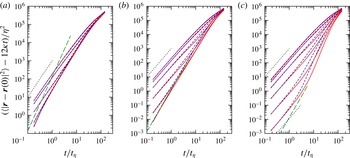
Compensated mean-square relative displacement of molecule pairs as a function of forward time (solid lines, in red) and backward time (dashed lines, in blue), scaled by Kolmogorov variables, at
 $R_{{\it\lambda}}=140$
for
 $Sc=0.01$
(a),
 $1$
(b) and
 $100$
(c). The green dashed lines represent the Saffman
 $t^{3}$
small-time limit. The value of
 $\tilde{r}_{0}/{\it\eta}$
(1/4, 1, 4, 16, 64) increases from bottom to top. (In (a) the lines for
 $\tilde{r}_{0}/{\it\eta}=1/4$
and
 $1$
are virtually indistinguishable, whereas in (b) the
 $\tilde{r}_{0}/{\it\eta}=1/4$
data coincide with the long-dashed line in green at small times.) The black dotted lines indicate a slope of
 $2$
.

An important question in this section is how molecular diffusion affects the behaviour of the mean-square relative displacement,
 $\langle |\boldsymbol{r}(t)-\boldsymbol{r}(0)|^{2}\rangle$
. In view of the structure of (2.17)–(2.18), it is convenient to separate out the linear diffusive term, which could become large at low
 $Sc$
and obscure other effects of interest. Accordingly, in figure 4 we show the evolution of the mean-square relative displacement compensated for the direct effect of molecular diffusion, i.e.
 $(\langle |\boldsymbol{r}(t)-\boldsymbol{r}(0)|^{2}\rangle -12{\it\kappa}t)/{\it\eta}^{2}$
, at three different Schmidt numbers with fixed
 $R_{{\it\lambda}}=140$
. On the scales of this figure, forward and backward dispersion generally agree closely at both small and large times. At large times (
 $t\gg T_{m}$
), the curves for all values of
 $\tilde{r}_{0}$
are also seen to converge towards a linear diffusive limit, as given by (2.19). However, at very low
 $Sc$
(0.01 or lower), where molecular diffusion is dominant, the differences between forward and backward dispersion are small even at intermediate times. This is consistent with the results of Sawford et al. (Reference Sawford, Yeung and Borgas2005), who showed that forward and backward dispersion would be equivalent if the velocity field were Gaussian. As
 $Sc$
decreases, Brownian motion contributions (which are Gaussian) are more prominent. Approach to the large-time diffusive limit also occurs earlier for such small
 $Sc$
since the ratio
 $T_{m}/T_{L}$
(and hence
 $T_{m}/t_{{\it\eta}}$
) decreases with decreasing
 $Sc$
.
The nature of the behaviour at early times in figure 4 is sensitive to both the initial separation and the Schmidt number. If
 $\tilde{r}_{0}$
is large, then unless
 $Sc$
is extremely small, the early-time growth is quadratic, as explained by (2.18). The lines for large
 $\tilde{r}_{0}$
are also closer to each other since the Eulerian structure functions increase monotonically with
 $\tilde{r}_{0}$
until they become constant at large
 $\tilde{r}_{0}$
. However, as discussed in relation to (2.17), if
 $\tilde{r}_{0}$
is small, the early-time behaviour depends strongly on
 $Sc$
, being cubic for
 ${\tilde{r}_{0}}^{2}/{\it\eta}^{2}\ll Sc^{-1}t/t_{{\it\eta}}$
with
 $t/t_{{\it\eta}}\ll \min (1,Sc)$
and quadratic for
 $t/t_{{\it\eta}}\ll Sc(\tilde{r}_{0}/{\it\eta})^{2}$
. Thus, in the data at
 $Sc=0.01$
, for
 $\tilde{r}_{0}/{\it\eta}\rightarrow 0$
we see a convergence to a stronger than quadratic dependence on time, but the times shown are too large for the Saffman
 $t^{3}$
behaviour to be observed. For
 $Sc=1$
, the data for
 $\tilde{r}_{0}/{\it\eta}=1/4$
converge to the Saffman result for both forward and backward dispersion. Finally, for
 $Sc=100$
, much smaller values of
 $\tilde{r}_{0}/{\it\eta}$
are needed to observe the Saffman result; instead, the ballistic
 $t^{2}$
behaviour is observed.
Forward (a,c) and backward (b,d) CLS of mean-square separation, defined by (5.1), at
 $R_{{\it\lambda}}=390$
(dotted),
 $650$
(dashed) and
 $1000$
(solid) for
 $Sc=0.125$
(a,b) and
 $1$
(c,d). The initial separations are
 $\tilde{r}_{0}/{\it\eta}=2$
(red),
 $4$
(green),
 $8$
(blue) and
 $16$
(black) (right to left at large times). The horizontal dotted lines are drawn for reference at the heights
 $0.56$
(forward) and 1.57 (backward) for
 $Sc=0.125$
,
 $0.55$
(forward) and 1.53 (backward) for
 $Sc=1$
.

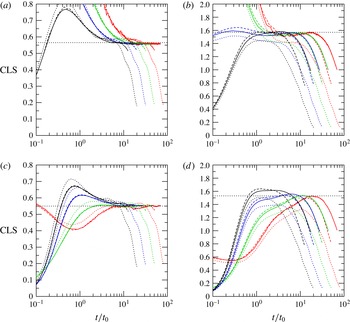
The most important dynamical issue at high Reynolds number is, of course, the possibility of Richardson scaling at intermediate times, as defined by (2.20). An effective way to characterize the scaling behaviour is to calculate the so-called cubed-local slope (CLS) (Sawford et al. Reference Sawford, Yeung and Hackl2008),
 $$\begin{eqnarray}\displaystyle \frac{1}{\langle {\it\epsilon}\rangle }\left(\frac{\text{d}}{\,\text{d}t}\langle r^{2}\rangle ^{1/3}\right)^{3}. & & \displaystyle\end{eqnarray}$$
If a well-defined Richardson scaling range is present, then the plot of the CLS versus
 $t/t_{0}$
will show a plateau at height equal to Richardson’s constant, over a range of
 $\tilde{r}_{0}$
and in the range
 $(t_{{\it\eta}},t_{0},t_{{\it\kappa}})\ll t\ll T_{m}$
. In figure 5 we show data at the three highest Reynolds numbers for
 $Sc=0.125$
and
 $1$
, for four values of
 $\tilde{r}_{0}/{\it\eta}$
. In general, there is clear evidence for Richardson scaling, at slightly different plateau heights, for all cases shown, while (as for fluid particles) the Richardson constant for backward dispersion is higher. For the forward case of
 $Sc=0.125$
, as
 $R_{{\it\lambda}}$
increases, the plateau indicating Richardson scaling shifts down from 0.59 at
 $R_{{\it\lambda}}=390$
to 0.56 at
 $R_{{\it\lambda}}=650$
and
 $R_{{\it\lambda}}=1000$
. For
 $Sc=1$
, the data for
 $R_{{\it\lambda}}=650$
and
 $1000$
overlap almost perfectly with each other, indicating a very robust scaling, with the Richardson constant being
 $0.55$
, a little lower than the value of 0.56 for
 $Sc=0.125$
.
Forward (a) and backward (b) CLS at
 $R_{{\it\lambda}}=1000$
for
 $Sc=0.125$
(solid),
 $1$
(dashed) and
 $\infty$
(dotted) for the same initial separations as figure 5. The horizontal dotted lines are drawn for reference at the heights 0.55 and 0.56 for forward, 1.53 and 1.57 for backward.

Forward and backward Richardson constants as estimated from the CLS plots for various
 $R_{{\it\lambda}}$
and
 $Sc$
. The data for
 $Sc=\infty$
are the same as those reported in Buaria et al. (Reference Buaria, Sawford and Yeung2015).

For backward dispersion, the convergence towards Richardson scaling is not as strong as for forward dispersion, especially at
 $Sc=1$
, but is still clearly evident. For
 $Sc=0.125$
, as
 $R_{{\it\lambda}}$
increases from 390 to 1000, there is a clear trend, with plateaus at
 $1.41$
,
 $1.55$
and
 $1.57$
. For
 $Sc=1$
, the plateaus tend to be defined by the decreasing trends in the peak values with decreasing
 $\tilde{r}_{0}$
, towards coincident values for
 $\tilde{r}_{0}/{\it\eta}=2$
and 4, rather than as an extended plateau for any one value of
 $\tilde{r}_{0}$
. These coincident values are
 $1.32$
,
 $1.50$
and
 $1.53$
for
 $R_{{\it\lambda}}=390$
, 650 and 1000 respectively.
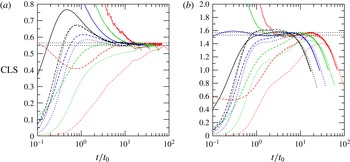
While figure 5 shows the Reynolds-number dependence at fixed Schmidt numbers, it is also useful to examine the Schmidt-number dependence of the CLS at the highest available
 $R_{{\it\lambda}}$
, including the case of
 $Sc=\infty$
(where we used fluid particle results given in Buaria et al. (Reference Buaria, Sawford and Yeung2015)). Figure 6 shows such data at
 $R_{{\it\lambda}}=1000$
for
 $Sc=0.125$
, 1 and
 $\infty$
. For forward dispersion (a), the curves for
 $Sc=1$
and
 $\infty$
essentially coincide at a plateau at height 0.55, a little lower than the plateau at 0.56 for
 $Sc=0.125$
. This suggests that the Richardson constant inferred here is well converged with respect to
 $Sc$
even if a weak decrease with
 $Sc$
may still persist. For the backward case (b), the dependence on
 $Sc$
is more visible, with the curves for
 $Sc=0.125$
plateauing at 1.57, which is slightly above the value of 1.53 for
 $Sc=1$
. For
 $Sc=\infty$
, the trends with both
 $\tilde{r}_{0}/{\it\eta}$
and
 $R_{{\it\lambda}}$
suggest a best estimate of
 $1.5$
for the backward Richardson constant (Buaria et al.
Reference Buaria, Sawford and Yeung2015). This value corresponds to the short plateau for
 $\tilde{r}_{0}/{\it\eta}=8$
in figure 6. This again suggests that an even higher
 $R_{{\it\lambda}}$
is required to reach the asymptotic state for backward dispersion, at which the backward Richardson constant would also become independent of
 $Sc$
.
A summary of our estimates for both forward and backward Richardson constants is given in table 3. There are systematic trends with respect to both the Schmidt number and the Reynolds number, and clear convergence with both increasing
 $Sc$
at fixed
 $R_{{\it\lambda}}$
and vice versa. The trends are also consistent with the work of Eyink (Reference Eyink2011), who estimated the forward and backward constants to be 0.64 and 1.35 respectively using DNS results on stochastic tracers with zero initial separation for
 $Sc=1$
at
 $R_{{\it\lambda}}=433$
, and that of Benveniste & Drivas (Reference Benveniste and Drivas2014), who reported the backward constant to be 1.33 using the same database as Eyink (Reference Eyink2011). Thus, the overall conclusion is that both Schmidt-number and Reynolds-number effects on the value of Richardson’s constant (forward and backward) are weak, and that the values inferred here are consistent with those reported earlier for fluid particles (0.55 and 1.5 for forward and backward respectively, as shown in table 3 for
 $Sc=\infty$
).
The general appearance of figures 5 and 6 bears several similarities to our recent analysis of Richardson scaling for fluid particles (Buaria et al.
Reference Buaria, Sawford and Yeung2015). However, the scaling for molecules appears to be more robust. One possible explanation is that as a pair of molecules moves under the combined effects of turbulence and molecular diffusion, its memory of initial separation is lost faster than for fluid particles. If the Schmidt number is not too low, this effect may result in an early onset of a wider inertial range, with a wider plateau. While
 $Sc\sim O(1)$
produces a more robust Richardson scaling, for
 $Sc\ll 1$
molecular diffusion may be so strong that the nature of the dispersion becomes increasingly similar to pure Brownian motion, which deviates strongly from inertial range scaling. A complete absence of Richardson scaling is indeed found for our CLS data at
 $Sc=0.01$
and 0.001 (not shown), although at higher Reynolds numbers this behaviour would require increasingly lower Schmidt numbers.
Some authors (Eyink Reference Eyink2011; Benveniste & Drivas Reference Benveniste and Drivas2014) have argued that Richardson scaling is also supported by a collapse of results for the separation PDF onto the Richardson similarity form (Richardson Reference Richardson1926; Sawford et al.
Reference Sawford, Yeung and Borgas2005). In fact, this collapse occurs over only a limited range of scales (
 $r/\langle r^{2}\rangle ^{1/2}\leqslant 2$
), and on larger scales there is no collapse (Buaria et al.
Reference Buaria, Sawford and Yeung2015). Our results for molecular trajectories, not shown here, are consistent with those of Buaria et al. (Reference Buaria, Sawford and Yeung2015). This is not necessarily evidence for a failure of Richardson scaling, but rather shows that the assumption underlying the particular similarity form proposed by Richardson, namely that relative dispersion is described by a diffusion equation, is not satisfied.
The results of §§ 4 and 5 have provided reliable information on one- and two-molecule statistics over a Reynolds- and Schmidt-number range considerably wider than previously reported in the literature. In the next section we use these results to address turbulent mixing in a Lagrangian frame.
6 Lagrangian description of scalar mixing
In this section we use the results for displacement statistics given in earlier sections to derive scalar field statistics from a Lagrangian perspective. Comparisons with Eulerian results are made only for
 $Sc=0.125$
and
 $1$
, since higher or lower
 $Sc$
require more computational resources. As derived earlier in § 2.2, the scalar production and dissipation can be written in terms of displacement statistics for single molecules and pairs of molecules, as given by (2.30) and (2.29) respectively. However, both of these expressions involve numerical differentiation and subtraction between terms that may be very close to each other, especially for moderate and low
 $Sc$
. To avoid numerical inaccuracies caused by these issues we derive alternative formulae in appendix B. We compute the scalar production and dissipation terms using the expressions
 $$\begin{eqnarray}\displaystyle & \displaystyle P(t)={\textstyle \frac{2}{3}}G^{2}\langle Y_{i}^{m}(t)u_{i}\rangle , & \displaystyle\end{eqnarray}$$
 $$\begin{eqnarray}\displaystyle & \displaystyle {\it\chi}(t)={\textstyle \frac{1}{3}}G^{2}\langle r_{i}(0)u_{i}^{(r)}(0)\mid \tilde{r}_{0}(t)\rightarrow 0\rangle , & \displaystyle\end{eqnarray}$$
where
 $u_{i}$
is the fluid velocity at the molecular position and
 $u_{i}^{(r)}$
is the relative fluid velocity between two molecules. In addition, stationarity allows us to replace (6.2) by
 $$\begin{eqnarray}\displaystyle {\it\chi}(t)={\textstyle \frac{1}{3}}G^{2}\langle r_{i}(t^{\prime })u_{i}^{(r)}(t^{\prime })\mid \tilde{r}_{0}(T)\rightarrow 0\rangle , & & \displaystyle\end{eqnarray}$$
where
 $t^{\prime }=T-t$
, and conditioning on properties at the fixed final time (
 $T$
) of the simulations is more readily implemented. However, as seen later, (2.30) and (2.29) are still useful from a theoretical perspective.
Non-dimensional scalar production as obtained from Lagrangian (solid lines) and Eulerian (dotted black lines) approaches, at
 $R_{{\it\lambda}}=140$
(red),
 $240$
(green),
 $390$
(blue),
 $650$
(cyan) and
 $1000$
(magenta), increasing from bottom to top. Panels (a) and (b) show data for
 $Sc=1/8$
and
 $1$
respectively. The Eulerian result at
 $R_{{\it\lambda}}=1000$
is given only for
 $Sc=1$
.

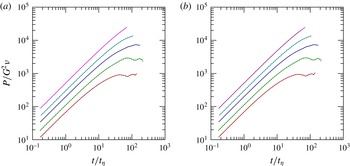
Figure 7 shows results for the scalar production normalized in the form
 $P/G^{2}{\it\nu}$
, for
 $Sc=1/8$
and 1, as the Reynolds number is varied from 140 to 1000. Excellent agreement is observed between the Lagrangian results (calculated from (2.30) and (6.1)) and the Eulerian result (dotted black lines)
 $P=-2\langle \boldsymbol{u}{\it\phi}\rangle \boldsymbol{\cdot }\boldsymbol{{\rm\nabla}}{\it\Phi}$
(§ 2.3), which is ensemble averaged over mean gradients aligned with each of the three coordinate axes. The normalization chosen allows the small-time results to be written wholly in terms of
 $t/t_{{\it\eta}}$
,
 $R_{{\it\lambda}}$
and
 $Sc$
. In particular, for small times, substitution of (2.7) in (2.30) gives the Lagrangian result as
 $$\begin{eqnarray}\displaystyle \frac{P}{G^{2}{\it\nu}}=\frac{2R_{{\it\lambda}}}{\sqrt{15}}\frac{t}{t_{{\it\eta}}}-\frac{1}{3Sc}\left(\frac{t}{t_{{\it\eta}}}\right)^{2}, & & \displaystyle\end{eqnarray}$$
which clearly supports a leading slope 1 behaviour for
 $Sc=1/8$
and 1 in the figure, with a direct dependence on
 $R_{{\it\lambda}}$
which is also clearly seen. In the Eulerian frame, with
 ${\it\phi}=0$
everywhere as initial condition, at small times
 $\partial {\it\phi}/\partial t=-\boldsymbol{u}\boldsymbol{\cdot }\boldsymbol{{\rm\nabla}}{\it\Phi}$
from (2.27), which implies that the scalar fluctuations and hence the production term grow linearly with time, at a rate consistent with (6.4).
At large times, a stationary state is expected as the production and dissipation become balanced by each other (Overholt & Pope Reference Overholt and Pope1996). Substitution of (2.9) in (2.30) gives the Lagrangian result as
 $$\begin{eqnarray}\displaystyle \frac{P}{G^{2}{\it\nu}}=2{\it\sigma}_{u}^{2}T_{m}/{\it\nu},\quad \text{for}~t\gg T_{m}, & & \displaystyle\end{eqnarray}$$
which becomes a constant, consistent with stationarity. Agreement between the Lagrangian and Eulerian results is also verified by using (2.26) with
 ${\it\sigma}_{u}^{2}T_{m}$
approaching
 ${\it\kappa}_{t}$
. The time taken to reach a stationary state, if measured in
 $t_{{\it\eta}}$
, is seen to be longer as the Reynolds number increases. This is expected, since the approach to a stationary state is determined by the large-scale motions, whose time scale increases with respect to
 $t_{{\it\eta}}$
as the Reynolds number increases.
Lagrangian estimates of
 $\tilde{{\it\chi}}(\tilde{r}_{0})$
at
 $Sc=1$
and
 $R_{{\it\lambda}}=140$
,
 $390$
and
 $1000$
(a–c), for
 $\tilde{r}_{0}/{\it\eta}=1/4$
(red),
 $1/2$
(green),
 $1$
(blue),
 $2$
(cyan) and
 $4$
(magenta) (increasing from bottom to top at small times). The scalar dissipation is given by
 $\tilde{{\it\chi}}(\tilde{r}_{0}=0)$
. The dashed black line is the corresponding Eulerian result for the scalar dissipation (which is virtually coincident with the Lagrangian data for
 $\tilde{{\it\chi}}$
at
 $\tilde{r}_{0}/{\it\eta}=1/4$
). The short dotted black line restricted to small times represents (6.8) with
 $\tilde{r}_{0}/{\it\eta}=1/4$
.

As noted earlier (§§ 2.3 and 5), statistics for pairs with zero backward initial separation are not available, i.e. the limiting condition
 $\tilde{r}_{0}(T)\rightarrow 0$
written above cannot be exactly attained. Thus, we are interested in the quantity
 $$\begin{eqnarray}\displaystyle \tilde{{\it\chi}}(\tilde{r}_{0})=\frac{1}{6}G^{2}\frac{\text{d}}{\text{d}t}\langle r_{i}(t)r_{i}(t)\mid \tilde{r}_{0}(T)\rangle -2G^{2}{\it\kappa}, & & \displaystyle\end{eqnarray}$$
which effectively provides a Lagrangian estimate of
 ${\it\chi}$
based on results at a finite non-zero
 $\tilde{r}_{0}(T)$
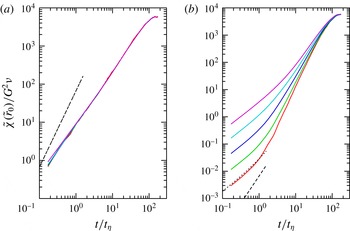
approaching zero, but not exactly equal to zero. Figure 8 shows non-dimensionalized
 $\tilde{{\it\chi}}(\tilde{r}_{0})$
for
 $\tilde{r}_{0}/{\it\eta}=1/4$
to 4 at
 $Sc=1$
, along with the corresponding Eulerian result, for
 $R_{{\it\lambda}}$
ranging from
 $140$
to
 $1000$
. It can be seen that as
 $\tilde{r}_{0}$
becomes smaller,
 $\tilde{{\it\chi}}(\tilde{r}_{0})$
approaches the Eulerian result
 ${\it\chi}$
, with the lines in red virtually coinciding with the black dashed lines. At large times, all lines shown converge towards
 $$\begin{eqnarray}\displaystyle \frac{\tilde{{\it\chi}}}{G^{2}{\it\nu}}=2{\it\sigma}_{u}^{2}T_{m}/{\it\nu},\quad \text{for}~t\gg T_{m}, & & \displaystyle\end{eqnarray}$$
which can be obtained by noting that the mean-squared relative displacement in (2.29) becomes twice the one-molecule mean-squared displacement used to obtain the scalar production term. To understand the convergence of results in the limit of
 $\tilde{r}_{0}\rightarrow 0$
we can consider theoretical results on
 $\tilde{{\it\chi}}(\tilde{r}_{0})$
at small times, If we consider pairs of very small separation only, i.e.
 $\tilde{r}_{0}\ll {\it\eta}$
, we can obtain the time derivative in (6.6) by differentiating (the backward version of, with a change in sign in the ballistic
 $t^{3}$
term) (2.17). The result, non-dimensionalized in the same manner as the production term, is
 $$\begin{eqnarray}\displaystyle \frac{\tilde{{\it\chi}}(\tilde{r}_{0})}{G^{2}{\it\nu}}=\frac{\langle r_{0}^{2}\rangle }{{\it\eta}^{2}}\left[\frac{1}{9}\left(\frac{t}{t_{{\it\eta}}}\right)+\frac{7}{36}\frac{S_{{\it\epsilon}}}{\sqrt{15}}\left(\frac{t}{t_{{\it\eta}}}\right)^{2}\right]+\frac{2}{3Sc}\left(\frac{t}{t_{{\it\eta}}}\right)^{2}, & & \displaystyle\end{eqnarray}$$
where
 $\langle r_{0}^{2}\rangle$
is the average over all initial separations in the bin centred on
 $\tilde{r}_{0}$
. This expression has a strong dependence on
 $\tilde{r}_{0}$
which is (to leading order) linear in time, while the last term, scaling as
 $t^{2}$
, is the true scalar dissipation in the limit of
 $\tilde{r}_{0}\rightarrow 0$
. The short dotted line of slope 2 drawn between
 $t/t_{{\it\eta}}=0.1$
and 1 confirms excellent agreement with the data at small times in figure 8. For a given
 $Sc$
and
 $R_{{\it\lambda}}$
, the relative magnitude of the first bracket can be controlled by choosing a sufficiently small
 $r_{0}$
. In figure 8 it can be seen that, at small times,
 $\tilde{r}_{0}/{\it\eta}=1/4$
is sufficiently small to obtain very close agreement with the Eulerian result (which becomes
 $(2/3Sc)(t/t_{{\it\eta}})^{2}$
).


As noted earlier, one advantage of the Lagrangian approach adopted here is that it is able to provide results on the statistics of the scalar field when
 $Sc$
is far from unity more easily than in the Eulerian frame. In figure 9 we show results for
 $\tilde{{\it\chi}}(\tilde{r}_{0})$
for various
 $\tilde{r}_{0}$
at one very low value (0.01) and one very high value (100) of
 $Sc$
, at the highest
 $R_{{\it\lambda}}$
(390) for which we have such data available. Both are clearly quite distinct from the case of
 $Sc=1$
at the same
 $R_{{\it\lambda}}$
, which is already shown in figure 8(b).
For
 $Sc=0.01$
, we can see that the curves for all
 $\tilde{r}_{0}/{\it\eta}$
almost completely overlap, since molecular diffusion effects are so strong that the effect of
 $\tilde{r}_{0}$
is almost negligible. The discrepancy between the DNS data lines and the Saffman limit (which has slope
 $2$
in this figure) is because the observation times
 $t$
do not satisfy the condition
 $t/t_{{\it\eta}}\ll Sc=0.01$
. We see though that the results are trending towards the Saffman limit with decreasing time.
A substantial contrast for
 $Sc=100$
is evident in figure 9(b), where the
 $\tilde{r}_{0}$
dependence is very strong. While the data at small times agree very well with (6.8), in this case well-sampled results for
 $\tilde{r}_{0}$
substantially smaller than
 ${\it\eta}/4$
are necessary to approximate the limiting case
 $\tilde{r}_{0}\rightarrow 0$
well. This is a challenging requirement, since a substantial increase in the number of pairs of small separation can be achieved only by tracking a much larger population of molecules. The need for more samples will also grow with increasing Reynolds number, such that a satisfactory convergence to
 $\tilde{r}_{0}\rightarrow 0$
at high
 $Sc$
and high
 $R_{{\it\lambda}}$
would be almost impossible to achieve in practice. However,
 $\tilde{{\it\chi}}(\tilde{r}_{0}/{\it\eta}=1/4)$
provides a better estimate for the dissipation at larger times, and particularly for the stationary state, as the dependence on
 $\tilde{r}_{0}$
weakens and eventually vanishes.
In (6.5) and (6.7), it has already been noted that in the large-time limit, both the production and the dissipation approach
 $2{\it\sigma}_{u}^{2}T_{m}/{\it\nu}$
under the normalization used above. A semi-empirical estimate of this dimensionless quantity can be made by writing it in terms of the Reynolds number and several time scales in turbulence, as
 $$\begin{eqnarray}\displaystyle 2{\it\sigma}_{u}^{2}T_{m}/{\it\nu}=2\frac{{R_{{\it\lambda}}}^{2}}{15}\frac{T_{L}}{T_{E}}\frac{T_{m}}{T_{L}}, & & \displaystyle\end{eqnarray}$$
where the Eulerian large-eddy time scale
 $T_{E}={\it\sigma}_{u}^{2}/\langle {\it\epsilon}\rangle$
, and for
 $R_{{\it\lambda}}\geqslant 140$
the ratio of the Lagrangian to Eulerian time scales is
 $T_{L}/T_{E}=2/\tilde{C}_{0}$
, with
 $\tilde{C}_{0}\approx 6.5$
(Sawford et al.
Reference Sawford, Yeung and Hackl2008). Thus, we have the result
 $$\begin{eqnarray}\displaystyle \frac{P}{G^{2}{\it\nu}}=\frac{{\it\chi}}{G^{2}{\it\nu}}\approx 0.041{R_{{\it\lambda}}}^{2}\frac{T_{m}}{T_{L}}, & & \displaystyle\end{eqnarray}$$
where the ratio
 $T_{m}/T_{L}$
has (as in table 2) a very weak dependence on
 $Sc$
at large
 $R_{{\it\lambda}}$
.
Evolution of normalized rates of production (a) and the quantity
 $\tilde{{\it\chi}}(\tilde{r}_{0}/{\it\eta}=1/4)$
(b) computed from molecular statistics for
 $R_{{\it\lambda}}=140$
(solid lines) and 390 (dashed lines), at
 $Sc=0.01$
(red), 1 (green) and 100 (blue). The Schmidt number increases from bottom to top in (a) but top to bottom in (b). For production, the lines for
 $Sc=1$
and
 $100$
are virtually indistinguishable. The horizontal black dotted lines drawn for comparison are at heights
 $0.041{R_{{\it\lambda}}}^{2}$
.

It is worth recapitulating that, to leading order and in the limit of vanishing backward initial separation, the rate of production of scalar fluctuations is initially independent of
 $Sc$
according to (6.4), whereas the rate of dissipation is initially independent of Reynolds number according to (6.8). Figure 10 shows the evolution of both production and
 $\tilde{{\it\chi}}(\tilde{r}_{0}/{\it\eta}=1/4)$
, our Lagrangian approximation to the scalar dissipation, as they eventually approach the same large-time limit represented by (6.10). The behaviour at small times is exactly as expected from (6.4) and (6.8). At large times, for
 $R_{{\it\lambda}}=140$
, both scalar production and dissipation approach the same stationary state, although the curves for
 $Sc=0.01$
are distinctively lower than that of
 $Sc\gtrsim 1$
. However, at
 $R_{{\it\lambda}}=390$
, we observe that all
 $Sc$
cases nearly overlap at large times, since for the same
 $Sc$
,
 $T_{m}/T_{L}$
is closer to unity for
 $R_{{\it\lambda}}=390$
compared with
 $R_{{\it\lambda}}=140$
. This observation that in the stationary state the scalar dissipation becomes independent of
 $Sc$
with increasing
 $R_{{\it\lambda}}$
, which in this case is derived from Lagrangian displacement statistics of molecules, is consistent with the corresponding Eulerian view of the scalar dissipation anomaly (Donzis, Sreenivasan & Yeung Reference Donzis, Sreenivasan and Yeung2005), and is evidence for so-called ‘spontaneous stochasticity’ (Bernard, Gawedzki & Kupiainen Reference Bernard, Gawedzki and Kupiainen1998; Eyink Reference Eyink2011). As a consequence, in the large-Reynolds-number limit fluid particles can be used in place of molecules to calculate scalar statistics on scales outside the dissipation subrange.
Finally, we examine the evolution of the non-dimensional scalar time scale, in the form of the ratio of the scalar field time scale
 $\langle {\it\phi}^{2}\rangle /\langle {\it\chi}\rangle$
to the turbulence time scale
 $K/\langle {\it\epsilon}\rangle$
, where
 $K=3/2{\it\sigma}_{u}^{2}$
is the turbulence kinetic energy. At very small times, from (2.24) we have
 $\langle {\it\phi}^{2}\rangle \approx {\it\sigma}_{u}^{2}t^{2}G^{2}$
, while from (6.8) in the limit
 $\tilde{r}_{0}\rightarrow 0$
we have
 $\langle {\it\chi}\rangle \approx 2/3Sc^{-1}(t^{2}/t_{{\it\eta}}^{2})G^{2}{\it\nu}$
. This readily leads to
 $$\begin{eqnarray}\displaystyle \frac{\langle {\it\phi}^{2}\rangle /\langle {\it\chi}\rangle }{K/\langle {\it\epsilon}\rangle }=Sc,\quad \text{for}~t\rightarrow 0. & & \displaystyle\end{eqnarray}$$
Data for the non-dimensional scalar time scale in the large-time stationary limit in DNS have been examined by Borgas et al. (Reference Borgas, Sawford, Xu, Donzis and Yeung2004) (for
 $Sc\geqslant 1$
) and Donzis et al. (Reference Donzis, Sreenivasan and Yeung2005) (for
 $Sc\geqslant 1/8$
). Both present semi-empirical results, based on integration of the scalar spectrum, describing the dependence of the time scale on the Reynolds number and Schmidt number. For
 $Sc=1$
the result given by Borgas et al. (Reference Borgas, Sawford, Xu, Donzis and Yeung2004) is simpler (and is found to fit the data slightly better). It is of the form
 $$\begin{eqnarray}\displaystyle \frac{\langle {\it\phi}^{2}\rangle /\langle {\it\chi}\rangle }{K/\langle {\it\epsilon}\rangle }=a+bR_{{\it\lambda}}^{-1}, & & \displaystyle\end{eqnarray}$$
where values of
 $a=0.41$
and
 $b=4.33$
represent the DNS data well. Clearly, (6.12) breaks down for
 $R_{{\it\lambda}}=0$
, but we are mostly interested in the large-Reynolds-number limit. For
 $Sc\gg 1$
both groups propose a correction logarithmic in Schmidt number, which arises from the Batchelor
 $k^{-1}$
spectrum (Batchelor Reference Batchelor1959), so that (6.12) becomes
 $$\begin{eqnarray}\displaystyle \frac{\langle {\it\phi}^{2}\rangle /\langle {\it\chi}\rangle }{K/\langle {\it\epsilon}\rangle }=a+bR_{{\it\lambda}}^{-1}+\frac{5\sqrt{15}}{3}B_{{\it\phi}}R_{{\it\lambda}}^{-1}\ln Sc, & & \displaystyle\end{eqnarray}$$
where
 $B_{{\it\phi}}\approx 5$
(Borgas et al.
Reference Borgas, Sawford, Xu, Donzis and Yeung2004; Donzis et al.
Reference Donzis, Sreenivasan and Yeung2010) is the Batchelor constant. For
 $Sc\ll 1$
, Donzis et al. (Reference Donzis, Sreenivasan and Yeung2005) propose an inverse square-root correction, so in this case (6.12) becomes
 $$\begin{eqnarray}\displaystyle \frac{\langle {\it\phi}^{2}\rangle /\langle {\it\chi}\rangle }{K/\langle {\it\epsilon}\rangle }=a+bR_{{\it\lambda}}^{-1}-cR_{{\it\lambda}}^{-1}Sc^{-1/2}. & & \displaystyle\end{eqnarray}$$
Evolution of the ratio of scalar to mechanical time scales. The dashed lines in (a) represent Eulerian data for
 $Sc=1/8$
(lower curve) and
 $Sc=1$
(upper curve). The corresponding solid lines are smoothing functions satisfying the small- and large-time limits (6.11)–(6.14). Panel (b) shows these smoothing functions (the dashed and solid curves are for
 $Sc=1/8$
and 1 respectively) from fits to data at
 $R_{{\it\lambda}}=140$
(red), 240 (blue), 390 (magenta) and 650 (cyan) (bottom to top at small times). The dashed lines in (c) show Lagrangian data (for
 $\tilde{r}_{0}/{\it\eta}=1/4$
) at
 $R_{{\it\lambda}}=140$
for
 $Sc=0.01$
(black), 0.125 (blue), 1 (cyan), 8 (green), 100 (red) and 1000 (magenta) (bottom to top). The corresponding solid lines are smoothing functions interpolated to the small-time limit (6.11).

Here, we take
 $c=1.25$
. The data used in developing these semi-empirical relations were averaged over an extended time period of several eddy-turnover times in a stationary state, whereas the present data are time series subject to significant sampling variation, particularly at low Reynolds number. In order to smooth out these variations, we have fitted suitable functions, typically an exponential decay with a linear correction, to the data. These functions have been constrained to satisfy the small-time limit (6.11) and the stationary limits (6.12)–(6.14). Figure 11(a) shows the result of such a fit to Eulerian time series for
 $Sc=1/8$
and
 $Sc=1$
at
 $R_{{\it\lambda}}=140$
. Given the variation, particularly at large times, the fitted functions are good representations of the data. The sampling variation decreases, and the fits improve, with increasing Reynolds number. Figure 11(b) shows the fitted functions for
 $R_{{\it\lambda}}=140{-}650$
. There are two points to note. First, at small times, the time scale is directly proportional to
 $Sc$
even in the large-Reynolds-number limit, so molecular diffusion can never be neglected. Second, in the stationary state for fixed
 $Sc$
, the time scale becomes independent of
 $Sc$
with increasing Reynolds number. This is again a manifestation of the scalar dissipation anomaly. These findings are confirmation of the small- and large-time predictions presented above. Finally, figure 11(c) shows results as a function of
 $Sc$
at
 $R_{{\it\lambda}}=140$
. In this case we show Lagrangian results for
 $\tilde{r}_{0}/{\it\eta}=1/4$
, which approximate the dissipation rate and hence the scalar time scale, since our Eulerian results do not cover a wide range of
 $Sc$
. We see that at small times our results, shown as the dashed lines, deviate from the limit (6.11) because
 $\tilde{r}_{0}/{\it\eta}=1/4$
is not small enough. Nevertheless, we have again been able to use suitable functional forms, shown as the solid lines, to fit our data and interpolate to the small-time limit. In this case of fixed Reynolds number, we see that with increasing
 $Sc$
, the time scale in the stationary limit increases in agreement with the logarithmic dependence in (6.13). Thus, in agreement with the theory developed in Borgas et al. (Reference Borgas, Sawford, Xu, Donzis and Yeung2004) and Donzis et al. (Reference Donzis, Sreenivasan and Yeung2005), our data show that the limit
 ${\it\kappa}\rightarrow 0$
is singular. For
 $R_{{\it\lambda}}\rightarrow \infty$
at finite
 $Sc$
the scalar dissipation and the scalar time scale are independent of molecular diffusion. On the other hand, for
 $Sc\rightarrow \infty$
at finite
 $R_{{\it\lambda}}$
the scalar dissipation vanishes and the scalar time scale diverges.
7 Conclusions
Statistics of the trajectories of diffusing molecules undergoing Brownian motion relative to the fluid are important in a Lagrangian description of turbulent mixing, but are not readily available in the literature. In this paper we have addressed several extensions to classical theory and have reported results on molecular dispersion at Schmidt numbers (
 $Sc$
) ranging from 0.001 to 1000 in direct numerical simulations of stationary isotropic turbulence at Taylor-scaled Reynolds numbers (
 $R_{{\it\lambda}}$
) of 140–1000. Statistics of molecular pairs followed both forwards and backwards in time are obtained using a postprocessing approach (Buaria et al.
Reference Buaria, Sawford and Yeung2015) which is adapted for massively parallel computation with a large sample of size of order
 $10^{13}$
pairs. Our two main objectives are to understand how the statistics of molecules (singly and in pairs) in different temporal regimes depend on
 $R_{{\it\lambda}}$
and
 $Sc$
, and to relate these statistics to Eulerian results for a passive scalar driven by a uniform mean gradient (which, compared with the Lagrangian approach adopted here, are less readily obtained if
 $Sc\ll 1$
or
 $Sc\gg 1$
).
As Saffman (Reference Saffman1960) showed, the mean-squared displacement of a single molecule is the sum of a double integral of the autocorrelation of fluid velocity along the molecular trajectory (called the substance autocorrelation,
 ${\it\rho}_{m}({\it\tau})$
) and a direct diffusion term that is linear in time. In general, as
 $Sc$
decreases,
 ${\it\rho}_{m}({\it\tau})$
decreases more rapidly with time lag
 ${\it\tau}$
, resulting in a molecular integral time scale (
 $T_{m}$
) that for any finite
 $Sc$
is smaller than the Lagrangian velocity integral time scale (
 $T_{L}$
). However, this departure from fluid particle behaviour, and correspondingly the effect of molecular diffusion on one-molecule statistics, is substantial only for
 $Sc\ll 1$
, and also becomes weak at high
 $R_{{\it\lambda}}$
with
 $Sc$
fixed. Very good agreement is obtained with the theoretical predictions of Saffman (Reference Saffman1960) except for the scaling of
 $T_{m}/T_{L}$
at low
 $Sc$
.
For two-molecule statistics, we are able to extend a theoretical result of Saffman (Reference Saffman1960) from the case of initially coincident pairs to pairs of finite initial separation. Excellent agreement is obtained between DNS and theory in the ballistic and diffusive limits. At intermediate times, both the forward and the backward dispersion show clear signs of Richardson’s
 $t^{3}$
scaling, with the backward Richardson constant being larger, as expected from recent results on fluid particle pairs (Buaria et al.
Reference Buaria, Sawford and Yeung2015). As a result of the Brownian motion, molecular pairs separate and lose memory of their initial separation faster, which appears to lead to more robust Richardson scaling for molecules compared with fluid particles. However, if the molecular diffusion is very strong (when the Reynolds number is not large and
 $Sc$
is very low), no scaling is observed. Our data suggest the forward and backward Richardson constants to be approximately 0.55 and 1.53–1.57 respectively for large
 $Sc$
and large
 $R_{{\it\lambda}}$
, which is in good agreement with the limited data in the literature. An observed weak dependence on
 $Sc$
implies that a Reynolds number higher than those in this work is required to reach the asymptotic behaviour independent of
 $Sc$
.
The connection between molecular displacements and passive scalar statistics in turbulent mixing is well known in theory but in practice rarely demonstrated explicitly. For the case of a scalar field generated by a uniform mean gradient we are able to relate numerical results on one- and two-molecule statistics to Eulerian results which are more restricted in the range of Schmidt numbers accessible in DNS without much greater computational cost. The rate of production of scalar fluctuations inferred from the one-molecule mean-squared displacement is seen to be in excellent agreement with Eulerian DNS results. The scalar dissipation requires the consideration of initially coincident backward trajectories of molecular pairs. However, for
 $Sc\sim O(1)$
, pairs initially approximately 1/4 of a Kolmogorov length scale (
 ${\it\eta}$
) apart appear to give adequate results. In the case of
 $Sc\ll 1$
, a close correspondence is also possible but can be clearly observed only at smaller times than were recorded in our DNS. In the opposite limit of
 $Sc\gg 1$
, a similar degree of agreement requires good sampling of backward pairs that are initially much closer than a distance of
 ${\it\eta}/4$
and correspondingly a much larger population of molecules tracked in the simulations.
Our results confirm that molecular diffusion cannot be neglected at small times where the scalar dissipation depends directly on
 $Sc$
. At large times, our results show that both the scalar dissipation rate and the scalar time scale become independent of
 $Sc$
for fixed
 $Sc$
in the large-Reynolds-number limit. This is a manifestation of the scalar dissipation anomaly (Donzis et al.
Reference Donzis, Sreenivasan and Yeung2005), and is evidence for so-called ‘spontaneous stochasticity’ (Bernard et al.
Reference Bernard, Gawedzki and Kupiainen1998; Eyink Reference Eyink2011). On the other hand, for fixed Reynolds number, in the limit of large
 $Sc$
the scalar dissipation rate vanishes and the scalar time scale diverges. Thus, the limit
 ${\it\kappa}\rightarrow 0$
is singular. As a consequence of the scalar dissipation anomaly and spontaneous stochasticity, in the large-Reynolds-number limit fluid particles can be used in place of molecules to calculate scalar statistics on scales outside the dissipation subrange.
In conclusion, we stress that the effects of molecular diffusion, which are often neglected in Lagrangian models of turbulent transport, have many interesting facets which may become prominent under a combination of conditions such as early times, small initial separations and low Schmidt numbers. The analysis of molecular trajectories, especially in a backwards-in-time reference frame, as validated in this work, can potentially provide useful answers for the mixing of a passive scalar at Schmidt numbers beyond those readily accessible in an Eulerian framework. We have focused on first and second moments. Higher-order moments require the study of multimolecular clusters such as tetrads of various initial sizes and shapes.
Acknowledgements
The authors gratefully acknowledge support from the Fluid Dynamics Program of the National Science Foundation, under grant CBET-1235906. The computations and data analyses reported in this paper were performed primarily using advanced computational facilities provided by the Texas Advanced Computation Center (TACC) under the XSEDE program supported by the NSF. We also used resources provided through the Blue Waters project at the University of Illinois at Urbana-Champaign under the Petascale Resource Allocations program supported by the NSF, via grant ACI-1036170.
Appendix A. Small-time asymptote for molecular pairs of finite initial separation
We work in Cartesian tensor notation, with summation implied over repeated roman subscripts. Starting with (2.14) and using a Taylor-series expansion for the relative velocity under the condition
 $r(t)\ll {\it\eta}$
, we can write
 $$\begin{eqnarray}\displaystyle \text{d}r_{i}(t)=\unicode[STIX]{x1D608}_{ij}(t)r_{j}(t)\,\text{d}t+\sqrt{4{\it\kappa}}\,\text{d}W_{i}^{(r)}, & & \displaystyle\end{eqnarray}$$
where
 $\unicode[STIX]{x1D608}_{ij}=\partial u_{i}/\partial x_{j}$
is the velocity gradient tensor. This upon integration gives
 $$\begin{eqnarray}\displaystyle r_{i}(t)-r_{i}(0)=\int _{0}^{t}\unicode[STIX]{x1D608}_{ij}(t)r_{j}(t)\,\text{d}t+\sqrt{4{\it\kappa}}\int _{0}^{t}\text{d}W_{i}^{(r)}. & & \displaystyle\end{eqnarray}$$
For
 $t\ll t_{{\it\eta}}$
, we can approximate the first term on the right-hand side to first order and write
 $$\begin{eqnarray}\displaystyle r_{i}(t)-r_{i}(0)=\unicode[STIX]{x1D608}_{ij}(0)r_{j}(0)t+\sqrt{4{\it\kappa}}W_{i}^{(r)}(t). & & \displaystyle\end{eqnarray}$$
Now, substituting
 $r_{i}(t)$
from this into the right-hand side of (A 1), we get
 $$\begin{eqnarray}\displaystyle \text{d}r_{i}(t)=\unicode[STIX]{x1D608}_{ij}(t)(r_{j}(0)+\unicode[STIX]{x1D608}_{jk}(0)r_{k}(0)t+\sqrt{4{\it\kappa}}W_{j}^{(r)}(t))\,\text{d}t+\sqrt{4{\it\kappa}}\,\text{d}W_{i}^{(r)}(t). & & \displaystyle\end{eqnarray}$$
The first term can be integrated by approximating the velocity gradient by its value at
 $t=0$
again and introducing the integrated Wiener process
 $\boldsymbol{W}^{-1}(t)$
(Gardiner Reference Gardiner1983) (the function whose time derivatives give
 $\boldsymbol{W}(t)$
). We obtain
 $$\begin{eqnarray}\displaystyle r_{i}(t)-r_{i}(0)=\unicode[STIX]{x1D608}_{ij}(0)\left(r_{j}(0)t+\unicode[STIX]{x1D608}_{jk}(0)r_{k}(0)\frac{t^{2}}{2}+\sqrt{4{\it\kappa}}W_{j}^{-1}(t)\right)+\sqrt{4{\it\kappa}}W_{i}^{(r)}(t). & & \displaystyle\end{eqnarray}$$
By definition,
 $\boldsymbol{W}^{-1}(t)$
has zero mean and its covariance tensor
 $\left\langle W_{i}^{-1}(t)W_{j}^{-1}(t)\right\rangle$
is equal to
 ${\it\delta}_{ij}t^{3}/3$
. Now, squaring and averaging (A 5), we get, up to
 $O(t^{3})$
,
 $$\begin{eqnarray}\displaystyle \langle |\boldsymbol{r}(t)-\boldsymbol{r}(0)|^{2}\rangle & = & \displaystyle \langle \unicode[STIX]{x1D608}_{ij}\unicode[STIX]{x1D608}_{il}\rangle r_{j}(0)r_{l}(0)t^{2}+\langle \unicode[STIX]{x1D608}_{ij}\unicode[STIX]{x1D608}_{jk}\unicode[STIX]{x1D608}_{il}\rangle r_{k}(0)r_{l}(0)t^{3}\nonumber\\ \displaystyle & & \displaystyle +\,4{\it\kappa}\langle W_{i}^{(r)}(t)W_{i}^{(r)}(t)\rangle +4{\it\kappa}\langle \unicode[STIX]{x1D608}_{ij}\unicode[STIX]{x1D608}_{il}\rangle \langle W_{j}^{-1}(t)W_{l}^{-1}(t)\rangle ,\end{eqnarray}$$
where covariances between velocity gradients and Wiener processes are zero since they are independent. To simplify the notation we also omit the dependence on
 $t=0$
here and hereafter. Now, we can write
 $r_{i}(0)=r_{0}e_{i}$
, where
 $r_{0}$
is the initial separation (distance) and
 $e_{i}$
is the
 $i$
th component of the unit vector along the initial separation vector, with the property
 $e_{i}e_{i}=1$
. By also substituting the covariances of Wiener processes, we obtain
 $$\begin{eqnarray}\displaystyle \langle |\boldsymbol{r}(t)-\boldsymbol{r}(0)|^{2}\rangle & = & \displaystyle r_{0}^{2}(\langle \unicode[STIX]{x1D608}_{ij}\unicode[STIX]{x1D608}_{il}\rangle e_{j}e_{l}t^{2}+\langle \unicode[STIX]{x1D608}_{ij}\unicode[STIX]{x1D608}_{jk}\unicode[STIX]{x1D608}_{il}\rangle e_{k}e_{l}t^{3})+12{\it\kappa}t+4{\it\kappa}\langle \unicode[STIX]{x1D608}_{ij}\unicode[STIX]{x1D608}_{il}\rangle {\it\delta}_{jl}\frac{t^{3}}{3}.\end{eqnarray}$$
Next, to analyse the second and third moments in (A 7) it is useful to note the properties of the fourth- and sixth-order tensors in isotropic incompressible turbulence. In particular, we can write (Pope Reference Pope2000)
 $$\begin{eqnarray}\displaystyle F_{ikjl} & = & \displaystyle \langle \unicode[STIX]{x1D608}_{ij}\unicode[STIX]{x1D608}_{kl}\rangle ={\it\alpha}\left(2{\it\delta}_{ik}{\it\delta}_{jl}-{\textstyle \frac{1}{2}}{\it\delta}_{ij}{\it\delta}_{kl}-{\textstyle \frac{1}{2}}{\it\delta}_{il}{\it\delta}_{jk}\right),\end{eqnarray}$$
 $$\begin{eqnarray}\displaystyle G_{ijkpqr} & = & \displaystyle \langle \unicode[STIX]{x1D608}_{ip}\unicode[STIX]{x1D608}_{jq}\unicode[STIX]{x1D608}_{kr}\rangle ={\it\beta}\left({\it\delta}_{ip}{\it\delta}_{jq}{\it\delta}_{kr}-{\textstyle \frac{4}{3}}[{\it\delta}_{ip}{\it\delta}_{jk}{\it\delta}_{qr}+{\it\delta}_{jq}{\it\delta}_{ik}{\it\delta}_{pr}+{\it\delta}_{kr}{\it\delta}_{ij}{\it\delta}_{pq}]\right.\nonumber\\ \displaystyle & & \displaystyle -\,{\textstyle \frac{1}{6}}[{\it\delta}_{ip}{\it\delta}_{jr}{\it\delta}_{qk}+{\it\delta}_{jq}{\it\delta}_{ir}{\it\delta}_{pk}+{\it\delta}_{kr}{\it\delta}_{iq}{\it\delta}_{pj}]-{\textstyle \frac{3}{4}}[{\it\delta}_{iq}{\it\delta}_{pk}{\it\delta}_{jr}+{\it\delta}_{ir}{\it\delta}_{pj}{\it\delta}_{qk}]\nonumber\\ \displaystyle & & \displaystyle +\left.[{\it\delta}_{ij}{\it\delta}_{pk}{\it\delta}_{qr}+{\it\delta}_{ij}{\it\delta}_{qk}{\it\delta}_{pr}+{\it\delta}_{ik}{\it\delta}_{pj}{\it\delta}_{qr}+{\it\delta}_{ik}{\it\delta}_{rj}{\it\delta}_{pq}+{\it\delta}_{jk}{\it\delta}_{qi}{\it\delta}_{pr}+{\it\delta}_{jk}{\it\delta}_{ri}{\it\delta}_{pq}]\right),\end{eqnarray}$$
where
 ${\it\alpha}=\langle \unicode[STIX]{x1D608}_{11}^{2}\rangle$
and
 ${\it\beta}=\langle \unicode[STIX]{x1D608}_{11}^{3}\rangle$
are the second- and third-order moments respectively of
 $\unicode[STIX]{x1D608}_{11}$
, i.e. a longitudinal velocity gradient. Standard isotropy relations give
 ${\it\alpha}=\langle {\it\epsilon}\rangle /(15{\it\nu})$
and
 ${\it\beta}=S_{u}{\it\alpha}^{3/2}$
, where
 $S_{u}$
is the skewness of
 $\unicode[STIX]{x1D608}_{11}$
. In isotropic turbulence
 $S_{u}$
is also equal to the negative of the dissipation skewness
 $S_{{\it\epsilon}}$
(Kerr Reference Kerr1985). By evaluating
 $F_{iijl}$
and
 $G_{ijijkl}$
according to the tensor relations above, we obtain
 $$\begin{eqnarray}\displaystyle & \displaystyle \langle \unicode[STIX]{x1D608}_{ij}\unicode[STIX]{x1D608}_{il}\rangle e_{j}e_{l}=5{\it\alpha}=\frac{1}{3t_{{\it\eta}}^{2}}, & \displaystyle\end{eqnarray}$$
 $$\begin{eqnarray}\displaystyle & \displaystyle \langle \unicode[STIX]{x1D608}_{ij}\unicode[STIX]{x1D608}_{il}\rangle {\it\delta}_{jl}=15{\it\alpha}=\frac{1}{t_{{\it\eta}}^{2}}, & \displaystyle\end{eqnarray}$$
 $$\begin{eqnarray}\displaystyle & \displaystyle \langle \unicode[STIX]{x1D608}_{ij}\unicode[STIX]{x1D608}_{jk}\unicode[STIX]{x1D608}_{il}\rangle e_{k}e_{l}=\frac{35}{6}{\it\beta}=-\frac{7}{18\sqrt{15}}\frac{S_{{\it\epsilon}}}{t_{{\it\eta}}^{3}}. & \displaystyle\end{eqnarray}$$
By substituting these in (A 7), we get
 $$\begin{eqnarray}\displaystyle \left\langle |\boldsymbol{r}(t)-\boldsymbol{r}(0)|^{2}\right\rangle =r_{0}^{2}\left[\frac{1}{3}\left(\frac{t}{t_{{\it\eta}}}\right)^{2}-\frac{7~S_{{\it\epsilon}}}{18\sqrt{15}}\left(\frac{t}{t_{{\it\eta}}}\right)^{3}\right]+12{\it\kappa}t+\frac{4}{3}{\it\kappa}\frac{t^{3}}{t_{{\it\eta}}^{2}}. & & \displaystyle\end{eqnarray}$$
In the steps taken so far we have assumed that we are integrating forward in time, such that this formula strictly holds for forward dispersion. To consider backward dispersion, we may replace
 $t$
by
 $-t$
on the left-hand side and in the square bracket on the right-hand side. However, since the last two terms in (A 13) represent the non-negative variances of Wiener and integrated Wiener processes, they retain the same sign if
 $t$
is replaced by
 $-t$
. A result valid for both backward and forward dispersion can thus be written with the absolute value of time
 $|t|$
in the last two terms of (A 13). Finally, dividing both sides by
 ${\it\eta}^{2}$
recovers the result (2.17), as required.
Appendix B. A robust approach for calculating molecular displacement statistics in the Lagrangian view of mixing
Starting with
 $Y_{i}^{m}(t)=x_{i}^{m}(t)-x_{i}^{m}(0)$
and using Ito’s rule (Gardiner Reference Gardiner1983), we can write a stochastic differential equation (SDE) for
 $Y_{i}^{m}Y_{i}^{m}$
as
 $$\begin{eqnarray}\displaystyle \text{d}(Y_{i}^{m}Y_{i}^{m})=2Y_{i}^{m}\,\text{d}Y_{i}^{m}+\text{d}Y_{i}^{m}\,\text{d}Y_{i}^{m}. & & \displaystyle\end{eqnarray}$$
Recognizing that
 $\text{d}Y_{i}^{m}=\text{d}x_{i}^{m}$
and substituting
 $\text{d}x_{i}^{m}$
from (1.1), we get
 $$\begin{eqnarray}\displaystyle \text{d}(Y_{i}^{m}Y_{i}^{m})=2Y_{i}^{m}(u_{i}\,\text{d}t+\sqrt{2{\it\kappa}}\,\text{d}W_{i})+(u_{i}\,\text{d}t+\sqrt{2{\it\kappa}}\,\text{d}W_{i})(u_{i}\,\text{d}t+\sqrt{2{\it\kappa}}\,\text{d}W_{i}), & & \displaystyle\end{eqnarray}$$
where
 $u_{i}$
is the fluid velocity at the molecular position. Ignoring higher-order terms of the form
 $\text{d}t\,\text{d}t$
and
 $\text{d}t\,\text{d}W_{i}$
, and using
 $\text{d}W_{i}\,\text{d}W_{i}={\it\delta}_{ii}\,\text{d}t=3\,\text{d}t$
from the property of Wiener processes, we get
 $$\begin{eqnarray}\displaystyle \text{d}(Y_{i}^{m}Y_{i}^{m})=2Y_{i}^{m}u_{i}\,\text{d}t+2Y_{i}^{m}\sqrt{2{\it\kappa}}\,\text{d}W_{i}+6{\it\kappa}\,\text{d}t. & & \displaystyle\end{eqnarray}$$
Taking the ensemble average over the entire population of molecules, the second term on the right-hand side becomes zero, and the result can be rearranged to give
 $$\begin{eqnarray}\displaystyle \text{d}\langle Y_{i}^{m}Y_{i}^{m}\rangle /\text{d}t=2\langle Y_{i}^{m}u_{i}\rangle +6{\it\kappa}. & & \displaystyle\end{eqnarray}$$
Substituting this result in (2.30) gives
 $$\begin{eqnarray}\displaystyle P={\textstyle \frac{2}{3}}G^{2}\langle Y_{i}^{m}u_{i}\rangle . & & \displaystyle\end{eqnarray}$$
Thus, we have now obtained an alternative expression for the scalar production in terms of the covariance of the molecular displacement and fluid velocity at molecular positions, which is easier to calculate reliably.
A similar analysis for molecular pairs gives
 $$\begin{eqnarray}\displaystyle \text{d}\langle r^{2}\rangle /\text{d}t=2\langle r_{i}u_{i}^{(r)}\rangle +12{\it\kappa}, & & \displaystyle\end{eqnarray}$$
which on substituting in (2.29) gives
 $$\begin{eqnarray}\displaystyle {\it\chi}={\textstyle \frac{1}{3}}G^{2}\langle r_{i}u_{i}^{(r)}\rangle _{r_{0}(t)\rightarrow 0}. & & \displaystyle\end{eqnarray}$$
The expressions for scalar production and dissipation developed in this appendix have the advantage of avoiding numerical differentiation, which is prone to numerical noise.