I. INTRODUCTION
New absorber-layer materials with earth-abundant elements are desired for large-scale deployment of high-efficiency thin-film solar cells. BaSi2 is a promising candidate because of excellent optoelectronic properties and the abundance of constituent elements in the Earth’s crust.Reference Suemasu and Usami1 Its band gap is 1.3 eV, appropriate for solar cell applications.Reference Toh, Saito and Suemasu2–Reference Trinh, Nakagawa, Hara, Takabe, Suemasu and Usami5 Optical absorption coefficients exceed 104 cm−1 for photon energies over E g.Reference Toh, Saito and Suemasu2–Reference Kumar, Umezawa and Imai4 Minority-carrier lifetime is long (>5 μs when surface-passivated),Reference Hara, Usami, Nakamura, Takabe, Baba, Toko and Suemasu6–Reference Shaalan, Hara, Trinh, Nakagawa and Usami9 and accordingly, minority-carrier diffusion length is long (10 μm).Reference Baba, Toh, Toko, Saito, Yoshizawa, Jiptner, Sekiguchi, Hara, Usami and Suemasu10,Reference Suemasu11 Majority carriers of undoped BaSi2 are usually electrons possibly because of intrinsic point defects.Reference Kumar, Umezawa, Zhou and Imai12,Reference Takabe, Deng, Kodama, Yamashita, Sato, Toko and Suemasu13 The conductivity type and carrier density can be controlled either by impurity dopingReference Kobayashi, Matsumoto, Ichikawa, Tsukada and Suemasu14–Reference Ajmal Khan and Suemasu21 or by controlling the Ba/Si ratio.Reference Takabe, Deng, Kodama, Yamashita, Sato, Toko and Suemasu13,Reference Hara, Trinh, Arimoto, Yamanaka, Nakagawa, Kurokawa, Suemasu and Usami22 Recently, solar cells with p-type BaSi2/n-type Si heterojunction has been realized by molecular beam epitaxy (MBE).Reference Tsukahara, Yachi, Takeuchi, Takabe, Du, Baba, Li, Toko, Usami and Suemasu23 The maximum power conversion efficiency is 9.9%.Reference Yachi, Takabe, Takeuchi, Toko and Suemasu24
Thermal evaporation is currently the only method that can produce BaSi2 films with variable carrier density without using ultra high vacuum. The control of electron density (n) in evaporated BaSi2 films is enabled by varying deposition rates.Reference Hara, Trinh, Arimoto, Yamanaka, Nakagawa, Kurokawa, Suemasu and Usami22 This is probably owing to the variation of Ba/Si ratio in the BaSi2 films. Precise control of composition depth profiles of the film is therefore necessary for device applications. Diffusion is the important process determining the Ba/Si ratio since a BaSi2 film forms from the vapor of varying composition from being Ba-rich to Si-rich during thermal evaporation.Reference Nakagawa, Hara, Suemasu and Usami25 The evidence of the vapor composition change shown in the previous study, however, consists only of two data points.Reference Nakagawa, Hara, Suemasu and Usami25 To discuss the mechanism determining the Ba/Si ratio, detailed data regarding the composition change of the vapor and the diffusion behavior of the deposited atoms are required.
Depth profiles of oxygen impurity concentration in evaporated BaSi2 films is another focus of the study since the discovery of a high-oxygen-concentration layer near the BaSi2/Si interface and a thick surface oxidation layer.Reference Hara, Trinh, Arimoto, Yamanaka, Nakagawa, Kurokawa, Suemasu and Usami22,Reference Takabe, Du, Ito, Takeuchi, Toko, Ueda, Kimura and Suemasu26–Reference Hara, Trinh, Kurokawa, Arimoto, Yamanaka, Nakagawa and Usami28 Proper premelting of the BaSi2 source was lately found to suppress the near-interface oxidation down to the detection limit of Auger electron spectroscopy (AES).Reference Hara, Yamamoto, Yamanaka, Arimoto, Nakagawa and Usami29,Reference Hara, Arimoto, Yamanaka, Nakagawa and Usami30 In parallel with the reduction of near-interface oxidation, however, the surface oxidation depth increased in the previous study.Reference Hara, Arimoto, Yamanaka, Nakagawa and Usami30 The reason why the source premelting promotes surface oxidation is still unexplained. Another previous study indicated the existence of the optimum postannealing duration that minimized the surface oxidation depth.Reference Hara, Trinh, Kurokawa, Arimoto, Yamanaka, Nakagawa and Usami28 It has been suggested that the composition homogeneity around the surface is the key to suppress surface oxidation.Reference Hara, Trinh, Kurokawa, Arimoto, Yamanaka, Nakagawa and Usami28 To fabricate BaSi2 films with controlled carrier density and suppressed oxidation by thermal evaporation, therefore, it is of primary importance to elucidate the mechanism determining the composition depth profiles during film formation. In this study, we investigated the effects of source premelting, substrate temperature (T sub), and film thickness (w) on the composition depth profiles of evaporated BaSi2 films. The mechanism of composition profile evolution is discussed based on the results. The relationship between the electrical properties and the film composition is also investigated.
II. EXPERIMENTAL METHODS
Commercial BaSi2 lumps (99% in purity, Kojundo Chemical Laboratory, Saitama, Japan) were used as a source material for thermal evaporation after being crushed into granules of <5 mm in diameter. The BaSi2 granules with a total weight of 0.035–0.100 g were placed on a tungsten boat in a vacuum chamber. The base pressure of the chamber was below 1 × 10⁻³ Pa. By melting the BaSi2 granules through resistive heating of the boat, the Ba–Si vapor showing a compositional change with time from being Ba-rich to being Si-richReference Nakagawa, Hara, Suemasu and Usami25 was generated. The Si(100) wafers (>1000 Ω cm) were used as substrates after cleaning with acetone and methanol, followed by diluted HF solution. Before starting film deposition, the source premelting was performed with the shutter closed at a boat heating current of 80 A for 8 s, which is the effective condition to suppress near-interface oxidation for 200-nm-thick films.Reference Hara, Arimoto, Yamanaka, Nakagawa and Usami30 After premelting, the films were deposited at 100 A at T sub’s of room temperature (RT) to 700 °C. The films were then postannealed at T sub of deposition for 30 s except one sample and cooled to RT at a rate of 20 K/min. Only the film deposited at 650 °C without source premelting was fabricated without precise control of postannealing duration.
The prepared films were characterized by Auger electron spectroscopy (AES; JAMP-7810, JEOL, Tokyo, Japan), Raman spectroscopy (inVia Raman microscope, Renishaw, Gloucestershire, United Kingdom) with a diode laser (λ = 488 nm), scanning electron microscopy (SEM; S-5200, Hitachi, Tokyo, Japan), 2θ–ω X-ray diffraction (XRD) analysis (Discover D8, Billerica, Massachusetts), and Hall measurement (ResiTest8308, TOYO, Tokyo, Japan) at RT with the van der Pauw method. The AES analysis was performed at an acceleration voltage of 10 kV. Composition depth profiles were analyzed using Ar ion sputtering. The SEM was operated at an acceleration voltage of 5 kV. XRD was performed with Cu Kα radiation monochromated by a two-bounce Ge(220) crystal. For the Hall measurement, 150-nm-thick Al contacts were formed on the film surface by sputtering. The contact properties between the Al contacts and the film were also analyzed by the current–voltage measurement at 25 °C.
III. RESULTS AND DISCUSSION
A. Composition depth profiles and structural characteristics
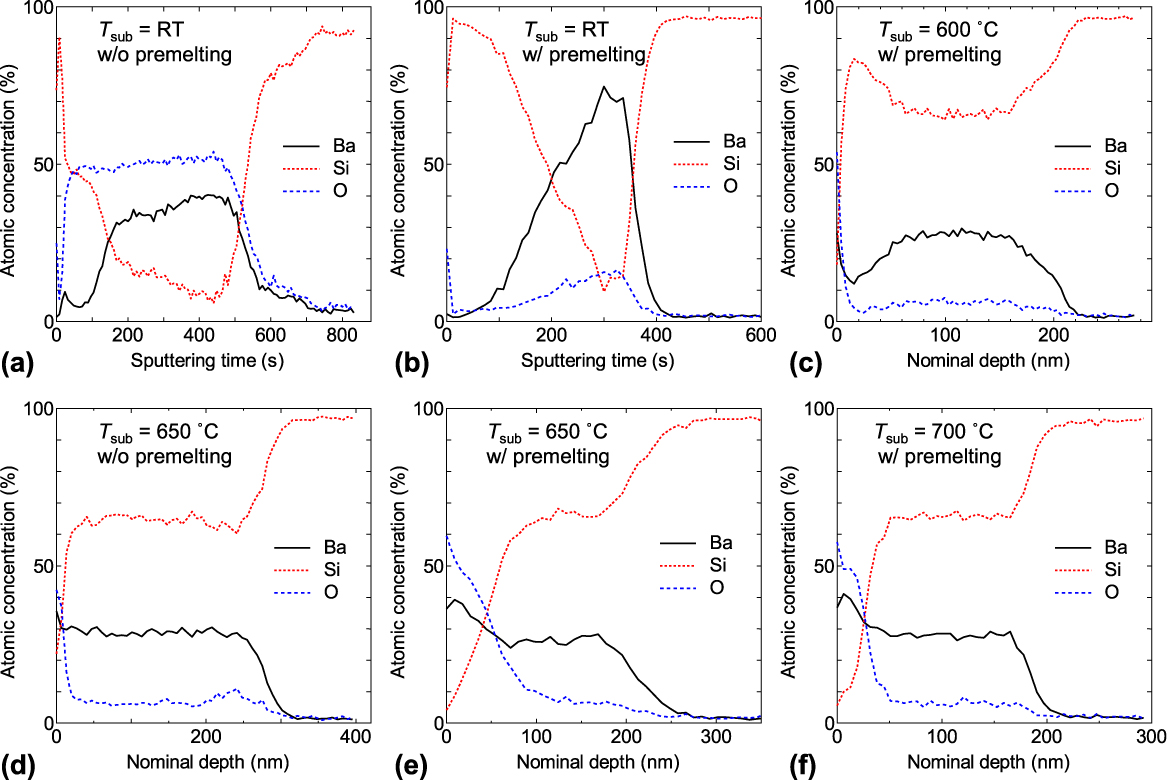
Figure 1 shows the composition depth profiles determined by AES of the films deposited at different T sub’s of RT−700 °C with and without source premelting. The original horizontal axes of sputtering time were linearly converted to the nominal depth, using w measured by cross-sectional SEM, except for the samples deposited at RT [Figs. 1(a) and 1(b)]. The w values of the RT samples [Figs. 1(a) and 1(b)] were not accurately measured because of the oxidation of the cross-sectional surface. It should be kept in mind that the oxygen concentration is overestimated when Ba is present because one of the Ba MNN Auger signals (500 eV) appears at a similar position to O KLL Auger signals (466–503 eV). For example, the O concentration around 6% in the BaSi2 film deposited at 700 °C [Fig. 1(f)] would be mainly from the Ba MNN signal.
AES composition depth profiles of the films deposited at (a and b) T sub = RT, (c) 600 (d and e) 650, and (f) 700 °C. Samples without source premelting (a and d) were also investigated.

All the samples in Figs. 1(a)–1(f) were analyzed from the surface to the substrate. The right side region of high Si concentration (>90 at.%) corresponds to the Si substrate. It is found from the samples deposited at RT [Figs. 1(a) and 1(b)] that Ba concentration is highest near the film–substrate interface and decreases toward the surface. In contrast to Ba, Si concentration increases toward the surface. Since diffusion is suppressed at RT, the observed composition depth profiles are presumably close to the changing vapor composition. These results therefore show that the composition of the vapor from the BaSi2 melt continuously changes from being Ba-rich to being Si-rich during thermal evaporation.
The formation of Ba-rich vapor in the initial stage is owing to either the decomposition of the BaSi2 melt into Ba gas and Si or the reaction between the BaSi2 melt and the W boat, which produces Ba gas and WSix.Reference Nakagawa, Hara, Suemasu and Usami25,Reference Balducci, Brutti, Ciccioli, Trionfetti, Palenzona and Pani31,Reference Hara, Nakagawa, Suemasu and Usami32 As a result of the evaporation mainly of Ba, the melt composition would become Si-rich, leading to the increase in the Si fraction in the vapor. Finally, after the depletion of Ba in the melt, only Si atoms evaporate possibly by sublimation. This is the possible mechanism of the continuous change of vapor composition from being Ba-rich to being Si-rich.
Another important finding from Figs. 1(a) and 1(b) is a higher average Ba/Si ratio in the film without premelting [Fig. 1(a)] than with premelting [Fig. 1(b)]. The average Ba/Si ratio in the film is 1.0 without premelting while it is 0.63 with premelting. This higher Ba/Si ratio than the stoichiometric ratio is attributed to the loss of Si from the BaSi2 melt through the reaction between BaSi2 and the W boat.Reference Hara, Nakagawa, Suemasu and Usami32 The decrease of the Ba/Si ratio by premelting is because the initial Ba-rich vapor was not deposited due to the closed shutter during premelting.
It is also noticed that O concentration is higher without premelting [Fig. 1(a)] than with premelting [Fig. 1(b)]. This would be because the film with a high Ba/Si ratio is easily oxidized upon exposure to air.
At higher T sub’s of 600–700 °C, the composition change due to diffusion is observed. At 600 °C [Fig. 1(c)], the Ba/Si ratio is constant around 1/2 in the depth range of 80–150 nm, indicating the formation of BaSi2 through the mutual diffusion of Ba and Si. Around the surface, on the other hand, the concentration of Si is higher while that of Ba is lower, which means that diffusion is not enough to form a homogeneous film up to the surface at this temperature. At 650 °C without premelting [Fig. 1(d)], a homogeneous film is obtained with a Ba/Si ratio around 1/2 up to around the surface except for near-interface oxidation, which means that enough diffusion can occur to form a homogeneous film at this temperature. With premelting at T sub = 650 °C [Fig. 1(e)], near-interface oxidation is suppressed while the surface oxidation depth increases, which is the same as our previous observation.Reference Hara, Arimoto, Yamanaka, Nakagawa and Usami30 The reason of this phenomenon is discussed later. At 700 °C [Fig. 1(f)], the composition depth profiles seem to be similar to that of 650 °C with premelting [Fig. 1(e)] although the surface oxidation is shallower. Since BaSi2 equilibrates with Si according to the phase diagram,Reference Pani and Palenzona33 a significant mixing at the BaSi2/Si interface is not probable.
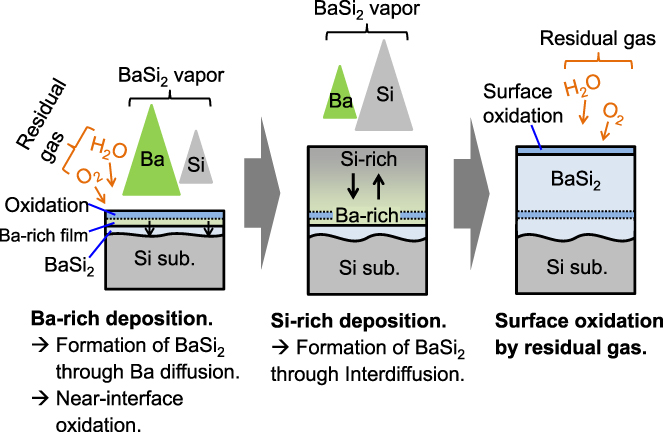
The above results of the changing vapor composition and BaSi2 formation at high T sub’s support the two-stage mechanism of BaSi2 film formation, i.e., in the first stage, BaSi2 forms through the diffusion of Ba atoms from the deposited Ba-rich film to the Si substrate while in the second stage, the mutual diffusion of Ba and Si atoms in the film leads to BaSi2 formation, as schematically depicted in Fig. 2. The probable mechanism of near-interface oxidationReference Hara, Yamamoto, Yamanaka, Arimoto, Nakagawa and Usami29 and surface oxidation are also shown in this figure. The near-interface and surface oxidation can occur in the present medium vacuum of ∼10−4 Pa during T sub is sufficiently high, if Ba atoms are present at the surface.
Schematic illustration of the processes of BaSi2 film formation and oxidation near the interface and the surface.

Figure 3 shows the Raman spectra of the films deposited at T sub = RT−700 °C with premelting. When T sub is RT, a broad Raman band peaked at 473 cm−1 corresponding to amorphous Si (a-Si) is observed, indicating that the film is amorphous. At T sub = 600–700 °C, the Raman bands of BaSi2Reference Somer34,Reference Terai, Yamaguchi, Tsukamoto, Murakoso, Iinuma and Suemasu35 are detected, which demonstrates the formation of BaSi2 in the films. The higher wavelength vibrations than 200 cm−1 are attributed to the internal modes of the Si4 cluster while lower wavelength ones are the external modes.Reference Somer34,Reference Terai, Yamaguchi, Tsukamoto, Murakoso, Iinuma and Suemasu35 At T sub = 600 and 650 °C, the Raman bands of crystalline Si and an oxideReference Hara, Usami, Baba, Toko and Suemasu20 are also observed, which are possibly because of surface oxidation. Similar spectra were previously observed in the BaSi2 films with surface oxidation.Reference Hara, Trinh, Kurokawa, Arimoto, Yamanaka, Nakagawa and Usami28
Raman spectra of the films deposited at T sub = (a) RT, (b) 600, (c) 650, and (d) 700 °C with premelting.

We identified three Raman bands at 163, 314, and 423 cm−1 as an oxide. However, we are not sure what kind of oxides is the origin of these Raman bands.Reference Hara, Usami, Baba, Toko and Suemasu20 These oxide bands were observed in the spectra of the films deposited at 600 and 650 °C while there are no such bands in the spectrum of the 700 °C sample [Figs. 3(b)–3(d)], although all these films have surface oxide layers [Figs. 1(c), 1(e), and 1(f)]. This may be because the 700 °C film does not contain the oxide phase showing the three Raman bands, whereas the 600 and 650 °C films do.
SEM images of the cleaved cross sections of the films deposited at T sub = RT−700 °C with premelting are displayed in Fig. 4. The film deposited at RT [Fig. 4(a)] seems to be thicker (>500 nm) than the other films. This is presumably because of the oxidation of the cleaved surface, where a Ba-rich layer is exposed to air. A part of the Si substrate may have been involved in this oxidation reaction, which could be the reason of the wavy film–substrate interface. Other films deposited at 600–700 °C show similar w values of 180–200 nm. In particular, the 600 °C film [Fig. 4(b)] seems to be homogeneous up to the surface although its composition is markedly Si-rich around the surface, suggesting that it is difficult to see the composition deviation in secondary electron images. On the other hand, in the images of the films deposited at 650 [Fig. 4(c)] and 700 °C [Fig. 4(d)], altered layers (darker areas) are observed around the surfaces. Since these films have thick surface oxide layers, as shown in Fig. 1, the altered layers are probably the oxide layers. It is also noted that the oxide layer of the 700 °C sample is more homogeneous in thickness and thinner than the 650 °C sample. This is possibly due to the epitaxial growth at a high temperature.
Cross-sectional SEM images of the films deposited at T sub = (a) RT, (b) 600, (c) 650, and (d) 700 °C with premelting.

As we previously reported, by increasing T sub, the proportion of a-axis-oriented epitaxial grains increases.Reference Hara, Yamamoto, Yamanaka, Arimoto, Nakagawa and Usami27,Reference Hara, Trinh, Nakagawa, Kurokawa, Arimoto, Yamanaka, Nakagawa and Usami36 Figure 5 shows the 2θ–ω XRD patterns of the films deposited at T sub = 600, 650, and 700 °C with premelting. Intensities of the h00 peaks (h = 2, 4, and 6) increase with increasing T sub. At 700 °C, only h00 peaks are observed from the film except for very weak 211/202/103 and 301/004 diffractions, indicating that the film is almost perfectly a-axis-oriented. Such a-axis-oriented growth at 700 °C was previously observed and the epitaxial growth was demonstrated,Reference Hara, Yamamoto, Yamanaka, Arimoto, Nakagawa and Usami27,Reference Hara, Trinh, Nakagawa, Kurokawa, Arimoto, Yamanaka, Nakagawa and Usami36 suggesting that the present a-axis-oriented BaSi2 film is also epitaxial. The homogeneous thickness of the oxide layer in the film deposited at 700 °C shown in Fig. 4(d) is possibly due to the in-plane homogeneity of the film structure.
2θ–ω XRD patterns of the films deposited at T sub = (a) 600, (b) 650, and (c) 700 °C with premelting. The asterisk symbol denotes the peaks from the Si(100) substrate. Three digit numbers are diffraction indices of BaSi2.

At 650 °C, although h00 peaks are strong, other peaks such as 211/202/103 and 301/004 are observed with moderate strength. This means that the film is partly a-axis-oriented. At 600 °C, the h00 peaks are weak. By contrast, the 301/004 peak is strong. Since the 002, 006, and 008 diffractions are not observed, which could appear at 15.4°, 47.3°, and 64.6°, respectively, the observed peak at 31.09° is presumably the 301 diffraction. The film deposited at 600 °C therefore seems to be well 301 oriented. The preferred 301 orientation has been observed in our previous films deposited at 500 and 600 °C.Reference Trinh, Nakagawa, Hara, Takabe, Suemasu and Usami5 However, the present film is more preferentially oriented. This may be owing to the suppression of near-interface oxidation.Reference Hara, Yamamoto, Yamanaka, Arimoto, Nakagawa and Usami29
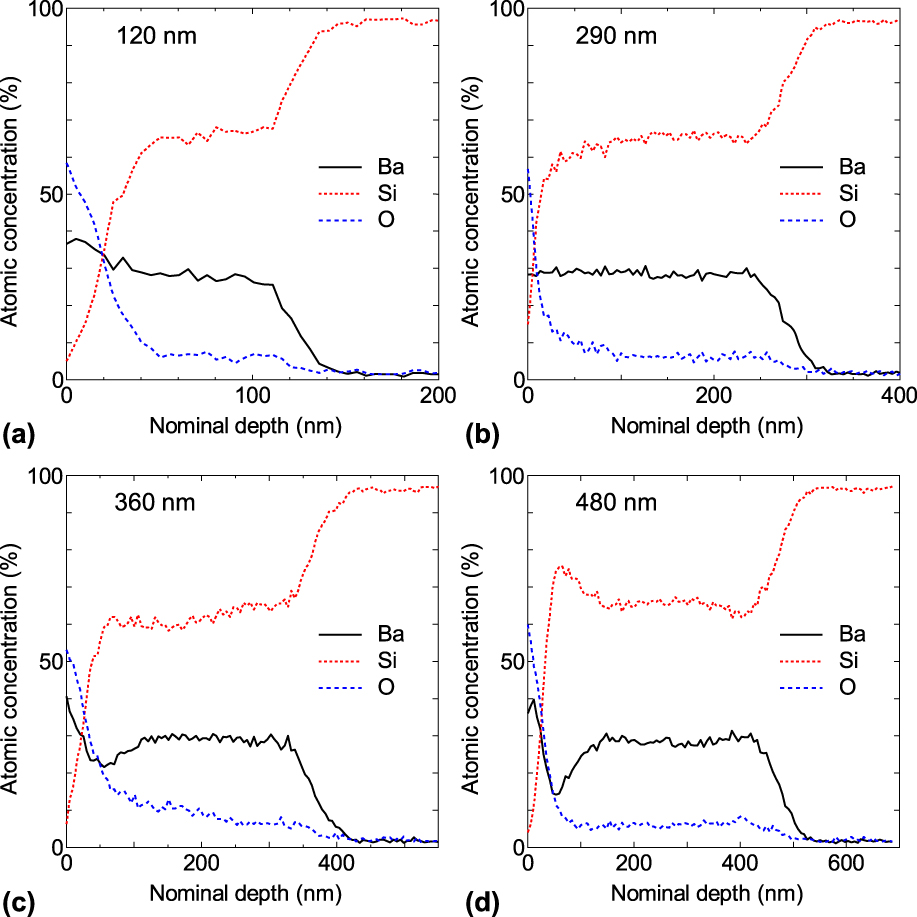
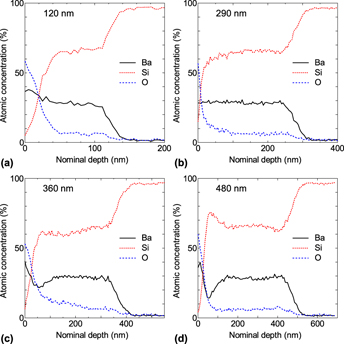
The importance of diffusion for the formation of BaSi2 films has been demonstrated by the above investigation of the T sub effects on composition depth profiles. In this case, it is reasonable to think that w also influences the composition homogeneity because a necessary diffusion length for achieving a homogeneous composition profile increases with the increase in w. Figure 6 shows the AES composition depth profiles of the evaporated films with different w’s of 120–480 nm. These films were deposited at T sub = 650 °C with premelting, and can be compared with the 190 nm film shown in Fig. 1(e). When w is 120 nm [Fig. 6(a)], the composition depth profiles are similar to the case of 190 nm [Fig. 1(e)]. That is, the mutual diffusion of deposited Ba and Si atoms occurred sufficiently and the surface region was oxidized by the residual gas. By contrast, thick films of 360 and 480 nm contain Ba-deficient or Si-rich layers near the surface [Figs. 6(c) and 6(d)], indicating insufficient diffusion for homogeneous BaSi2 formation. Thick films also have thick surface oxide layers, which suggests that BaSi2 layers with composition deviations are easily oxidized upon exposure to air. If the films without enough diffusion are compared (600 °C-200 nm, 650 °C-360 nm, and 650 °C-480 nm), one can notice that oxidation depth increases with the increase in a Ba/Si ratio around the surface. This can be understood from the oxidation resistance of Si and the instability of nonstoichiometric BaSi2. It should also be noted in Fig. 6 that the film with a medium thickness of 290 nm contains neither an insufficiently diffused layer nor a thick surface oxide layer. This tendency has a similarity with our previous finding that the surface oxidation depth can be minimized by postannealing of the optimum duration.Reference Hara, Trinh, Kurokawa, Arimoto, Yamanaka, Nakagawa and Usami28 We can hence conclude that there is the optimum combination of w, T sub, and postannealing period where the deposited atoms sufficiently diffuse and the surface layer is not significantly oxidized.
AES composition depth profiles of the films with different w’s of (a) 120, (b) 290, (c) 360, and (d) 480 nm. T sub was 650 °C. Premelting was performed at 80 A for 8 s irrespective of the value of w.

It is also noted that the film with suppressed surface oxidation without premelting shown in Fig. 1(d) is 280 nm in thickness, almost same as the film shown in Fig. 6(b). The observation of promoted oxidation by introducing premelting [Figs. 1(d) and 1(e)] can therefore be understood by the effect of w. This w effect can also explain a thinner surface oxidation layer when the deposition current is 110 A (260 nm) than when 100 A (190 nm).Reference Hara, Arimoto, Yamanaka, Nakagawa and Usami30 However, it still cannot be understood that a 500-nm-thick film deposited at 650 °C without premelting shows a homogeneous Ba/Si ratio through the film except a near-interface oxidation layer and suppressed surface oxidation.Reference Hara, Yamamoto, Yamanaka, Arimoto, Nakagawa and Usami29
B. Electrical properties
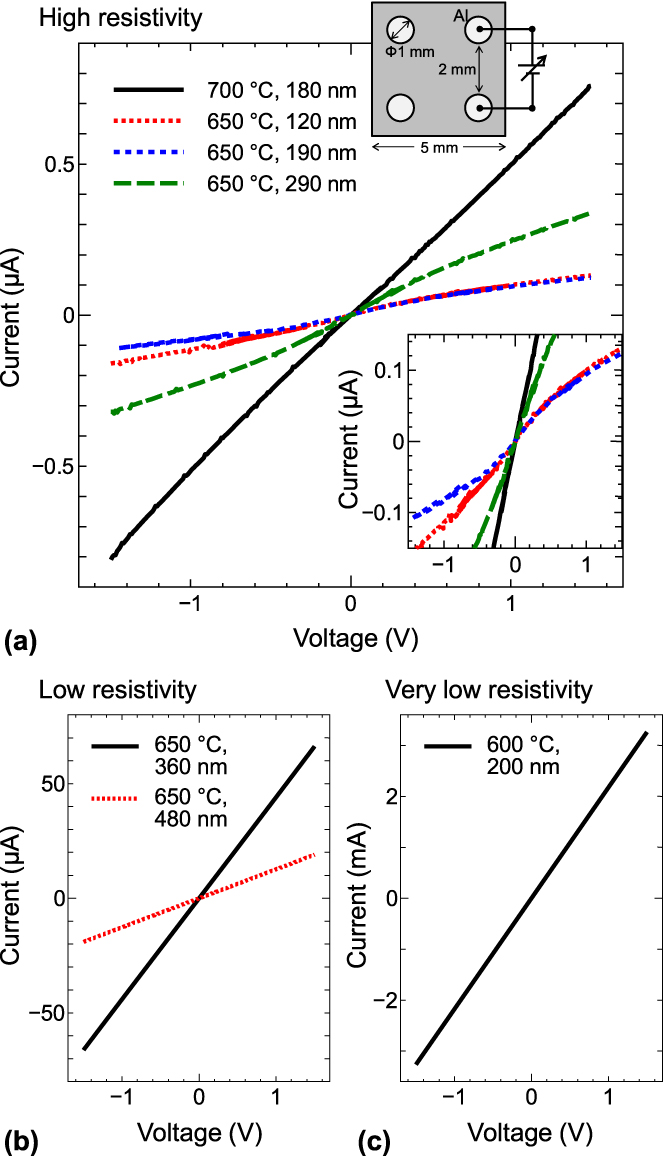
First, current–voltage characteristics between the two Al contacts formed on the evaporated films for the Hall measurement were measured to investigate the tendency of the film resistivity and contact property. The diameter of the Al contacts is 1 mm and the distance between the neighboring contacts is 2 mm. Here, the films deposited at 600–700 °C with premelting were investigated. As a result, the films were divided into high-, low-, and very-low-resistivity ones, as shown in Fig. 7. The inset of Fig. 7(a) shows the graph with a magnified current scale to see the low current region. It is found that the high-resistivity films with thicknesses of 120, 190, and 290 nm show nonlinear characteristics, indicating that the contacts between the Al and the BaSi2 films are Schottky junctions. On the other hand, the films deposited at 700 °C and the other films shown in Figs. 7(b) and 7(c) show almost perfect ohmic characteristics. These results demonstrate that Al/BaSi2 contacts are ohmic when the film resistivity is sufficiently low.
Current–voltage characteristics through the Al contacts on the films deposited at T sub = 600–700 °C with premelting. The data of high-, low-, and very-low-resistivity samples are shown separately in (a)–(c), respectively.

Table I summarizes the resistance (R C) between the two Al contacts and the goodness of linear fit (R 2). The data are listed in ascending order of R C. It is found that the films fabricated without enough diffusion are low resistivity (R C < 105 Ω) while those with enough diffusion are high resistivity (R C > 106 Ω). This result indicates a close relationship between the composition depth profile of the films and the resistivity.
Resistance (R C) between the two Al contacts and the goodness of linear fit to the current–voltage characteristics. All films were deposited after premelting.

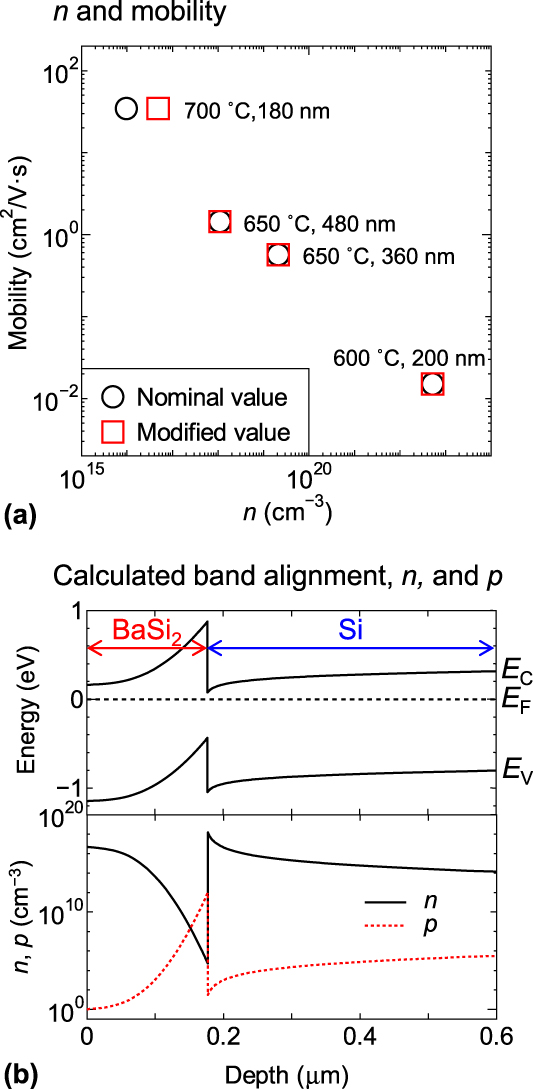
The Hall measurement of the evaporated films revealed that the majority carriers are electrons. n and mobility analyzed by Hall measurement are summarized in Fig. 8(a). The samples with ohmic contacts were used for this plot. Nominal values of n mean the sheet carrier densities divided by w, which are probably not accurate due to the formation of depletion layers.Reference Chandra, Wood, Woodard and Eastman37 Figure 8(b) shows a calculated band alignment and corresponding profiles of n and hole density (p) in the film deposited at 700 °C as an example. Calculation has been performed using the device simulator, wxAMPS,Reference Liu, Sun and Rockett38 which numerically solves the Poisson equation. Free carrier densities were computed by n = N CF 1/2 exp{(E F − E C)/kT} and P = N VF 1/2 exp{(E V − E F)/kT}, where N C and N V are the effective densities of states of the conduction and the valence bands, respectively, F 1/2 is the Fermi integral of order one half, E F is the Fermi level, E C is the conduction band minimum, E V is the valence band maximum, k is the Boltzmann constant, and T is the temperature (300 K). The thickness of the Si substrate was assumed to be 10 μm, which is sufficiently thicker than the depletion layer width. As can be seen in Fig. 8(b), a significant part of the BaSi2 layer can be depleted. We therefore determined more accurate n values so that the computed sheet electron densities can coincide with the experimental ones by trial and error, which are shown as “modified values” in Fig. 8(a). This simulation assumes a perfect interface between BaSi2 and Si, where the diffusion potential is determined by the difference of work functions, which was previously observed for the n-BaSi2/p-Si junction fabricated by MBE.Reference Du, Baba, Toko, Hara, Watanabe, Sekiguchi, Usami and Suemasu39 The junction would, however, not always be perfect. In that case, the accurate n values would fall between the nominal and modified values.
(a) Electron density (n) and mobility of the evaporated films. (b) Band alignment and n and p calculated by the wxAMPS code for n = 5 × 1016 cm−3. E C, E V, and E F denote the conduction band minimum, the valence band maximum, and the Fermi level, respectively.

It should be noted in Fig. 8(a) that the films formed after enough diffusion (700 °C, 180 nm) show low n of 1–5 × 1016 cm−3 while the films without enough diffusion have high n over 1018 cm−3. Although accurate determination of n was not possible for 120, 190, and 290 nm films, their n values are possibly lower than the film fabricated at 700 °C because R C’s are higher, as shown in Fig. 7 and Table I. This tendency suggests that the composition deviation of BaSi2 leads to the generation of electrons, which agrees with the Ba/Si ratio dependence of carrier density in the BaSi2 films fabricated by MBE.Reference Takabe, Deng, Kodama, Yamashita, Sato, Toko and Suemasu13 Since the Si vacancy is the predominant defects in a wide range of Fermi energy conditions under both Si-rich and Si-poor conditions and it can act as a donor, according to the first-principles study,Reference Kumar, Umezawa, Zhou and Imai12 the origin of electrons is possibly the Si vacancy. The low n value of 1–5 × 1016 cm−3 in the film fabricated at 700 °C also agrees with n of undoped MBE films (1015–1018 cm−3)Reference Takabe, Deng, Kodama, Yamashita, Sato, Toko and Suemasu13,Reference Du, Baba, Toko, Hara, Watanabe, Sekiguchi, Usami and Suemasu39,Reference Morita, Inomata and Suemasu40 and n calculated by the first-principles method under the Si-poor condition (1016–1017 cm−3).Reference Kumar, Umezawa, Zhou and Imai12 It is also reported that n of an evaporated BaSi2 film decreases from 5.6 × 1018 cm−3 to 1.9 × 1017 cm−3 by annealing at 1000 °C for 10 min.Reference Suhara, Murata, Navabi, Hara, Nakagawa, Trinh, Kurokawa, Suemasu, Wang and Usami8 The decrease of n from 1022 cm−3 to 1017 cm−3 with increasing T sub from 400 to 600 °C is also reported.Reference Trinh, Nakagawa, Hara, Takabe, Suemasu and Usami5 These results indicate that the BaSi2 films with low n below 1017 cm−3 can be fabricated by thermal evaporation when the system reaches close to equilibrium after enough diffusion.
Figure 8(a) also shows a decreasing trend of mobility as a function of n. This trend agrees with that observed in the impurity-doped BaSi2 films fabricated by MBE, which have been interpreted as ionized impurity scattering.Reference Kobayashi, Matsumoto, Ichikawa, Tsukada and Suemasu14,Reference Khan, Saito, Nakamura, Baba, Du, Toh, Toko and Suemasu15,Reference Ajmal Khan and Suemasu21 In this study, however, intentional impurity doping has not been performed. Since the origin of electrons in the BaSi2 films is presumably point defects such as Si vacancy without impurity doping,Reference Kumar, Umezawa, Zhou and Imai12 the films with higher n values probably contain a higher density of point defects. The decreasing trend of mobility is, therefore, possibly owing to the scattering due to point defects. This observation supports the hypothesis that the carriers originate from Si vacancy.
IV. CONCLUSIONS
Through the composition profile analyses, structural characterizations, and electrical investigations of the BaSi2 films deposited at RT−700 °C by thermal evaporation, we comprehensively revealed the mechanism of BaSi2 film formation and its relation to electrical properties. The composition of the vapor generated from the BaSi2 melt changes continuously from being Ba-rich to being Si-rich during thermal evaporation, as evidenced by the composition depth profiles of the films deposited at RT. Source premelting has been proven to suppress the deposition of initial Ba-rich vapor. By promoting the diffusion of deposited atoms by increasing T sub, BaSi2 forms through the mutual diffusion of Ba and Si. Superfluous diffusion promotes surface oxidation by the residual gas in vacuum. The oxidation thickness is lowered when the film is epitaxial, which has been shown by SEM and XRD results. With the optimum combination of T sub and w, where the diffusion length of deposited atoms would be necessary and sufficient, a homogeneous BaSi2 film with suppressed oxidation is obtained. The film resistivity is significantly low when the diffusion is not sufficient probably because of composition deviation. One of the high-resistivity films has been shown to have a low n of 1–5 × 1016 cm−3, which is significantly lower than other films without enough diffusion (>1018 cm−3). The present findings provide us the guides to fabricate homogeneous BaSi2 films with controlled electron density for solar cell applications.
ACKNOWLEDGMENT
This work was partly supported by JSPS KAKENHI Grant Nos. JP16H03856 and JP17K14657.