Introduction
This paper considers the socioeconomic status and the economic future of Nunavik, the northern region of Québec. This vast region covers 500 000 km2 with a population of 12,090, 88.7% of whom are Inuit. Nunavik has some form of autonomy through regional institutions of governance but is almost totally dependent on government transfers, like many other Inuit regions of Canada. However, with the announcement of ‘Plan Nord’ and more recently ‘Nord pour tous’ following a renewed interest in mining in Nunavik, the region could face new opportunities but also important challenges. This could provide a threat to a region in which communities have long lived sustainably. Development plans designed from Québec city have not, however, offered a long term sustainable development vision, which is so crucial for the sustainability of livelihoods in this region.
It was not until the late 1980s with the World Commission on Environment and Development (also referred to as the Brundtland Commission) that a debate about sustainable development began to emerge. In 1987, the commission published a report entitled Our common future, in which it defined sustainable development as ‘development, which meets the needs of the present generation without compromising the ability of future generations to meet their needs’ (Chance and Andreeva Reference Chance and Andreeva1995: 221). Various models of sustainable development have been developed since. The models, however, ‘remain conceptual frameworks. . .that lack the specificity and precision necessary for application’ to regional and community sustainable development (Collados and Duane Reference Collados and Duane1999: 442). Moreover, the sustainable development literature often overemphasises two pillars: economic growth and environmental (ecological) degradation (Chance and Adreeva Reference Chance and Andreeva1995: 222). For example, in the case of former Plan Nord, sustainability was solely defined as the protection of 50% of the territory. Yet, there is a growing body of literature that also pays attention to the importance of the social and cultural dimensions of sustainable development. This is especially crucial for indigenous peoples, for whom cultural and social values need to be addressed to promote sustainable development in their communities.
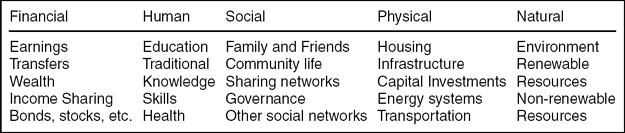
The literature suggests different models of sustainable development for regions and communities. These models generally focus on the preservation of different forms of capital such as human, social, financial, and natural capital. Some authors point out the incorporation of social and cultural practices (that will ensure the fulfillment of the local people's needs) into sustainable development strategies (Pretty Reference Pretty2003; Dale and Newman Reference Dale and Newman2006; Ulluwishewa and Roskruge Reference Ulluwishewa, Roskruge, Harmsworth and Antaran2008; Crate Reference Crate2006; Fisher Reference Fisher2008; Humphreys Reference Humphreys2002). Others emphasise the inevitability of protecting natural capital in order to succeed in sustainable community development (Collados and Duane Reference Collados and Duane1998). Table 1 presents the five capitals most commonly used in assessing sustainability that we adapted to the Nunavik context. Sustainable development has to address all five types of capital.
Areas of capital to consider for sustainable development in Nunavik

Reductions in natural capital such as the extraction of non-renewable resources might enhance physical and financial capital but could also affect human and social capital, particularly in mixed economies like Nunavik. A sustainability concept tries to understand and measure these long-term impacts on crucial capitals that sustain the livelihoods of communities.
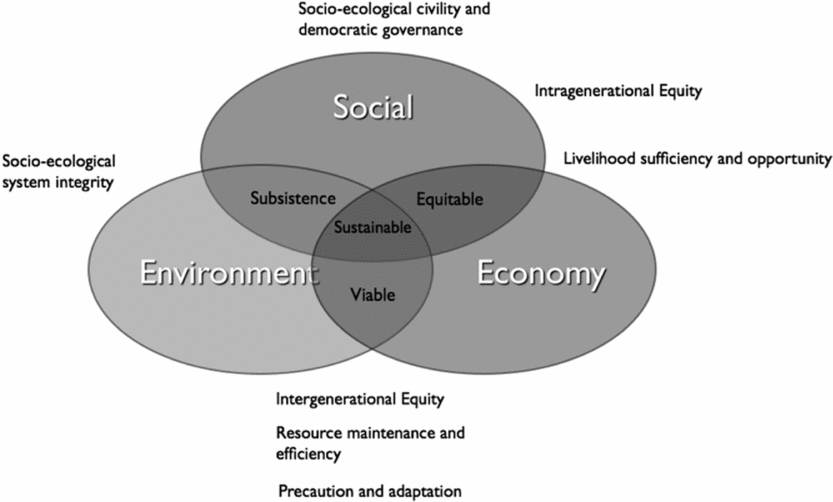
The main weakness of many definitions of sustainability is the lack of objective criteria to put it into operation. Gibson (Reference Gibson2006) has developed a sustainable assessment framework that has been used in assessing Voisey's Bay Mine and in the Mackenzie Gas Project joint review. The framework suggested by Gibson is location-dependent with a feedback loop that encourages endogenous learning and adjustment of objectives and assessments. Key considerations depend on the particulars of the local ecosystems, institutional capacities and public preferences. Implementation of a sustainability framework only works if sustainability-based criteria are at the centre of decision-making, not a side objective or consideration. Actors must actively engage in learning, monitoring and a feedback process in which they specify sustainability decision criteria and trade-off rules for their specific context. Gibson (Reference Gibson2006) identifies core criteria for sustainability assessments, which we illustrate in the context of the sustainable development framework in Fig. 1.
Sustainable development assessment based on core principles identified by Gibson (Reference Gibson2006).
This framework stresses the importance of socio-ecological system integrity, which requires the building of stable human–ecological relations and the protection of irreplaceable life support functions upon which human and ecological well-being depends. The system has to be able to provide enough for everyone for a decent life. It must also enable everyone with choices and opportunities to seek improvements in ways that do not compromise the possibility for future generations to secure sufficiency and opportunity. Resources and the environment have to be maintained and disturbances should be minimised in order to ensure the long-term integrity of the socio-ecological system. One necessary condition is to ensure there is no reduction of total wealth (consisting of natural, physical, financial, social and human capital identified in Table 1), and that socioecological systems can be sustained. The institutions that govern the socio-ecological system also need to be sustained, which requires capacity, informed deliberations, willingness to respect uncertainty and managing for adaptation. This corroborates the findings from the Harvard Project on American Indian Economic Development. This project had the objectives of understanding the conditions that will favour a self-determined social and economic development for American Indians. They found out that four conditions were at the core of a self-determined development: capacity to make independent decisions in terms of development, institutional capacity in order to create informed decision-making and trust, cultural grounding and finally, leadership (Jorgensen Reference Jorgensen2007). All those conditions relate mostly to the political realm showing that economic development is not primarily a question of access to resources.
The purpose of this paper is to examine the elements of a sustainable development strategy for Nunavik. This is indeed a pressing question at a time when mining interests and the Province of Québec want to develop northern resources. In our paper we look back in history and at the data we have so far collected for Nunavik to understand better what a sustainable Nunavik could entail. Our data analysis in this paper indicates that the Nunavik region is far from being sustainable. However, regional initiatives like the Kuujjuaq Economic Forum and Plan Nunavik (KRG and Makivik 2012) are striving to put the region on a more sustainable path. We discuss insights from the forum in Kuujjuaq in 2010 and, together with our findings from the available data on Nunavik, put forward components of a sustainable development model for the region (Fig. 2).
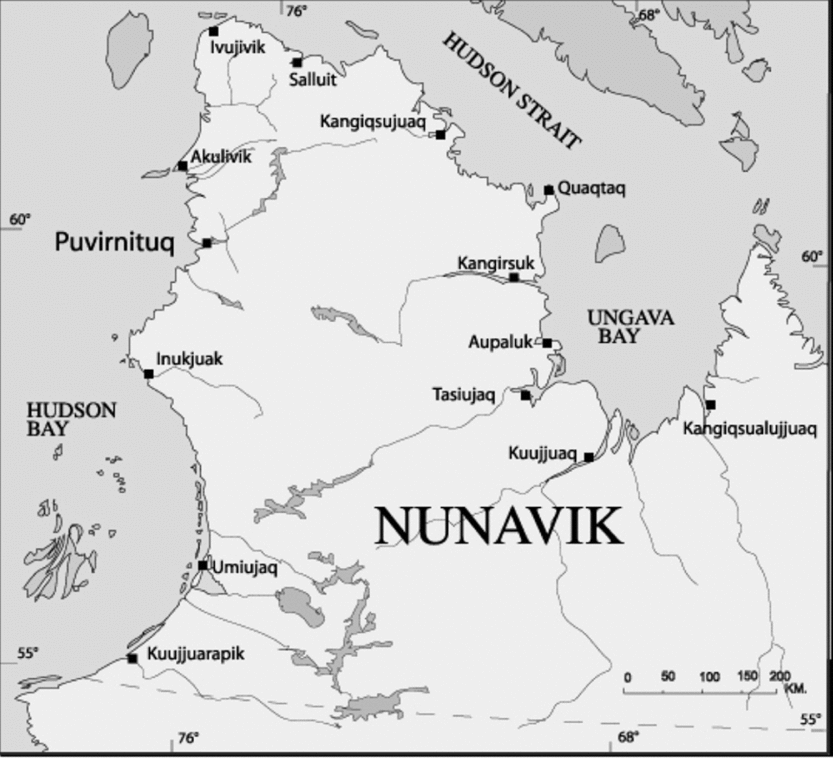
Map of Nunavik, courtesy of Makivik Corporation.
A brief history of sustainability in Nunavik
Pre-contact and fur trade
In order to survive in the Arctic environment, Inuit communities were sustainable by definition. Activities were conducted in such a way as to ensure the long-term viability of individual communities and the environment they relied on for sustenance. This was the case with most hunting and gathering communities since they depended on the quality of their environment and social networks to flourish. The sustainability of Inuit society was based on hunting, fishing and gathering and on social networks that ensured efficiency, role sharing between the sexes and generations, and redistribution among kin and community. Land-based activities were not only economic activities, but contributed to reinforcing social capital through exchange. They also helped strengthen Inuit values and culture.
Early contact with Europeans through the fur trade introduced new products and some market activities but did not alter the sustainability of Inuit communities, since it encouraged land-based activity and left Inuit culture and social networks intact. However, it did signal the birth of a mixed economy with an influx of cash generated by the trade. The policy of the government of the time toward the Inuit was to ‘let natives be natives’ and only intervene to maintain Canadian law and order. However, this drastically changed in the 1950s with a redefinition of the role of the state.
The welfare state and the James Bay and Northern Québec Agreement (JBNQA)
In Canada, the welfare state emerged after World War II, when post-war prosperity allowed the state to redefine its role and become a direct provider of healthcare, education and social welfare services. During this same period, famine in some Inuit regions made national headlines. The conjunction of these two factors led to a change in northern policy as the government decided to intervene directly in the life of the Inuit by providing services to the Inuit communities (Bonesteel Reference Bonesteel2006). This change in policy had an enormous impact on the sustainability of Inuit communities at the economic and social level. Two processes mainly caused the negative impact: resettlement in permanent communities and the generalisation of social transfer payments (Duhaime Reference Duhaime2003).
Relocation to permanent settlements, mandatory schooling and the slaughter of sled dogs undermined land-based activities, forcing Inuit hunters to travel farther to find game and depriving them of their main means of transportation. Snow machines quickly replaced dog teams, but this change had a profound impact since the use of snow machines was capital intensive and required financing through earnings in the market economy. Hunters now needed cash to buy the equipment necessary to hunt. They could no longer live entirely off the land, but instead had to find money from outside sources. Even though the cash economy had been introduced earlier during the fur trade period, cash was only a supplement to the land-based economy and a hunter could always go out on the land even if he had no income. This was no longer the case after the move to permanent settlements (Duhaime Reference Duhaime2003).
Government transfer payments were also introduced during this period. Access to money became easier, compounding the challenges to the land-based economy. Transfer payments have greatly undermined the Inuit exchange network by providing a means of subsistence independent of the local environmental and social networks. From this point on, sustainability was no longer defined solely in terms of access to local resources and the strength of community and social networks, but was also tied to the global economy, essentially through government transfers, and later through employment (Martin Reference Martin2003). It should be noted that in two separate initiatives, the federal government in Kangiqsualujjuaq and an Oblate priest in Puvirnituq tried to develop an alternative economy through the creation of local co-operatives. This movement started in the 1950s and was based on an effort to market local resources (arctic char and Inuit art) in order to create employment and access to cash. The co-operative movement was consolidated in the sixties and has evolved to provide a wide range of services in all the Inuit communities of Nunavik (Tulugak and Murdoch Reference Tulugak and Murdoch2007).
The James Bay and Northern Québec Agreement (JBNQA) signed in 1975 accelerated the pace of Inuit integration into the welfare state and has profoundly transformed the institutional setting of the region. The agreement put into place three regional institutions: the Kativik Regional Government (KRG), a supra-municipal government, the Kativik School Board (KSB) and the Nunavik Regional Board of Health and Social Services, in charge of delivering services to the region. These institutions are still the main employer in Nunavik today. The JBNQA has also created a land claims administration with Makivik Corporation, which represents Inuit interests and manages the funds transferred to Inuit under the JBNQA and the Landholding Corporations.
Yet despite some improvements in the quality of life, a study on the impact of the JBNQA (Papillon Reference Papillon2008) has clearly shown that the Nunavik Inuit are not significantly better off than other northern aboriginal communities:
The living conditions of the Crees and Inuit have certainly improved in the past 30 years, but comparative data suggest that they might well have improved without the JBNQA. In fact, the state of Cree and Inuit communities under the JBNQA is today only slightly better than or comparable to that of similar Aboriginal communities in other northern regions of the country — and, treaty or no treaty, Aboriginal peoples in Canada, and especially those in northern regions, endure far more difficult living conditions than non-Aboriginal Canadians (Papillon Reference Papillon2008: 18–19).
What do we know about the Nunavik Economy?
Sustainable development needs to consider the impact of development on the change in national or regional wealth that consists of five identified sources of capital (see Table 1). A minimum set of identified sustainable development indicators for the Arctic have recently been suggested by Ozkan and Schott (in press). The latter refine the Arctic social indicators currently proposed by the Arctic Human Development Report (AHDR) (AHDR 2004; Larsen and others Reference Larsen, Schweitzer and Fondahl2010) and add the two domains of Natural Resource and Environmental Sustainability and Community Vitality. We will discuss the available data for Nunavik by capital type in the context of relevant categories for the Arctic as identified by Ozkan and Schott (in press). Since Nunavik is a region of a sub-region of the province of Québec only limited data is specifically available for Nunavik. Additionally Nunavik consists of several small remote communities with a large Inuit population that has retained its use of Inuktitut remarkably well. This makes it more difficult and costly to generate reliable data, particularly time series data. From the limited data that exists we can deduce some potential concerns about the current development of the region, but we have to interpret the results carefully. There is a definite need for a more consistent and accurate data collection in order to ensure that the region follows the right development paths and does not fall further behind the rest of the province, Canada and other Arctic areas. Most of the data presented here is available at www.nunivaat.org.
Financial capital and living standards
GDP, income and sector-specific performance
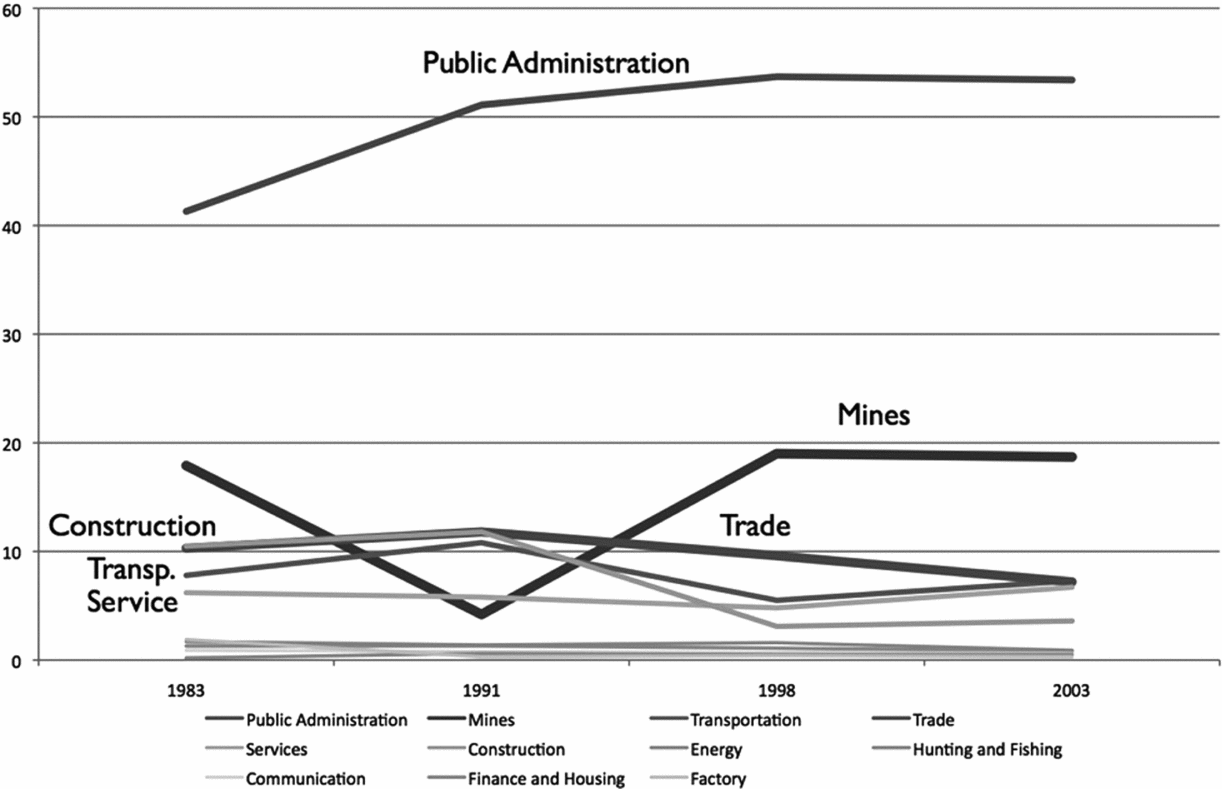
The method and the data used to calculate GDP and other aggregates, such as personal disposable income, are described in Duhaime and Robichaud (Reference Robichaud2007). As discussed in this study, some of the data sources are not completely reliable. However, these data on GDP and other aggregates in Nunavik are the only ones available. First there are only two observations for GDP, one for 1998 and one for 2003. The GDP per capita increased drastically between these two years at an average annual rate of 12.5%. The growth by sector is illustrated in Fig. 3. More than half of the GDP comes from public administration, followed by mines, trade and transportation and the service sector. Most of the jobs are in the public services (54.9%) according to Kativik Regional Government 2006). Two thirds of investments were, however, made by the private sector in 2005 (Kativik Regional Government 2005). The mining sector experienced the largest volatility. The construction sector was strong until 1991, then significantly declined and has never recovered to previous levels.
Sector-specific growth in the Nunavik economy based on data from (Duhaime Reference Duhaime2008).
Disposable income
Personal disposable income increased by 10.1% on average (slightly below the increase in GDP per capita) between 1998 to 2003. The growth rate is higher than in the rest of Québec, but only if we take non-residents into account. It is actually lower than in the rest of the province if calculated for residents only. The trend is somewhat alarming given the high cost of living in the north. However, it does not include food and other resources gained through land-based activities. The proportion of income coming from public transfers has steadily increased, while the proportion coming from employment income is declining (Duhaime Reference Duhaime2008).
Labour market and employment
Nunavik has a mixed economy that consists of wage-based employment as well as traditional land-based economic activities. All the reported figures in this section relate to the wage economy. The number of full time jobs in the wage economy increased by 82.5% from 1995 to 2005 (Kativik Regional Government (2006)). A closer look at employment reveals, however, that the percentage increase in jobs held by non-Inuit was greater than the rate of increase for Inuit (Kativik Regional Government (2006)). The percentage increase in jobs held by women was also greater than that for men. Unemployment and the labour participation rate increased between 1996 and 2001 according to census data. The latest figures based on the 2006 census indicate that the labour force participation rate among Inuit males and females in Nunavik is about the same as for the male aboriginal population in Québec. Aboriginal female labour participation in Nunavik is 8% higher than in the rest of Québec. The unemployment rate in Nunavik among aboriginals is, however, higher for both males and females than in the rest of the province. Particularly Inuit males in Nunavik had a very high unemployment rate of 23.6% in 2006.
Human capital and population health
Demographics and population growth
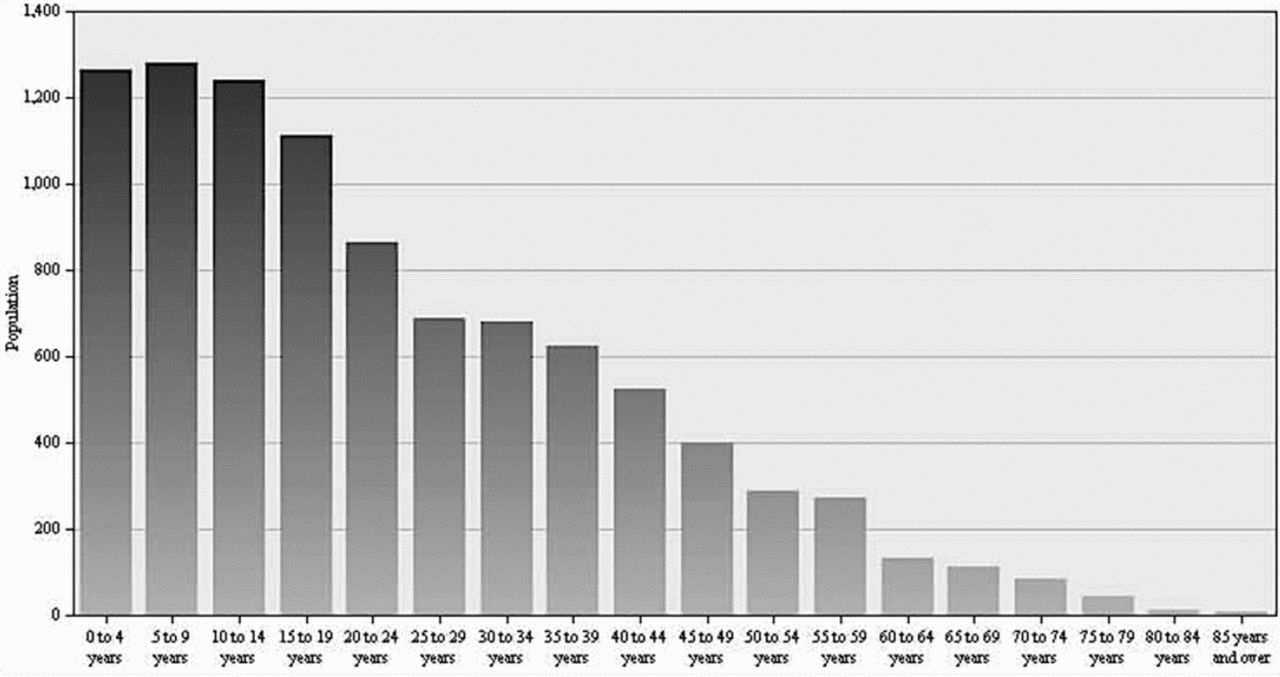
The population of Nunavik according to the 2011 census was 12,090, 88.7% of whom were Inuit (based on the 2006 census). The area experienced rapid population growth from 1971 to 2011, but growth has recently slowed down. The average population growth rate between 1961 to 2011 was approximately 7.85% based on census data (1961, 1966, 1971, 1981, 1991 and 2001, 2006, 2011). The population is relatively young with 36.1% being between 0–14 years of age in 2006 (Institut de la Statistique du Québec (2008)) and a median age of only 19.6 years. This puts pressure on providing adequate jobs, particularly for young people, appropriate education that is meaningful, and effective and increased involvement of the youth in traditional land-based activities (Fig. 4).
Age characteristics of the aboriginal identity population (Statistics Canada 2006 Census).
Education
Two types of education are of crucial importance. The first type is the conventional western (or southern) type associated with years of schooling in primary, secondary and post-secondary institutions. This is measurable to some extent for the region of Nunavik. Total school enrolment in Nunavik increased by 14.9% from 1995 to 2005 (Duhaime (Reference Duhaime2008)). Although this is promising, 68.1% of the Inuit population 60 or older reported no schooling (Bernard Reference Bernard2005), 52.8 % of the population aged 20 to 64 had less than high school in 2006 (Census 2006) and 62.9% of the population of 15 to 24 year olds did not attend school in 2001, which is double the provincial rate (Institut national de santé publique du Québec (2006)). The other type of education not commonly measured is the rate of transfer of traditional knowledge. The latter is more challenging to quantify because it is mostly orally transferred and is not formally organised. We can make some links to harvesting data (see the section on social capital) that indicates that Nunavik is a region where hunters are the most active in the Canadian Arctic. There is, however, a downward trend in harvest participation per capita and more concentration of effort by fewer hunters (similar to observations in other indigenous areas of the Arctic). The oral transfer of traditional knowledge is, however, a very important type of education as well that sustains immediately relevant knowledge for survival, social stability and cultural identity.
Life expectancy at birth
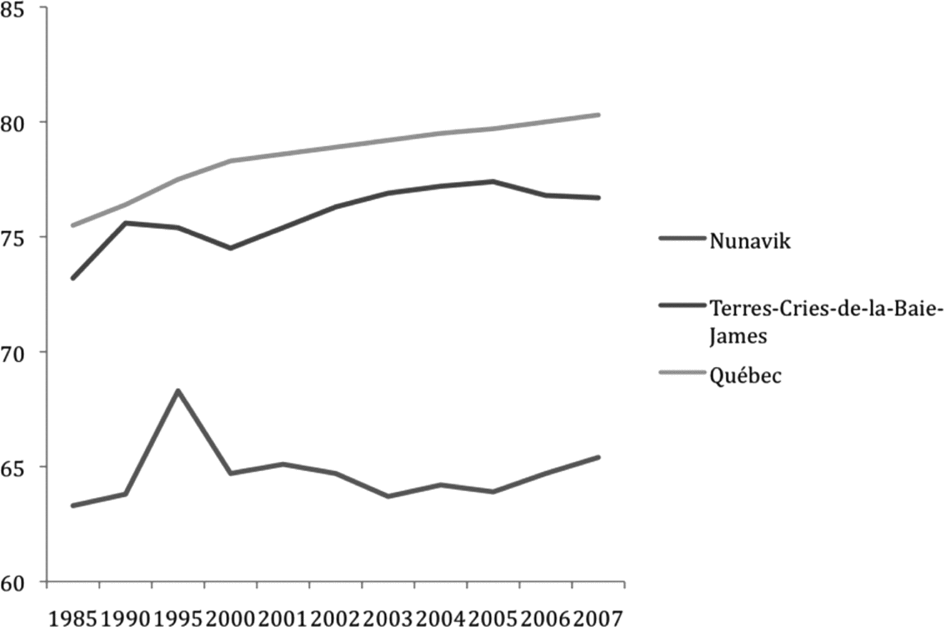
Despite strong economic growth rates and increases in personal disposable income, data on life expectancy at birth tells a different story. Life expectancy at birth declined from 1995 until 2003 (see Fig. 5), and recently has risen slightly. In comparison to the rest of Québec, life expectancy at birth is on average 15 years lower and 12 years lower than in the neighbouring region of Terres-Cries-de-la-Baie-James. This is in stark contrast to previous data on economic growth.
Life expectancy at birth, years (Eco-Santé Québec (2008) Life expectancy at birth, at age 65 and 75, according to sex, regions and Québec, 1985, 1990, 1995, 2000–2007. Table 2008-11-12-2)
Infant mortality
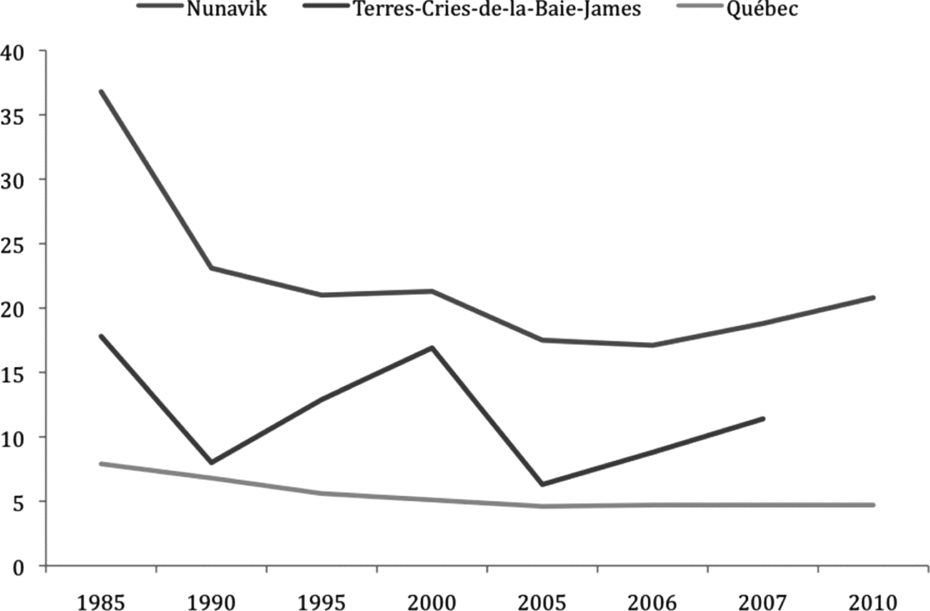
Infant mortality rates have improved since 1985 but are still approximately 4 times above provincial standard and twice as high as in the neighbouring Terres-Cries-de-la-Baie-James region (see Fig. 6). Although infant mortality in the province of Québec has been steadily declining and is stabilising at around 4.7 deaths per 1000 life births, the rate has slightly risen in Nunavik over the past few years. This should be a concern, as it is an indicator of a decline in living standards and social well-being.
Infant mortality per 1000 live births. (Eco-Santé Québec (2008): Infant mortality according to the component, province of Québec and regions, 1985, 1990, 1995, 2000 and 2005 to 2007, regional level, Table 2008-11-13-2 and Nunavik health profile (2012), 2010, regional level. Table 2012-04-08-7).
Chronic diseases
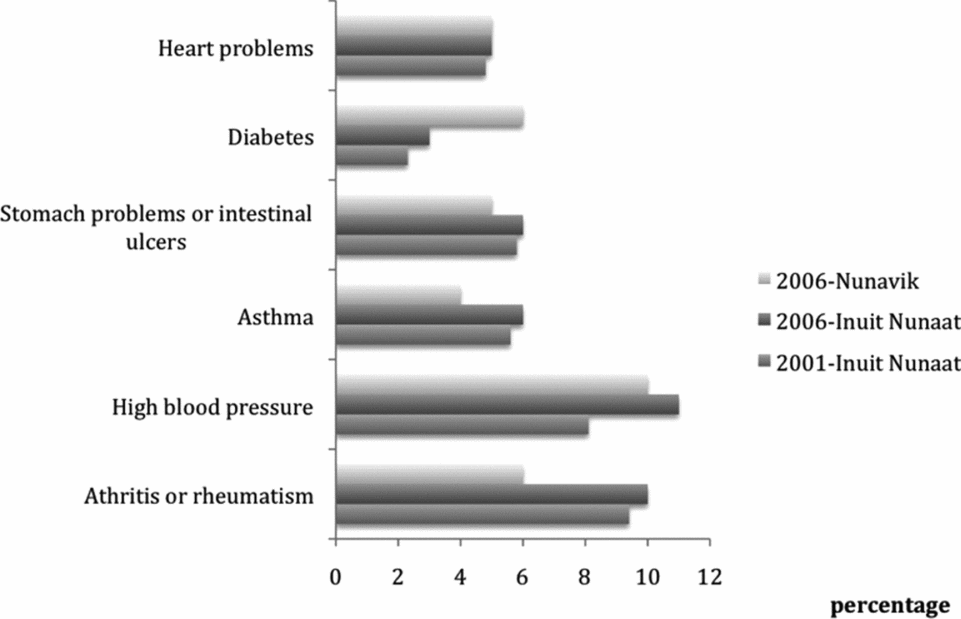
Chronic disease data for Nunavik is limited. We have observations from 2006 specifically for Nunavik and 2001 data for all of Inuit regions in Canada. The data indicates that the incidence of heart problems neither improved nor worsened. Nunavik has the same incidence rate as all of Inuit Nunaat. Diabetes rates have, however, increased all across the Arctic and are particularly high in Nunavik in 2006. Stomach problems, arthritis and asthma rates are lower in Nunavik than in the rest of Inuit Nunnaat in 2006. The proportion of Inuit that were diagnosed with high blood pressure increased by 35% from 2001 to 2006. The limited data set confirms some of the concerns about Inuit dietary changes. Diabetes, blood pressure and heart problems are rising as Inuit consume more processed food instead of relying on country food. The latter were virtually non-existent before the settlements of the 1950s. It is also an indication of the need for better nutritional education (Fig. 7).
Suicide
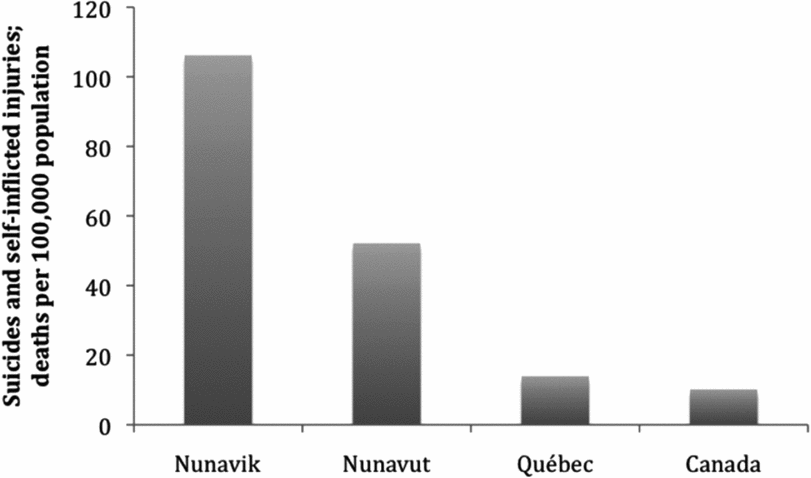
Nunavik's suicide rate is by far the highest in Canada. It is more than ten times the national average and twice as high as in Nunavut. This could be a clear indication of dissatisfaction with lifestyle in Nunavik. Although there is no life satisfaction data or individual well-being data for Nunavik, suicide data can act as an indicator of happiness and well-being (Helliwell (Reference Helliwell2006)). Suicide data consistently tell the same story as life satisfaction data. This should be a major concern for the socioeconomic development of Nunavik (Fig. 8).
Suicide rates in Nunavik, Nunavut, Québec and Canada (Statistics Canada. 2011. Health profile. Statistics Canada catalogue no. 82–228-XWE. Ottawa. Released 28 June 2011)
Addiction
We examined data on legal drugs such as alcohol consumption and smoking. The percentage of active daily smokers is approximately 3 times higher than in the rest of Québec. The same ratio applies to the percentage of individuals that report heavy drinking once a week or more (Institut National de Santé Publique du Québec and others 2007).
Physical capital
Housing
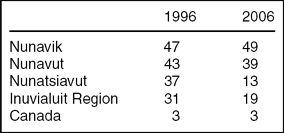
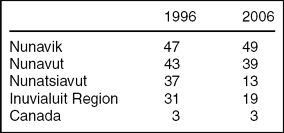
The majority of houses in Nunavik are rented (96.5% of the houses in 2006 according to census 2006). The percentage of dwellings that require major repairs increased from 8–9.7% in 1996 to 35–46% in 2006 (Census 1996, 2006; Statistics Canada 1998, 2008). There is also a slight increase in crowded dwellings (more than one person per room (see Table 2)). The situation for the Inuit population in Nunavik is not improving, while it is considerably improving in Nunatsiavut and slightly improving in Nunavut.
Percentage of the Inuit and non-Aboriginal populations living in crowded dwellings, Canada and Inuit regions, 1996 and 2006
Sources: Statistics Canada, censuses of population, 1996 and 2006.
Energy
Each community depends on diesel powered local electricity generation.
Transportation
There are no road links between the Nunavik communities and communities to the south. Nunavik is completely dependent on sealift (July to September) and air transportation. Community airport infrastructure is, however, deteriorating and requires major investments (Plan Nunavik 2012). In addition there is no public transportation within communities.
Social capital
Access to country food
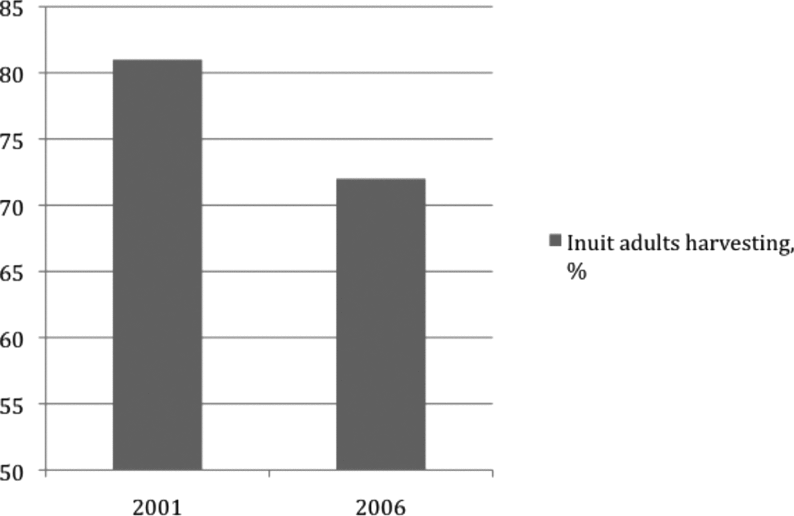
There is very little data on the traditional subsistence economy in Nunavik. The only available information is provided by the hunter support programme, which covers only a small proportion of land based activity (Chabot Reference Chabot2003). A recent study conducted in Nunatsiavut has shown that the level of per capita harvesting as measured in 2005 is similar to the 1979 numbers (Natcher Reference Natcher2009). This means that the mixed economy is an enduring economic system that has been able to survive the tremendous changes that have occurred in northern Labrador. The only data for Nunavik comes from the survey on living condition in the Arctic (SLICA) conducted by Statistics Canada in 2001. It does not provide any information on the harvest but it collected data on the number of adults harvesting country food and shows clearly that Nunavik is the Inuit region where harvesters are the most active, this could suggest some degree of traditional knowledge transmission. There is, however, a downward trend in the participation of harvesting country food. In 2006, almost 10% less of the population engaged in harvesting activities compared to 2001 (Fig. 9). During the socio-economic forum that was held in Kuujjuaq in 2010 it was proposed to conduct a study on harvesting similar to the one held in Nunatsiavut (Felt and Natcher Reference Felt, Natcher, Natcher, Felt and Procter2012). This study would permit better understanding of the role, value and dynamics of the land-based economy in Nunavik.
Harvesting country food in the previous year, Inuit adults aged 15 and over, Nunavik, 2001 and 2006 (2006 data: Statistics Canada (2008) Aboriginal peoples survey, 2006: Inuit health and social conditions supporting data tables. Catalogue no. 89-637-X. 2001 data: Statistics Canada (2006) Harvesting and community well-being among Inuit in the Canadian Arctic: Preliminary findings from the 2001 Aboriginal peoples survey - Survey of living conditions in the Arctic 2001. Catalogue no. 89-619-XIE).
Crime rates
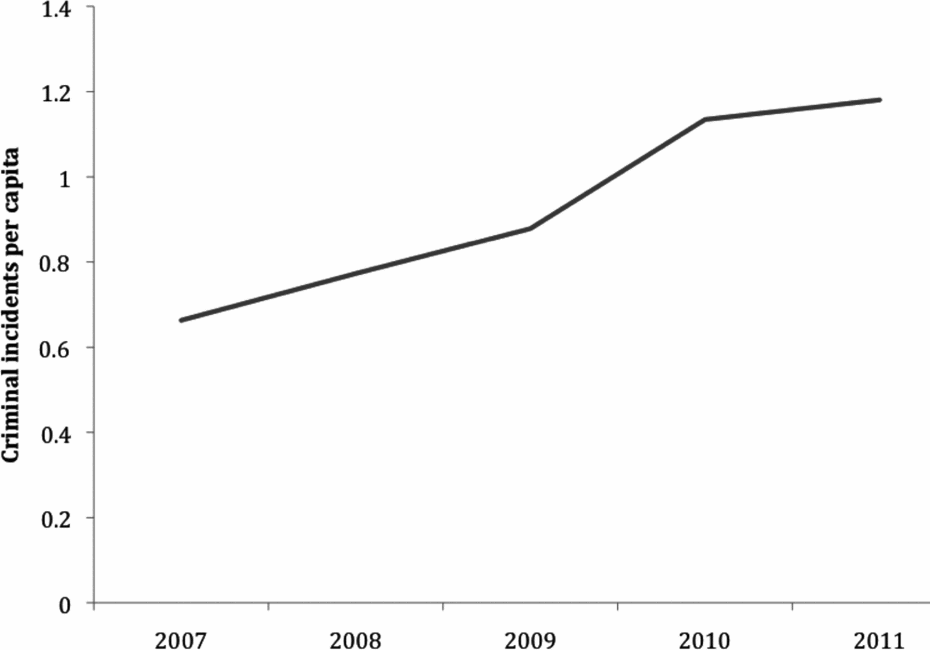
Recently published data on total police interventions and criminal incidents indicate a rapid increase. The criminal incidents per capita also significantly increased between 2007 and 2011 (Fig. 10). This is an alarming development that creates tensions in communities and negatively impacts community well-being.
Criminal incidents per Capita 2007–2011. (Total police interventions by categories and villages, 2007–2011, table 2010-06-08-1, Kativik Regional Police Force, Statistics Canada Census 2006, 2011).
Natural capital
Essential wildlife resources
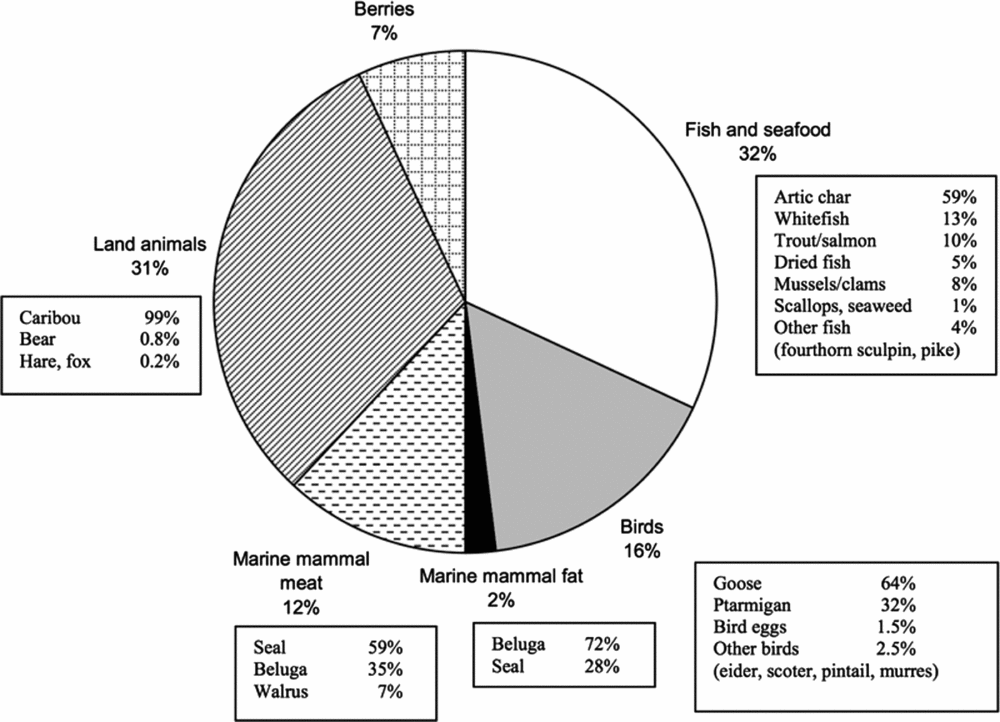
Natural capital in Nunavik is crucially linked to social capital. Without adequate wildlife resources, clean rivers and access to water and energy resources the traditional sector cannot sustain itself, especially with the population growth Nunavik is experiencing. The harvest of country meat is essential for providing a healthy diet for Nunavimmiut, and also to keep people connected with their land and culture. In addtion hunting is a healthy activity that keeps people fit and gets them outside of crowded dwellings. Nunavik, therefore, requires a critical natural capital that can provide for the basic needs of a strongly growing population. An overview of the main sources of country food is presented in Fig. 11. Among the land mammals caribou meat is by far the most desired and staple food item. Seal and beluga meat are important marine mammal food sources and beluga blubber is also the most important source of omega 3 fatty acids. Arctic char is the most important source of fish and seafood and goose is the most important game bird.
Distribution of country food a year before the 2004 Nunavik Inuit health survey. Source: Institut national de santé publique du Québec and Nunavik regional board of health and social services (2007).
Caribou stocks
As Fig. 11 illustrates caribou meat is one of the most important sources of country meat. Nunavik has access to two historically significant migratory herds: the George River and Leaf River herds. Both herds are unfortunately in decline. The Ministère des Resources naturelles (MRN) carried out a survey in July 2012, in partnership with organisations in Newfoundland and Labrador. The total herd population was estimated at approximately 27,600 animals, which is only one third of the previous estimate in 2010 that indicated 74,000 animals. This herd was at a peak-estimated size of 776,000 animals in 1993 and at an estimated size of 385,000 in 2001 (Gunn and others Reference Gunn, Russell and Eamer2011). The Leaf River herd is also declining from a cautious estimate of 623,000 animals in 2001 to 430,000 (± 98,000) in 2011. Although there is uncertainty in the reliability of estimates this is an alarming trend.
Beluga stocks
Communities in Nunavik harvest from what is estimated (from genetic analysis) to be three different populations: The Western Hudson Bay (WHB) population, The Ungava Bay (UB) population and the Eastern Hudson Bay (EHB) population. In 2004, the Committee on the Status of Endangered Wildlife in Canada (COSEWIC) recommended that the Ungava Bay (UB) and eastern Hudson Bay (EHB) population be listed as endangered. Based on the latest Science Advisory Report (DFO 2012), the EHB is strongly skewed towards younger individuals. The proportion of animals under 10 years of age was two times larger than in other populations, which is a concern for a species that becomes sexually mature between 8 and 14 years with a longevity of 60+ years (DFO 2012). DFO is advocating the use of area closures, controlled season and regional quotas. The current limit of around 50 EHB animals per year leaves a 50% probability of causing a decline in the population. As opposed to Nunavut communities on the western side of Hudson Bay, Nunavik communities are constrained by community quotas. In addition Nunavik beluga hunters can travel to James Bay and Hudson Strait to harvest shared stocks with other communities. The latter is, however, more costly and creates logistical challenges in bringing meat and other by-products back to communities.
Other significant wildlife resources
Arctic char and seal populations do not show the distress of caribou and beluga stocks that are in the vicinity of Nunavik communities. Nunavik residents might, therefore, take up Arctic char and seal meat but this might impose strain on those populations. In addition most Nunnavimmuit prefer caribou meat to seal meat. A shift away from beluga and caribou meat to more processed and southern replacement sources would probably worsen nutrition and health, and jeopardise transfer of knowledge and local knowledge generation in the harvest, assessment and allocations of caribou herds and beluga stocks.
Change in environmental conditions
The permafrost warming recorded in Nunavik in the 20th century was 3 times faster than average global warming (Transports Québec 2012). However, recent climate fluctuations since the late 1980s have been even faster. Nunavik recorded a temperature rise of about 3.5°C from 1990 to 2007, 5 to 7 times faster than the average global increase during the same years according to the Intergovernmental Panel on Climate Change (Transports Québec 2012). Permafrost thaw, therefore, is influencing the integrity of certain road and airport infrastructures in Nunavik, and is increasing the risk of landslides in some areas (Transports Québec 2012). This will seriously limit future economic development plans that require better transport infrastructure. It will substantially increase the cost of roads and airport runways and will require retrofits to houses that are mainly built on permafrost.
Energy sources (renewable and non-renewable)
Nunavik's electricity comes form 14 diesel power plants (one in each community). In addition heating for houses is supplied by oil. Nunavik, therefore, depends 100% on fossil fuel supplies from the south that are very expensive and are steadily increasing in price. This is clearly not sustainable and requires lower cost solutions that are less volatile.
Discussion of data reliability and future requirements
In order to draw more reliable conclusions about the well-being of residents in Nunavik and in order to evaluate if it meets the principles of sustainable development we need more detailed time series data on meaningful economic, social and environmental indicators. Even conventional measures of socioeconomic development are sketchy and not collected in sufficient detail and consistency. There is also a shortage of data on the traditional economy in Nunavik. One of the possible ways to obtain estimates of the non-wage labour activities in Nunavik is to investigate whether the results of the Nunavut Wildlife Harvest Study can be generalised and used in the analysis of Nunavik. Also the Aboriginal Peoples Survey and Survey of Living Conditions in the Arctic provide estimates of harvesting in Nunavik. Community-focused data would also be useful in order to analyse local employment and development plans prepared by each community (Kativik Regional Government 2008). There is also a lack of data on cultural activities such as carving, arts and the cultural and social values of traditional harvesting activities and how country food is shared. Finally, data on education in Nunavik do not take into account traditional knowledge.
Summary of results
Despite some indications that GDP has grown in Nunavik, it does not seem that disposable income to Nunavik residents has increased at the same pace. In addition GDP per capita at purchasing power parity is relatively low in Nunavik compared to other Arctic areas. The relatively high unemployment rate combined with the strong growth in the youth population is a serious concern and requires further economic activities that create long lasting jobs and more sustainable levels of income for a wider segment of the population.
Nunavik's physical capital is either insufficient (as in the case of housing and energy infrastructure) or deteriorating (as in the case of transportation infrastructure). Significant investment is necessary to keep up with population growth, climate change and to accommodate progress in the market economy. Despite the abundance and potential for renewable energy solutions there is no connection to the electricity grid in southern Québec, nor are local hydro sources developed or other renewable energy sources integrated with existing diesel generators. The transportation infrastructure is in need of repairs and renewal to keep up with permafrost changes due to climate change. In addition the existing transportation infrastructure is an impediment to economic development.
Human capital has much potential to grow but requires the right kind of education and establishment of fulfilling jobs. Some of the health figures are alarming and indicate that nutrition and life styles have negative impacts on certain illnesses, addiction problems and suicide rates. Population health is in turmoil, and there are some clearly alarming trends that need to be further examined.
Participation in the traditional sector is still quite strong in Nunavik, although there are signs of less equal access to hunting and country food. It needs to be further explored how hunting effort and country meat is distributed and to what extent youth is being trained on the land. Crime rates per capita are increasing at an alarming rate, which indicates some deterioration in trust and growing social unrest.
Finally some of the key renewable resource stocks are vanishing or access is reduced due to establishment of quotas and seasonal restrictions. Essential natural capital is crucially important for the maintenance of the social fabric of the traditional sector of the mixed economy.
Development opportunities, challenges and concerns
In addition to the reported data on Nunavik we would also like to discuss the outcomes of the 2-day Nunavik Economic Summit that was held 7–8 April 2010 in Kuujjuaq and hosted by Makivik Corporation and the Kativik Regional Government. There were 70 attendees (including the presenters), representing a variety of stakeholder groups: the Kativik Regional Government, Makivik Corporation, Mayors and presidents of the Landholding Corporations from each community, local private business owners, and researchers. The purpose of the workshop was to provide an opportunity for regional and local stakeholders to obtain information on specific economic opportunities for Nunavik and to discuss their merit for the communities. The event was focused on market-based opportunities in the fields of mining, natural resources and tourism along with new opportunities in the areas of community economic development and the land-based economy. The forum also provided an opportunity to discuss the concept of sustainable development and what it means in the Nunavik context. The forum identified the major potential employment and business sectors and major factors that are of importance for community economic, cultural and social development and a sustainable regional development path. Due to increased population growth, youth unemployment and addiction issues it was generally identified that the employment and training of Inuit is of utmost importance for the region. Participants in the summit echoed some of the empirical evidence that was presented in the previous section. In addition, it became evident during the summit that economic development experiences were quite different in various communities. While some communities remained rather traditional, other communities engaged and profited more from mining activities. We will first discuss challenges and opportunities in each of the four economic areas identified in the Nunavik Economic Summit.
Nonrenewable resource extraction
Mining potential, in terms of abundance of non-renewable resources seems tremendous in Nunavik, particularly for nickel, iron, uranium and lithium. Some communities are already benefitting from employment and revenues from the Raglan nickel mine. Jean-Marc Séguin (MRN) reported that there are world-class iron deposits between Kuujjuaq and Shefferville, and there are plans to develop this area. The Adriana's Lac Otelnuk iron ore project, for example, plans to build a double rail line and a major port to start extracting iron in 2019 for about 50 years. Another project, located in the smallest community in Nunavik, Aupaluk, plans to extract iron ore just outside of the community. That would mean an influx of 1000 workers in a community of 120. These projects could potentially offer major revenue streams for the area, but leaves a number of unanswered questions and risks. First it is not clear to what extent Inuit will reliably and continuously benefit from mining projects. Inuit are not currently in senior employment or executive positions and so far employment is mostly in the form of prospecting for new sites. Significantly more training and capacity is needed to have a meaningful participation in mining activities and to make proper decisions about the scale and operation of mining projects. Large-scale projects such as the Adriana iron ore project will have a significant impact on the region. As was pointed out by a presenter this kind of project will require financing by major global players, most likely from China. One, therefore, needs to weigh the potential economic opportunities with the loss of control over the land, social impacts on the communities, potential disturbances to wildlife stocks (especially caribou herds) and the influx of southern and foreign workers. It is furthermore very difficult to predict the lifetime of a mine and the consistency of employment and revenue flows. Mining is a cyclical business with boom and bust cycles and when market prices become too low mines will quickly cease operation. The demand for minerals is very unpredictable since it depends on world markets, the discovery of new reserves and other events. Some residents of Inuit communities also voiced concerns about potential contamination of water bodies and detrimental impacts for Arctic char and other aquatic species. A more thorough and consistent monitoring of the impacts of mining tailings and mining related contamination on aquatic life seems necessary to reassure parties about the sustainability of land resources. Although mining activities usually go through impact benefit agreements (IBA) it is difficult for Inuit to negotiate the right terms since IBAs are kept confidential and communities cannot easily learn from other communities’ past experiences.
Commercial harvest of renewable resources and alternative energy
A number of commercial renewable resource and energy sector opportunities were identified. All of the renewable resources that are currently exploited on a commercial basis or that are considered for commercialisation are not any of the country food sources.
Commercial fishery
There is already a significant shrimp and turbot fishery in Nunavik that employs up to 400 people per season. The hourly salary is relatively good at around $28/hour but the level of educational requirements is increasing. The average trip on a shrimp vessel is 25 days and 40 days per trip in the turbot fishery. This could cause some interruptions to the pursuit of land-based activities. In addition, fishery employment and revenues are based on the proportion of a total allowable catch (TAC) that is determined by fishery scientists and the Department of Fisheries and Oceans. At the time it was estimated that shrimp stocks could have been reduced by as much as 40 %, which probably would cause major reductions in the TAC. The Makivik Corporation, therefore, is looking to diversify their fishing rights. Other promising fisheries seem to be the mussel or sea urchin fisheries since there is an emerging market for these resources and the species are relatively stationary and, therefore, easier to manage.
Bioscience and cosmetic sector
Nunavik Biosciences is developing a line of cosmetic and medicinal products that are based on natural renewable products harvested in Nunavik. The natural and organic product market is identified to be a strongly growing market. Products from the north are considered clean and pure. In addition Inuit and other traditional societies have a reputation for discovering commercial uses for plants or other renewable resources (Marles Reference Marles1999). The current project of Nunavik Biosciences involves the harvesting of seaweed in the Kangirsuk area. There seems to be an abundance of seaweed and the harvesting season is limited to 10 weeks. The short harvesting window reduces the possible strain on the resources but also has some downside because it restricts total production and demands a very intense concentrated work cycle. Representatives form Nunavik Biosciences identified major human resource challenges. There is a lack of specialised skills for this kind of work in Nunavik and there also seem to be issues concerning work ethics in managerial positions. A viable business model requires very disciplined and relentless work in a short time during prime subsistence fishing season.
Renewable energy
Communities in the north depend almost exclusively on diesel fuel for power and space heating. The Innavik project is a run of the river hydropower project that would provide around 7.5 MW for the community of Inukjuak. This capacity could heat and power roughly 2,500–3,000 homes in southern Quebec areas. It would also create excess capacity in summer months that could be used for light industry, greenhouses or other commercial uses. Run-of-the-river hydro projects are considered one of the most sustainable forms of electricity generation since they do not depend on massive damming and flooding and have minimal impact on fish stocks. An additional benefit in the north is that it would reduce the dependence on dirty energy sources and continuously rising diesel fuel prices. The challenge for Inukjuak is to raise more finance capital and to negotiate good prices for selling the electricity to Hydro Québec, which is the sole and centralised provincial authority for the generation, transmission and distribution of electricity.
Tourism
Tourism in Nunavik started in 1953 with fishing camps and later on extended to hunting camps as well. This traditional tourism stream is deteriorating now as outfitters are closing down and caribou herds are either not as abundant or changing their migration patterns. The newer wave of tourism in Nunavik consists of adventure and ecotourism type of activities. Tourists want to experience the lifestyle of the north and observe rather than hunt native animals. In order to develop this type of tourism experience one needs to provide a package of the true Nunavik experience and clearly distinguish it from other parts of the North, particularly Nunavut. Many potential tourists either do not know the difference between Nunavik and Nunavut or are not even aware of the existence of Nunavik. Due to housing shortages and the lack of restaurants it made sense to start this kind of tourism experience with cruise ships that can reach different parts of Nunavik, Nunavut, Greenland and the rest of the Arctic. The tourism sector does not yet employ a significant proportion of Inuit, but offers the potential to involve both youth and elders in tourism-related activities in a fashion that is compatible with traditional land-based activities. In fact, the integration of activities in the wage and non-wage economy might add authenticity to the tourist experience. There are, however, training, skills and logistic challenges in the tourism industry. First it is expensive to fly to Nunavik due to a monopoly of First Air. Secondly it is difficult to serve local food on board of the cruise ship or during land excursions because country food cannot be officially sold. One of the major cruise ship lines (Cruise North) is serving arctic char (a relatively abundant species in Nunavik) on its ship that it acquires in St. John's, Newfoundland.
Traditional land-based activities and community development
Country food, community development and the non-wage sector are all linked in a number of ways. In addition this sector has traditionally had ties to the wage economy through the sale of surplus animal products such as furs or skins. There is the potential to increase the market for arts (carvings, sculptures, paintings, etc.) and for niche products such as local jams, kelp, smoked meat and fish. The support of these sectors needs financial capital and possibly further development of producer cooperatives. Between 2004 and 2008, returns to co-operative members doubled. The opportunities to expand businesses and services are numerous. Co-operatives are, however, limited by many of the same challenges as other initiatives: mainly, the high cost of doing business in the north and human resources challenges. The newest venture of the FCNQ (which started in 2007) is the establishment of a caisse d'économie solidaire in Nunavik, which offers co-operative financial services to Nunavimmiut. FCNQ hopes to receive funding for its Nunavik Financial Services Cooperative. Other opportunities include: alternative energy initiatives, becoming a carrier and supplier for mining companies, establishment of partnerships with local entrepreneurs and developing cooperative housing in the region. Because the cooperative movement is committed to community well-being, the FCNQ has an important role to play in the creation of a sustainable development plan for Nunavik.
The Avataq Cultural Institute's presentation offered suggestions for other ways that Inuit culture and language can be marketed to the general public in a way that provides both economic and cultural benefits to Nunavimmiut. Publishing distinctive books and learning materials in Inuktitut promotes the use of the language in the region. Support for a wide range of Inuit arts can help to encourage cultural tourism, while generating income for artists and communities. The presentation revealed that Avataq has proposed to reserve 1% of the Nunavik budget for culture and language initiatives.
Finally Natcher emphasised the importance of the land-based economy and the provision of country food by mapping networks of hunters and households sharing country food in Nunatsiavut (Labrador). He found that well over 80% of the households in Nunatsiavut were participating in harvesting activities and that 96% of households gave and/or received wild foods over the course of the year. Natcher found that 30% of households harvest at minimum 70% of total food. The sharing networks are very complex and each involves up to 18 different households. On average, men spent almost two times as many weeks on the land as they did earning wages (47 weeks per year and 29 weeks per year, respectively), while women's time was divided fairly evenly between the two (33 weeks per year earning wages and 38 weeks participating in wild food production). Households in Nunatsiavut were consuming close to 500 kg of wild foods per year. The replacement cost equivalence (to buy the same amount of southern meat from the store) would require about 16% of the median annual household income. The latter is a conservatively low estimate as hunters are willing to spend far more money and time to acquire local country food than to buy beef, pork or farmed salmon from the store. Finally it is interesting that certain households’ demographics are sponsoring the harvesting of country food from their wage sector earnings. To better understand the dynamics between households that receive wage earnings and hunt country food is an essential task to better map the Nunavik economy and to find a sustainable path for the integration of land-based activities and wage-based opportunities.
A sustainable model for Nunavik
The available data on unemployment rates, social well-being, addiction and suicide rates, chronic diseases and crime rates suggest that the current economic, social, cultural and health situation in Nunavik is worrying. In addition Nunavik is losing substantial sources of natural capital such as crucial wildlife resources and soil (due to permafrost melt). The model proposed by former ‘Plan Nord' and the new ‘Nord pour tous’ is not a sustainable model that can be relied on for the long term due to its extensive reliance on mining and government expenditures. Government transfers and public administration expenditures create a strong dependency and cannot be relied on forever due to increasing budgetory constraints that particularly will preoccupy the Province of Québec. Mining activities are very sensitive to market change and they have created little employment for the communities so far. In fact, in the case of the Raglan Mine, it contributes to the weakening of the social fabric, as a result of the distribution of royalties directly to individuals, according to several community representatives at the economic summit in Kuujuuaq. It is, therefore, important to propose a sustainable economy model that goes beyond the alternatives of public sector and mining created employment and wealth, and that enhances the mixed economy pattern that is already present in Nunavik.
We identified four main areas of the Nunavik economy at the summit but there are probably many more opportunities that could be explored. Within each sector there are diversification and extension possibilities. For example, Inuit could develop new fisheries, such as the commercial harvesting of mussels and sea urchins. The tourism sector could consider helicopter tours to view polar bears, caribou and other wildlife. This would also bring more steady business outside the summer peak season. In the summer Nunavik could add whale-watching tours. Tourism might be one way to encourage the young to retain culture, language and traditional practices and to work more with elders. Local arts could be promoted through regular arts show and art could be better distributed through formal distribution networks throughout Nunavik and the rest of Canada. Finally participants at the forum emphasised the need to create a distinctive image of Nunavik that is recognisable.
A sustainable path needs to incorporate a longer-term vision that capitalises on the strength of local communities in the region and that keeps track of changes in all five sources of capital that we have identified. In addition it needs to be determined and realised what critical assets are required to maintain sustainable livelihoods in Nunavik's communities. Some of the most important critical assets are ecological thresholds, access to renewable resource stocks that cover basic needs, stability and quality of employment and cultural and social stability. Social capital is key to sustainable development since the development of all the other sources of capital depends on a healthy social fabric. In Nunavik, this social fabric is linked to the mixed economy that allows the pursuit of land-based activities in conjunction with a government and market-based economy. Land-based activities provide food, strengthen social fabric and help in maintaining Inuit culture and language. In order to sustain land-based activities they need to be more effectively integrated with the wage-based sector. Human capital must be developed simultaneously in the land-based and wage-based sector, and finance sources for land-based activities must be sustainable and not depend on the continuation of transfer payments or hunter support programmes. Traditional skills are not used for job requirements in the wage economy. For example, Inuit hunters are already encouraged to engage in prospecting activities while they are out on the land. This should be extended to other activities such as the mapping and assessment of abandoned exploration sites and environmental monitoring. One model to look at could be the Innu Nation Guardian Program in Labrador (Sable and others Reference Sable, Howell, Wilson, Penashue and Sillitoe2007), which trains Innu within a wide range of environmental disciplines, so that Innu Nation's Environmental Guardians can carry out IBAs and related co-management responsibilities with the necessary skill and competence. The key component of any viable long-term vision is that sustainability criteria are at the centre stage and not a second thought (Gibson Reference Gibson2006). In addition the vision needs to be regularly updated in a feedback process that requires active learning and monitoring of progress.
A good start is to create an inventory of the community's assets under the headings – financial, physical, natural, human and social to guide sustainable development planning, tracking and refinement. Communities then need to think about all the economic opportunities in their region and how to effectively and sustainably integrate jobs in the wage-based sector with land-based activities. Active consultation with other communities should be encouraged in order to learn about different economic development options and their social, cultural and environmental impacts. In addition every community has to specify its basic needs and, therefore, what renewable resource access is required. Plan Nunavik (KRG and Makivik 2012), a community based process set up to answer the development plan from Québec is based on these premises and could offer a starting point of a path to a more sustainable development.
Long term objectives need to focus on individual and collective capabilities (Ozkan and Schott forthcoming) that are supported by sustainable and increasing aggregate levels of social, human, financial, physical and natural assets. In Nunavik this translates to reducing unemployment rates, improving housing conditions, maintaining vital renewable resources for good nutrition and food security, diversifying the economy, reducing crime, suicide and addiction rates, increasing high school graduation rates and access to postsecondary education, securing new sources of finance, providing alternative energy systems and new infrastructure investments. Education and training is an important element of sustainability and some effort should be put into developing a curriculum that is better attuned to northern realities, and that improves graduation rates. Education is about more than just school; mentorship, apprenticeships and intergenerational traditional knowledge transfer are all valuable. For many wage-based activities it is not only difficult to find skilled labour but it is also often difficult to adapt to a different work ethic that is not based on need and sharing. It is quite important that employees have mentors that they can associate with from their social networks and that introduce them to a different work environment. This is particularly true in a society that puts so much emphasis on trust and reciprocity. A Nunavik postsecondary institution could provide a much-needed improvement in education since Nunavik is the only Inuit region without a postsecondary institution. Finally, developing local and regional governance and institutional capacity through devolution, education and training should contribute to improving social and political capital and to tackle the challenge of population growth, resource development projects and climate change.
Making the transition to a sustainable economy
The transitional process should contribute to the creation of useful forms of capital for the future. Economic development should not just create income and short-term economic stimulus, but also needs to contribute to the establishment of useful skills and education that can be transferred to other economic activities. Some sustainable mining activities might serve as opportunities to generate human and physical capital, as long as they do not diminish crucial social and natural capital. The IBAs should reinforce human (scholarship, training, skills and traditional knowledge transfer) and social capital (strengthening current networks based on sharing country food and complementing them with new social and business networks), and ultimately focus on community well-being. IBAs should emphasise the creation of useful, transferable skills, demand educational components and the creation of infrastructure that can also be used once the mining operation terminates. Rather than investing in major railway lines that might never be utilised after mining projects cease to exist, mining companies could contribute to the establishment of a self-sufficient renewable energy system that supply communities with energy for several generations or provide training programmes that raise generally needed skill sets. The tools that exist to regulate development activities on Inuit lands (land claims, IBAs, other legal regimes) may not deal with all the issues. They will probably require changes over time. Nunavimmiut could create a mining development protocol that sets minimum requirements for each stage of the mining process.
The current strong reliance on government expenditures and employment should be relaxed as more private sector and land-based sector economic opportunities emerge. The presence of government could be useful in the near future to establish further local political capacity and to strengthen the development of Nunavik institutions, which may help to create a more cohesive vision for development in the region. The Nunavik Regional Government proposal was seen by Nunavik elites as a way to strengthen the region but it was rejected by the Nunavik population in a referendum. In spite of this setback, the Nunavik institutions have shown collaboration in designing the Plan Nunavik.
The transition to more self-sufficient and efficient energy sources will require testing of new technologies in the Arctic environment and new advances in storing technologies. In the meantime we need to deal with intermediate solutions moving away from diesel dependence. Nunavik has hydropower potential that could be combined with diesel or wind power production. It is important to have constructive partnerships with Hydro Québec and Aboriginal Affairs and Northern Development Canada (AANDC) in order to advance experimentation and knowledge in energy transformation. Establishing an integrated transmission grid in Nunavik and connecting to Hydro Québec's grid as suggested under Plan Nunavik (KRG and Makivik 2012) does not seem very efficient and realistic with such sparsely populated and distanced communities. It would also create an even stronger dependence on Hydro Québec. Instead it could be more feasible to build local energy networks based on run of the river hydro facilities or hybrid diesel-wind power co-generation systems or other decentralised energy system solutions. The local energy networks could be financed through loans or through IBAs with mining or other companies that depend on reliable local power supplies. There are a number of potential financial resources for this kind of learning process under Plan Nord. Québec intended to invest about $80 billion over 25 years in the north. Furthermore, a growing sector in the energy field is the use of biofuels from algae or seaweed for energy generation (Wargacki and others Reference Wargacki, Leonard, Win, Regitsky, Santos, Kim, Cooper, Raisner, Herman, Sivitz, Lakshmanaswamy, Kashiyama, Baker and Yoshikuni2012). Since Nunavik already harvests seaweed for the cosmetic industry it could explore possible synergies between the two sectors and potentially be a leader in Arctic applications in this emerging field.
Conclusion
Nunavik is a fast growing region that faces major socioeconomic challenges and that needs to make major decisions in the near future of what development route to take. New economic opportunities are needed to fuel the economy, to provide much needed jobs for youth and to support the subsistence sector. It is important to avoid dependence on one large sector such as mining or a specific nonrenewable that draws all of the resources into that sector and could actually diminish social and human capital and lead to lower and less sustained economic growth. The current dependency on government and mining sectors is not a long-term sustainable option. These sectors might, however, play a crucial role in the transition to a sustainable mixed economy that preserves critical social and natural capital. Nunavik would benefit from a more diversified and better integrated mixed economy. The forum in Kuujjuaq in 2010 demonstrated that a diversity of economic opportunities exist in Nunavik that can play a crucial role in Nunavik's sustainable development vision and path.
Former Plan Nord's goal of respecting the principle of sustainable development is mostly defined in terms of protecting environmental capital of at least 50% of the Plan Nord territory. It does not really address the cultural and social capital dimensions of sustainable development, and its connection to critical natural capital in the region. Is it enough to set aside some protected areas? Who decides where they are located and what they can be used for? Nunavik Inuit want to and need to be part of this consultation process as they point out in Plan Nunavik (KRG and Makivik 2012). More varied, detailed and consistent data collection is needed in order to evaluate progress and update Nunavik's vision. This will require close collaboration with hunters, elders, community leaders, Makivik Corporation, the Kativik Regional government and academic researchers in a continuing learning process. It is important to verify with Nunavimmiut the relevance of data for individual and community well-being and to increasingly engage locals in data collection, interpretation and decision-making. This in itself will create human capital and long lasting employment activities. A sustainable development advisory board that consists of elders, youth representatives, representatives from Nunavik institutions and each community, and carefully selected outside experts could assist in guiding Nunavik and its communities to a more prosperous and sustainable future.
Acknowledgements
We would like to acknowledge the contribution of various groups and individuals. Frances Abele launched the New Northern Economy Research Program from which this paper originated. Research assistants Dmitry Lysenko and Umut R. Ozkan provided invaluable assistance in defining the concept of sustainable development. Sheena Kennedy Dalseg, another research assisant, provided a very thorough report about the Kuujjuaq Economic Forum. We would like to extend our thanks to Makivik Corporation for inviting us to participate at the Kuujjuaq Economic Forum. We are also very grateful to the two anonymous reviewers who helped to improve this paper in a significant way. This research was partly funded by the SSHRC (grant number 820-2008-4016).