I. INTRODUCTION
The development of Fe-based amorphous and glassy alloys with improved performance characteristics such as amorphous forming ability, magnetic softness, and mechanical properties has been one of the major research subjects in materials science and engineering field for the last several decades,Reference Long, Shao, Xie, Zhang, Shen and Inoue1–Reference Lavorato, Fiore, Tiberto, Baricco, Sirkin and Moya4 owing to the expectation of saving energy and natural resources. The most attractive points of these alloys are due to their potential for good soft magnetic properties with high-saturation magnetization by means of a simple production process from melt.
Although the enrichment of Fe content for Fe-based amorphous alloys is effective for an increase in saturation magnetization, reduction in corrosion resistance has been caused simultaneously.Reference Ryan, Coey and Strom-Olsen5,Reference Mishra, Gurram, Reddy, Perumal, Saravanan and Srinivasan6 The deterioration of corrosion resistance has led to the limitation of mass production techniques for amorphous magnetic core materials with inexpensive cost, because a water atomization technique has been thought to be the most important and key technology for such a requirement.Reference Matsumoto, Urata, Yamada and Inoue7,Reference Inoue, Yoshii, Kimura, Okumura and Kurosaki8
Recently, special attention has been devoted to an increase in saturation magnetization of Fe-based magnetic amorphous alloys in conjunction with good corrosion resistance and good bending ductility.Reference Botta, Berger, Kiminami, Roche, Nogueira and Bolfarini9 A number of Fe-rich amorphous alloys containing more than 80 at.% Fe were developed up to date,Reference May, Souza, Morelli, Mariano and Kuri10,Reference Chang, Qin, Makino and Inoue11 but little has been reported about the corrosion behavior and magnetic softness with high-saturation magnetization above 1.7 T. This paper aims to present the alloy compositions, amorphous forming ability, bending ductility, thermal stability, magnetic properties, and corrosion behaviors of Fe-based amorphous alloys with high-saturation magnetization near 1.7 T and to investigate an engineering usefulness of newly developed Fe-rich amorphous alloys as a new type of soft magnetic material.
II. EXPERIMENTAL PROCEDURE
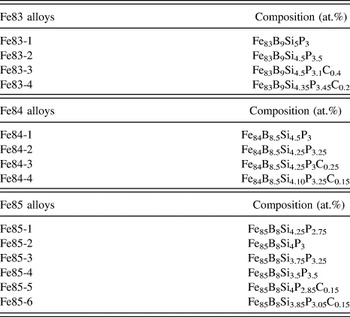
Fe-based alloys with high Fe contents were chosen because little is known about the synthesis and corrosion resistance of such Fe-rich amorphous alloys.Reference Chang, Kubota, Makino and Inoue12 The code names and compositions are listed in Table I. The alloy components are presented by nominal atomic percentage. Alloy ingots were prepared with a high-frequency induction furnace in an argon atmosphere. From the alloy ingots, amorphous alloy ribbons were prepared by a melt spinning equipment with a copper wheel of 25 cm in diameter and the outer surface velocity of the wheel was about 15–25 m/s. These ribbons were prepared with different thicknesses ranging from about 20 to about 90 μm and a nearly constant width of about 0.9 mm which was controlled to maintain a good amorphous formability. The amorphous nature was identified by x-ray diffraction (XRD, Cu Kα, λ = 0.4506) and all the XRD patterns were taken on the freely solidified surface. The morphology was observed by scanning electron microscopy (SEM). Thermal stability was evaluated by differential scanning calorimetry (DSC) at a heating rate of 40 K/min. Curie temperature was determined by observing a tiny endothermic type inflection point below crystallization temperature on the DSC curve. Saturation magnetization was measured with a vibrating sample magnetometer (VSM) under an applied field of 800 kA/m. The coercivity and initial permeability were evaluated by a B–H loop tracer. The effective permeability was evaluated at 1 kHz and a field of 1 A/m by an impedance analyzer. Corrosion behaviors were evaluated for the ribbon samples which were degreased, washed, and dried in air before immersion and electrochemistry test. Electrochemistry measurements were performed by an electrochemistry workshop (Gamry Reference 600 redefining electrochemical measurement) in 3.5 mass% NaCl solution deoxygenated with nitrogen at 298 K. Ribbon samples were set as the working electrode; a platinum electrode was used as the counter electrode; and a saturated calomel electrode (SCE) was used as the reference electrode. Samples were immerged in the solution for 20 min to reach a stable potential before test. Polarization curves were measured by a potentiodynamic process from 200 mV under open circuit potential (OCP) to 1000 mV above OCP value at a scanning rate of 1 mV/s. Electrochemistry impedance spectra (EIS) tests were performed with a signal amplitude of 10 mV around OCP values in the frequency range of 0.01 Hz to 100 kHz. Experiments were repeated three more times during the research.
Compositions of Fe83, Fe84, and Fe85 alloy series.

III. RESULTS
A. Structure and thermal stability
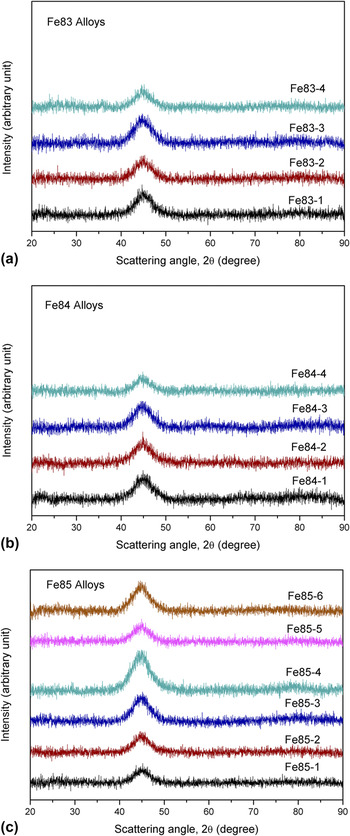
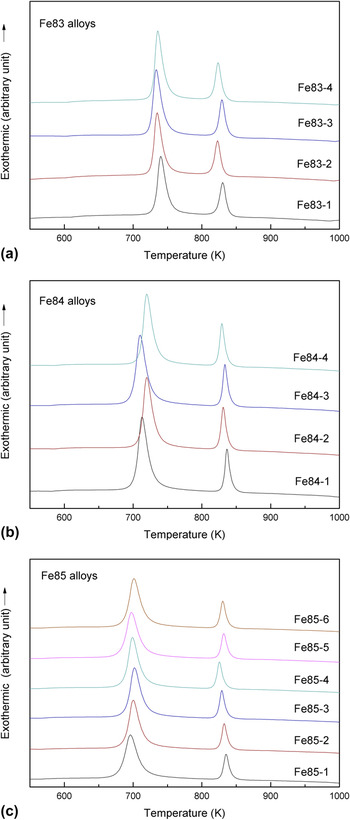
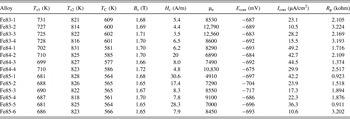
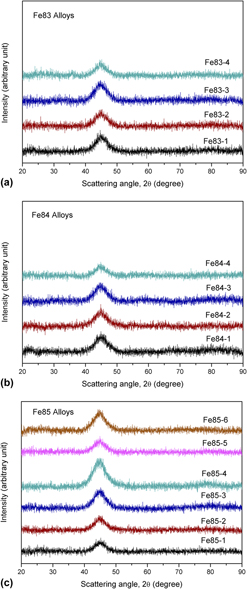
Figure 1 shows XRD patterns of the melt-spun alloy ribbons. Only a broad peak can be seen on each XRD pattern, indicating the absence of any long-range crystalline phase within the sensitivity of XRD. Here it is important to describe that all the ribbon samples exhibit good bending ductility as it can be bent through 180 degrees without fracture. Figure 2 shows DSC thermograms of their melt-spun amorphous alloys. Two separated exothermic peaks are observed for all the alloys. The first peak at the lower temperature side is due to the precipitation of bcc α-Fe phase, while the second one at the higher temperature side is associated with the precipitation of α-Fe and tetragonal Fe3(B,P) compound phases from the remaining amorphous phase. The onset temperatures of the first (T x1) and the second (T x2) exothermic peaks and Curie temperature (T C) obtained from the DSC data are summarized in Table II. It is noticed that T x1 decreases with increasing Fe content, indicating that the precipitation of bcc-Fe phase is dependent on total Fe content. In addition, as shown in Table II, the T x1 values of C-free amorphous alloys tend to increase with increasing B, P, and Si contents, while the T x2 remains almost constant, resulting in a reduction of the temperature interval between the two onset temperatures (T x2 − T x1). The increase of T x1 with increasing B, P, and Si contents may be associated with the necessity of migrations of the metalloid elements from the bcc-Fe phase to the remaining amorphous phase, because of very low solubility limit of these metalloid elements to bcc-Fe phase in their binary equilibrium phase diagrams.13 Further, the increment tendency of T x1 with increasing metalloid content is more significant for B addition than for P addition, which seems to reflect the difference in the bonding nature between Fe and B or P elements.
XRD patterns of (a) Fe83, (b) Fe84, and (c) Fe85 alloys.

DSC curves of (a) Fe83, (b) Fe84, and (c) Fe85 alloys.

Results of thermal, magnetic, and corrosion parameters: onset temperature (T x1 and T x2), Curie temperature (T C), saturation magnetization (B s), coercivity (H c), effective permeability (μe), corrosion potential (E corr), corrosion current density (I corr), and polarization resistance (R p) for Fe83, Fe84, and Fe85 alloy series.

B. Magnetic properties
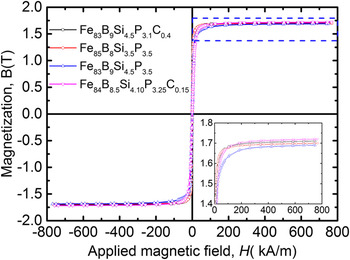
Figure 3 shows B–H hysteresis loops for a part of the amorphous alloys annealed in a vacuum for 600 s at the temperature which is 100 K lower than Curie temperature T C to obtain good magnetic softness. It is notable that the saturation magnetization is 1.69 T for Fe83B9Si4.5P3.5, 1.70 T for Fe85B8Si3.5P3.5, and 1.71 T for Fe83B9Si4.5P3.1C0.4, respectively, and reaches 1.72 T for Fe84B8.5Si4.10P3.25C0.15. Magnetic properties of saturation magnetic flux density (B s), coercivity (H c), and effective permeability (μe) at 1 kHz are summarized in Table II. In addition to their high-saturation magnetic flux density values, good magnetic softness of less than 5 A/m for coercivity and more than 12,000 for effective permeability can be exhibit among these amorphous alloys. According to some references on Fe-rich amorphous and glassy alloys reported to date, the highest value of saturation magnetization is about 1.65 T,Reference Makino, Chang, Kubota and Inoue14 which is lower than the present saturation magnetic flux density values.
B–H loops of (a) Fe83B9Si4.5P3.1C0.4, (b) Fe85B8Si3.5P3.5, (c) Fe83B9Si4.5P3.5, and (d) Fe84B8.5Si4.10P3.25C0.15.

C. Corrosion behavior
Although a number of Fe-rich amorphous alloys with excellent soft magnetic properties have been developed for the last several decades, little is known about the corrosion behavior. The urgent necessity of high corrosion resistance for Fe-rich soft magnetic amorphous alloys with high-saturation magnetization is attributed to the use of water atomization in the mass production techniques and processes with low-cost.Reference Matsumoto, Urata, Yamada and Inoue7,Reference Inoue, Yoshii, Kimura, Okumura and Kurosaki8 In this section, we present the results obtained by various electrochemistry measurements which were carried out in 3.5 mass% NaCl solution to examine the corrosion behaviors of the Fe83, Fe84, and Fe85 amorphous alloys and investigate the influence of element content on the corrosion behavior of these alloys.
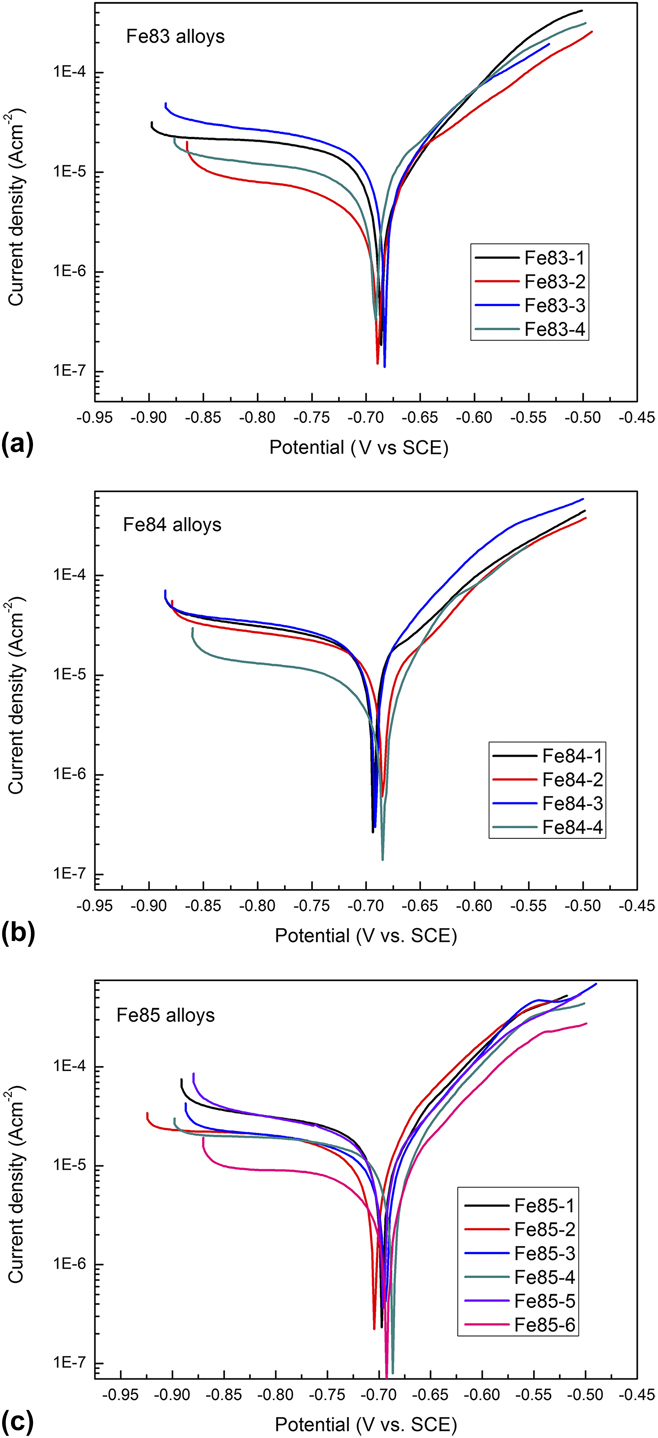
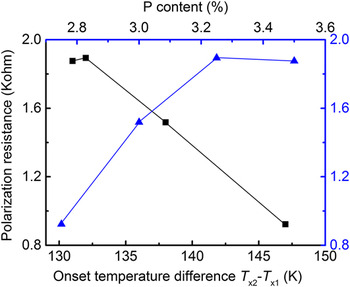
All the OCP values are nearly the same as approximately −680 mV. Polarization curves and electrochemistry parameters such as polarization resistance (R p), corrosion potential (E corr), and corrosion current density (I corr) are shown in Fig. 4 and Table II, respectively. It is noticed that higher polarization resistance is achieved at the lower Fe content of 83 at.%, indicating that the increase in Fe content causes a reduction in corrosion resistance. To investigate the influence of P element on corrosion resistance, the change in the polarization resistance of the C-free Fe85B8Si7−xPx (x = 2.75, 3, 3.25, and 3.5) alloys with different P contents is shown in Fig. 5(a). It can be seen that the corrosion resistance tends to improve with the increase in P content in the Fe–B–P–Si alloy system although there is a data plateau at 3.5 at.%, which indicates that a limitation of polarization resistance may be reached. Noticing the results in the former section that the stability of the amorphous phase is dependent on P content, the relation between polarization resistance and (T x2 − T x1) values is summarized in Fig. 5(b). It is concluded that the corrosion resistance can be improved by the increase in the stability of amorphous phase. The effect caused by the addition of P element agrees with some previous results of P-containing Fe-based amorphous alloys and may be regarded by the formation of P-rich surface thin layer.Reference Asami, Kimura, Hashimoto and Masumoto15
Potentiodynamic polarization curves of (a) Fe83, (b) Fe84, and (c) Fe85 alloys in 3.5 mass% NaCl solution at 298 K.

Plots of polarization resistance with (a) P atom content and (b) onset temperature difference of C-free Fe85 alloys in 3.5 mass% NaCl solution at 298 K.

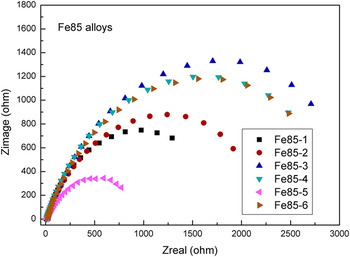
The Nyquist plot of EIS at 105–10−1 Hz for the C-free Fe85B8Si7−xPx (x = 2.75, 3, 3.25, and 3.5) amorphous alloys is shown in Fig. 6. It is obvious from the Nyquist plot that the diameter of the semicircle increases with increasing P content. This indicates that the resistance of charge transfer is enhanced by the increase in P content in the alloys, in agreement with the effect of P content on the improvement of polarization resistance.
EIS Nyquist diagram of Fe85 alloys in 3.5 mass% NaCl solution at 298 K.

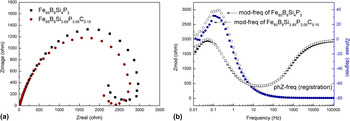
Two alloys Fe85B8Si4P3 and Fe85B8Si3.85P3.05C0.15 with similar P contents were selected for the EIS measurement with the aim of investigating the low-frequency corrosion behaviors and the influence by the addition of C element. The plots of EIS in the range of 103–10−2 Hz for these two amorphous alloys are shown in Fig. 7. The loops of inductive phenomenon can be recognized in both the Nyquist plots in their low-frequency range, indicating the inoculation of pitting corrosion. This corrosion behavior has no obvious relation to the presence of C.
EIS Nyquist diagram of (a) Fe85B8Si4P3 and (b) Fe85B8Si3.85P3.05C0.15 alloys in 3.5 mass% NaCl solution at 298 K.

D. Ribbon thickness dependence
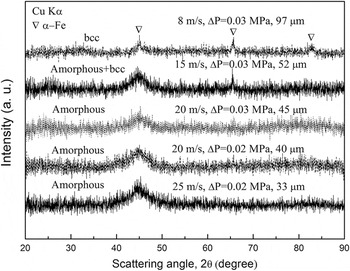
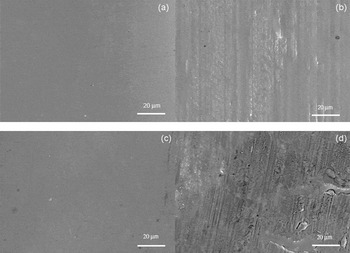
Considering that the change in ribbon thickness caused by the control of wheel surface velocity in the melt spinning technique affects significantly both the amorphous structure and properties of amorphous alloys, the alloy Fe84B8.5Si4.10P3.25C0.15 with good magnetic softness was chosen for further study on structure characteristics, magnetic properties, and corrosion resistance of amorphous alloy ribbons with different thicknesses prepared at different copper wheel surface velocities. The thicknesses of the ribbons produced at the circumferential velocities of 25, 20, 20, and 15 m/s were 33, 40, 45, and 52 μm, respectively. Figure 8 shows XRD patterns of Fe84B8.5Si4.10P3.25C0.15 amorphous alloy ribbons with different thicknesses. The XRD patterns of the three ribbons with thicknesses at or below 45 μm consist of only a broad peak, indicating the formation of an amorphous phase, while that of the ribbon with a thickness of 52 μm includes some crystalline peaks corresponding to the bcc Fe-phase, in addition to amorphous phase. It is thus concluded that the critical thickness of this amorphous alloy lies around 50 μm. We further examined the morphology by SEM for the samples of 33 and 52 μm. As shown in Fig. 9, the roughnesses of the two samples are different between the freely solidified surface and the wheel-contacted surface. The thicker sample of 52 μm has better smoothness as compared with the thinner sample of 33 μm. It is obvious that the smoother surface causes a higher corrosion resistance. Besides, the different roughness appears to reflect the stability of liquid puddle formed on the outer side surface of the rotating wheel. Liquid alloy puddle in a unit volume can be stretched to longer and looser states with increasing rotation speed.
XRD patterns of Fe84B8.5Si4.10P3.25C0.15 alloy ribbons with different thicknesses.

Morphology of Fe84B8.5Si4.10P3.25C0.15 alloy ribbons: (a) 52 μm for freely solidified surface, (b) 52 μm for wheel-contacted surface, (c) 33 μm for freely solidified surface, and (d) 33 μm wheel-contacted surface.

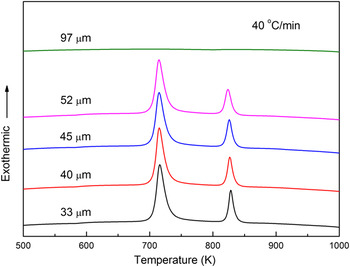
Figure 10 shows the DSC thermograms for the amorphous ribbons with thicknesses of 33, 40, 45, 52, and 97 μm. No appreciable change in the T x1, T x2, and the heat of crystallization is seen for the ribbons with thicknesses below 97 μm, being consistent with the results obtained by x-ray diffraction patterns. However, the ribbon of 52 μm in thickness shows a slightly smaller heat of crystallization, though the T x1 and T x2 are nearly the same as those for the thinner ribbon samples. In addition, no exothermic peak is seen on the DSC curve of the 97 μm sample. These features of the DSC curves and XRD patterns indicate that the as-spun structure consists of an amorphous phase for the ribbons with thicknesses below 52 μm, amorphous phase containing a small amount of bcc-Fe phase for the 52 μm ribbon and only crystalline phases for the 97 μm ribbon.
DSC curves of Fe84B8.5Si4.10P3.25C0.15 alloy ribbons with different thicknesses.

It is also known that the magnetic softness increases with a progress of annealing-induced structural relaxation as well as an increase in the degree of surface smoothness of the melt-spun ribbon. Consequently, we may conclude that the amorphous ribbon with a thickness just below the critical thickness for amorphous formation exhibits simultaneously higher corrosion resistance and better smooth surface, in addition to good magnetic softness.
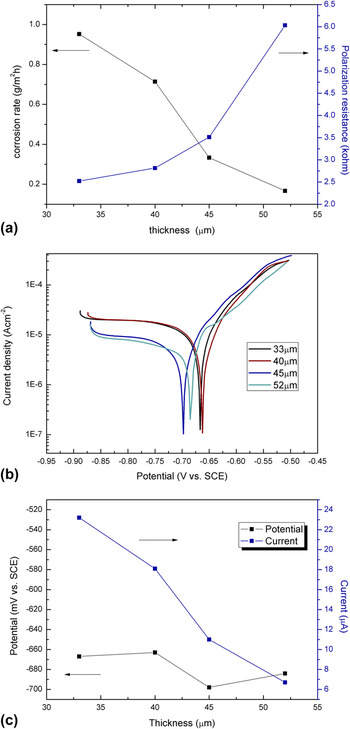
The corrosion weight loss results and polarization resistance are shown in Fig. 11(a). It is clear that the corrosion resistance increases with an increase of ribbon thickness. Electrochemistry results of corrosion current and polarization resistance shown in Fig. 11 also prove the same tendency. The enhancement of corrosion resistance with increasing ribbon thickness can be explained as follows: The thicker sample is produced at lower cooling rate, and hence the liquid alloy puddle is frozen at a lower surface energy state. This more stable state seems to cause the higher corrosion resistance. Besides, as shown in Fig. 9, the smoother surface of the thicker ribbon sample is also more favorable for the suppression in the progress of corrosive reaction.
Electrochemistry measurement results of Fe84B8.5Si4.10P3.25C0.15 alloy ribbons with different thicknesses in 3.5 mass% NaCl solution at 298 K: (a) Corrosion rate and polarization resistance-thickness plot, (b) polarization curves, (c) corrosion potential and current-thickness plot.

IV. DISCUSSIONS
The main target of this study is to synthesize Fe-based amorphous alloy ribbons exhibiting good soft magnetic properties with high-saturation magnetic flux density near 1.7 T as well as good corrosion resistance even in a thick ribbon state. It is known that the maximum ribbon thickness for amorphous phase formation is about 120 μm for Fe75Si10B15 and the large thickness can be obtained only by using a specially designed melt spinning equipment in which the rotating wheel at a rotation speed of 6000 rpm can be stopped within a short time of 1–2 s.Reference Hagiwara, Inoue and Matsumoto16 Such a rapid decrease in rotating velocity enables the good contacted state between the melt-spun ribbons and the copper wheel. The good contacted state can increase the critical thickness to 120 μm. On the other hand, in the case of using the conventional melt spinning equipment, it is rather difficult to obtain a good contacted state between the melt-spun ribbon and the rotating wheel surface and hence the resulting maximum thickness is usually about 50 μm.Reference Inoue, Shen and Chang17 Based on these previous results, the present maximum thickness of about 50 μm indicates that the present Fe84B8.5Si4.10P3.25C0.15 alloy has rather good amorphous forming ability in spite of the much higher Fe concentration. The high amorphous forming ability is presumably due to the simultaneous dissolution of four kinds of metalloid elements with significantly different atomic sizes of Fe > P ∼ Si > B ∼ C and large negative heats of mixing to Fe element ranging from −50 to −26 kJ/mol,Reference De Boer, Boom, Mattens, Miedema and Niessen18 in agreement with the three component rule for formation of bulk glassy alloys through the stabilization of supercooled liquid for metallic alloys.Reference Inoue19 It is reported that the increase in total metalloid content from 17 to 22 at.% in the maintenance of nearly the same concentration ratio among metalloid elements has enabled the production of Fe-based bulk glassy alloys with diameters up to about 3 mm.Reference Szewieczek, Baron and Nawrat20 The effectiveness of the simultaneous dissolution of the four metalloid elements is also consistent with these results.
When we compare the corrosion resistance in 3 mass% NaCl aqueous solution among the present Fe84B8.5Si4.10P3.25C0.15 amorphous alloy, conventional Fe78Si9B13 amorphous alloy,Reference Szewieczek, Baron and Nawrat20 and conventional stainless 18-8 steel,21 the corrosion potential (E corr) and corrosion current (I corr) are −675 mV and 29.9 μA/cm2, respectively, for the present amorphous alloy, −735 mV and 85,000 μΑ/cm2, respectively, for Fe78Si9B13 amorphous alloy, and −320 mV and 36 μA/cm2, respectively, for the stainless steel. These data indicate clearly that the present amorphous alloys possess better corrosion resistance than those of the other commercial Fe-based alloys. The better corrosion resistance is presumably because of the dissolution of P element, rather high stability of amorphous phase and rather high amorphous forming ability leading to the smooth surface of the ribbon. The effectiveness of P dissolution on the improvement of corrosion resistance in NaCl aqueous solution for Fe-based amorphous alloys has been interpreted to be due to the benefits from both the kinetics of passivation and the composition of passive film,Reference Pang, Zhang, Asami and Inoue22 being consistent with the present results. It is thus important to get a new knowledge that the good corrosion resistance can be maintained even for Cr-free Fe-based amorphous alloys with a high Fe content of 83 at.% in the case of the compositional optimization of four kinds of metalloid elements.
V. CONCLUSION
We examined the formation, thermal stability, magnetic properties, and corrosion behaviors of Fe–B–P–Si and Fe–B–P–Si–C amorphous alloys with high Fe contents of 83, 84, and 85 at.%, with the aim of developing new soft magnetic Fe-based amorphous alloys with high-saturation magnetization and good corrosion resistance. The results obtained are summarized as follows:
(1) Fe-based amorphous alloys exhibiting simultaneously high-saturation magnetization above and near 1.7 T and good magnetic softness as well as good corrosion resistance were developed by choosing some new alloy compositions of Fe83B9Si4.5P3.5, Fe84B8.5Si4.10P3.25C0.15, and Fe83B9Si4.5P3.1C0.4.
(2) The precipitation of bcc-Fe phase is dependent on total Fe content, while the stability of amorphous phase in the coexistence of bcc-Fe phase is dominated by the amount and kind of B, P, and Si metalloid elements because of the necessity of rearrangements between bcc-Fe and the remaining amorphous phases.
(3) Corrosion resistance was improved by the enhancement of thermal stability of amorphous phase resulting from the increase of B, P, and Si contents. In particular, the dissolution of P was effective to obtain better corrosion resistance.
(4) The increase in the ribbon thickness below 52 μm for Fe84B8.5Si4.10P3.25C0.15 amorphous alloy ribbons causes the increases in corrosion resistance and ribbon surface smoothness presumably because of the increase in the stability of alloy melt puddle on the rotating wheel surface.
(5) The Fe84B8.5Si4.10P3.25C0.15 amorphous alloy ribbons near the critical thickness of around 50 μm exhibit higher engineering values as is evidenced from the simultaneous achievements of good magnetic softness with high-saturation magnetization near 1.7 T, rather good surface smoothness and good corrosion resistance.