How is the social world of legislators constructed? Who do legislators work with on a day-to-day basis, and why? We know that political parties influence the daily working relationships of legislators (Ringe, Victor and Gross Reference Ringe, Victor and Gross2013), and social theory suggests that people build networks on the basis of shared traits (Goodreau, Kitts and Morris Reference Goodreau, Kitts and Morris2009). Yet, it remains unclear whether parties or personal traits have greater influence in producing legislative network ties. The lack of understanding of tie formation among legislators means that scholars know very little about what proportion of the variation in social cohesion stems from political parties (as organizations) versus individual member characteristics. Consequently, scholars do not have a good grasp of social cohesion in the legislative environment; including the causes of collaboration and how information and influence flow across the legislative environment. From a descriptive standpoint, scholars know almost nothing about which legislative offices deputies contact to discuss legislative issues, to socialize, or to seek relevant information on legislation. This study uses a new data set on three types of linkages between legislative offices in the Brazilian Congress to answer these questions. This paper examines communication networks, social networks, and information-seeking networks among Brazilian congressional offices.
Brazil provides a valuable and unique context to examine legislative networking. The Brazilian legislature is known for fragmented parties, high intraparty competition, and entrepreneurial candidates (Figueiredo and Limongi Reference Figueiredo and Limongi2000). Brazil’s proportional electoral system has very low electoral thresholds, permitting a large number of political parties. High district magnitudes and weak party list control generate high levels of intraparty competition, candidate entrepreneurism, and individual brand-building (Samuels Reference Samuels2008). Regional electoral districts produce candidates with regional and local policy mandates, sometimes with very small local constituencies (Ames Reference Ames1995).
As a result of this environment, cross-party affiliations are crucial to form coalitions and to meet local constituency demands (Calvo, Guarnieri and Limongi Reference Calvo, Guarnieri and Limongi2015). Thus, Brazil can be considered a “tough case” for party cohesion when compared to systems in the United States and Western Europe. Political parties ostensibly face huge challenges forging social cohesion within their parties, but little is known about whether this is actually the case. This paper explores this issue, and provides a window on the degree to which members of the Brazilian Congress tend to form ties within their own party versus outside. Parties cultivate horizontal associations (ties) among members, I argue, in order to facilitate collective action without resorting to institutional tools (e.g., changing names on party lists).
This paper will proceed as follows: I begin by drawing on existing literature on political networks and party unity/discipline to derive a theory of legislative networking and testable hypotheses. I then test these hypotheses in the context of the Brazilian Chamber of Deputies using exponential random graph models (ERGMs) on an original data set that allows for the exploration of party differences. Data come from a digital survey written by the author specifically for examining legislative networks. I find that parties, relative to personal traits, exert about the same level of influence on the formation of communication, social, and information-seeking ties of legislators in the Brazilian Congress.
PARTIES AND NETWORKS
What are legislative networks and why do they form? Legislative linkages are diverse—they include alliances, coalitions (Laver and Shepsle Reference Laver and Shepsle1996), resource exchanges (Katz and Mair Reference Katz and Mair1995), debating/discussing ideas, sharing information (Koger, Masket and Noel Reference Koger, Masket and Noel2010), providing legislative support (Fowler Reference Fowler2006; Bratton and Rouse Reference Bratton and Rouse2011), and coauthoring policy (Fowler Reference Fowler2006; Cho and Fowler Reference Cho and Fowler2010). Conceptually, legislative networks are collections of nodes in a legislative setting that bear some relation to each other. While there are many diverse types of linkages, this paper deals with genuine informal social and professional network ties between legislators.Footnote 1 Specifically, this paper analyzes self-reported interpersonal communication, social, and information-seeking ties.
The formation of interpersonal ties along party lines is consistent with various theoretical viewpoints. Some of the oldest scholarship on political parties recognized that political parties are composed of groups of close-knit, like-minded individuals (Key Reference Key1958). As this literature noted, unity in political parties arises endogenously from the interests of their members and the collective action problems surrounding electoral contests (Aldrich Reference Aldrich1995; Carey Reference Carey2007). Social network ties in a legislative context may arise for similar reasons. Party leaders should seek to build up cohesion in their own parties through a mix of professional and social events to build ties among members. Leaders may use such strategies in addition to traditional top-down enforcement strategies to ensure member discipline (Taagepera and Shugart Reference Taagepera and Shugart1993; Carey and Shugart Reference Carey and Shugart1995). While the parties literature has established many of the institutional correlates of party cohesion in voting, scholarship lacks an explanation for how party demands versus personal traits build social networks.
Of course, other work leaves many hints at how parties and demographics may conspire together to create legislative linkages. A broad literature on the formation of political parties describes the social origins of political parties, and their cohesion along salient social lines (Lipset and Rokkan Reference Lipset and Rokkan1967; Bartolini and Mair Reference Bartolini and Mair1990; Noel Reference Noel2014). Morse (Reference Morse1896) discusses how political parties are composed of men seeking to further their common interests in a sociopolitical group. Perhaps more prominently, numerous scholars have described parties as forming along distinct social cleavages, such as class-based social cleavages (Weber Reference Weber2009), religious cleavages (Kalyvas Reference Kalyvas1998), and other prominent sociostructural cleavages (Lipset and Rokkan Reference Lipset and Rokkan1967; Bartolini and Mair Reference Bartolini and Mair1990). Key (Reference Key1958), by contrast, asserts that political parties are not even social groups, as they share no noticeable characteristics. Nonetheless, on its face it does not seem much of a stretch to think that political parties form within homogeneous groups, and as a consequence have a higher likelihood of sharing interpersonal relationships with members of their own party than with other legislators. Yet, on the other hand, legislators face competing incentives to brand themselves in order to appeal to voters in their districts.
Parties have dual existences as organizations competing for elective office and as collections of individuals with competing interests. A primary motivation for legislators to work together within political parties is to gain re-election. Coordination within parties allows voters to sufficiently rank parties according to their own ideal points (Kitschelt et al. Reference Kitschelt, Hawkins, Luna, Rosas and Zechmeister2010). Political parties organize and consolidate swathes of voters around issues, they impose constraints on legislative action for legislators, they mobilize voters, they disseminate information, and they forge long-lasting political brands (Lipset and Rokkan Reference Lipset and Rokkan1967; Bartolini and Mair Reference Bartolini and Mair1990; Pattie, Johnson and Fieldhouse Reference Pattie, Johnson and Fieldhouse1995). Yet, such ends must be achieved against the individualistic tendencies of members to cultivate their own brands in an effort to increase their personal vote shares and electoral prospects. As such, party leaders may be inclined to facilitate social cohesion among legislators in order to counteract the disadvantages stemming from weak institutional control over legislators. Given that the party label is a collective resource within the party organization that can be eroded by individualistic behaviors, parties must develop linkages for building trust and transparency among members (credibility and monitoring (Ostrom Reference Ostrom1990)) to prevent self-interested behaviors in a weak institutional environment. Networks create trust among actors through repeated exchanges, which allow actors to monitor one another and establish credibility (Ostrom Reference Ostrom1990). Research has shown that the structure of networks is related to the formation of trust and reputations within groups (Putnam Reference Putnam1992; Carpenter, Esterling and Lazer Reference Carpenter, Esterling and Lazer2004; Heaney Reference Heaney2014).
In light of this, legislative networks may be important for establishing coordination within political parties. For effective coordination to occur, a given candidate must know that the other members of her party will make approximately the same political choices, otherwise there is no benefit to coordinating. To create credible commitments of coordination, political parties might provide professional and social opportunities for members to communicate about legislative issues, to interact socially, and to centralize information. In practice, this may involve organizing professional meetings, informal discussion groups, lunches, and coordinating attendance at social and entertainment events. Over the course of these informal interactions, legislators build strong relationships with other members of their party, such that they are less inclined to cultivate their own ties outside the party.
There are reasons to expect parties to have a greater effect on network formation compared with personal traits. Political parties lay claim to a party label signifying a political agenda to be executed through collective means, and the infrastructure of collective action is a web of genuine linkages for monitoring other members and coordinating votes. Parties may centralize information as a means to drive party cohesion—so that information can be communicated through informal pathways spanning out from those most loyal to the least loyal. Party efforts at establishing cohesion could generate stronger cohesion between partisans in order to counteract personal networks.
In conclusion, there is reason to suspect that partisanship will have the strongest effect on network tie formation, as there are many reasons for parties to work to establish legislative ties among their members. Legislative ties provide opportunities for monitoring behavior, creating trust and reputation, and coordinating legislative action.
Hypothesis 1: Baseline expectation: Legislators will be more likely to form links with members of their own party compared to other parties.
Hypothesis 2: Parties over traits: The effects of partisanship on tie formation should outweigh the effects of personal traits. That is, the probability of a tie in a co-partisan dyad should be higher than the probability of a tie in a dyad sharing an individual trait, all else equal.
Lest the reader conclude that these hypotheses should too easily be confirmed, let us next consider the forces which pull legislators in the opposite direction. That is, let us address the incentives for a legislator to cultivate political ties on the basis of personal traits. Clearly, personal ties and party ties frequently overlap, as a legislator may have friends that are both socially/demographically similar to them and co-partisans. However, legislators have limited time and resources to expend maintaining relationships with other legislators, so the specific choices they make about who populates their network illuminate the drivers of horizontal associations among legislators. Partisans in Brazil are frequently characterized by their disunity and disloyalty (Desposato Reference Desposato2006; Kitschelt et al. Reference Kitschelt, Hawkins, Luna, Rosas and Zechmeister2010), leading one to suspect that personal traits will dominate network tie formation.
PERSONAL TRAITS AND NETWORKS
The institutional configurations of a party system influence a party’s internal organization, particularly the level of personal vote-seeking among its members (Carey and Shugart Reference Carey and Shugart1995; Cox Reference Cox1997). By now, it is accepted wisdom that the institutional conditions under which a party competes affects its internal structure, via the vote-seeking behaviors of its members. Lack of party control over certain types of goods that members desire—such as electoral list positions, campaign monies, district location, and other goods—affects how highly members prioritize the party brand over their personal brand. Similarly, we know that electoral systems affect the voting behavior of members as well—members in systems with elections held at the local level (regionally defined districts) tend to endorse local policy against national policy (Samuels Reference Taagepera and Shugart2000). This logic leads one to ask whether these same features produce observable differences in networking among legislators. Do legislators more readily cultivate “personal” ties over “party” ties? In other words, are network edges more likely between legislators of the same political party or between legislators with the same personal attributes?
Candidate entrepreneurism occurs under conditions of poor institutions for party enforcement and high intraparty (and interparty) competition (Samuels Reference Samuels2008). Because Brazil is a case of few rules to enforce discipline within the party, candidates often work to create their own personal brands rather than follow the party line. Candidates also construct their own channels of information exchange with partisans of their choosing. Because entrepreneurial candidates eschew the overarching institutional structure of a party dictating the channels (network links) they communicate through, candidates utilize the physical and social conditions around them to form their legislative networks. They may seek other candidates who are easily accessible (i.e., proximate) and similar to them. As a consequence, the personal traits of such legislators provide strong motivation for forming legislative links.
Local electoral mandates produce ties by creating strong pressures for legislators to coordinate with other legislators elected from the same constituency (Samuels Reference Taagepera and Shugart2000; Lieberman Reference Lieberman2003). Brazil has 26 states and a federal district from which seats are awarded proportionately on the basis of the highest vote shares. When a politician must maintain support at the state level, there is an underlying need for regional coordination among legislators from the same state (Samuels Reference Taagepera and Shugart2000). Similar to the incentives of political parties, legislators will need to exchange information about what is demanded locally and what other politicians are willing to support. Failure to secure critical information about the expected behaviors of other politicians from the same state may result in a failure to respond appropriately. As such, even if legislators disagree with one another, it is expected that regional constituencies should generate a high level of interaction between them.
At the same time that the Brazilian institutional context renders party cohesion difficult to achieve, it may spur politicians to work more frequently with legislators who share social traits. The entrepreneurial and often personalistic nature of politics in Brazil may lead to network formation on the basis of personal traits and proximity. Legislators may create their own linkages with colleagues in order to channel independent sources of information, resources, and brand-building. I expect members will tend to connect with each other on the basis of age, education levels, and physical proximity in the Congress. This idea is consistent with other legislative network studies which find that physical proximity and personal traits have appreciable effects on tie formation in the US Congress (Masket Reference Masket2008; Craig et al. Reference Craig, Cranmer, Desmarais, Clark and Moscardelli2015). Legislators of similar age levels should connect on the basis of shared experiences within their age group. Members with similar education levels should connect because they share similar levels of knowledge and are from similar social classes. The placement of legislative offices within the Congress building should create opportunities for interaction.Footnote 2
Hypothesis 3: Personal traits: Legislators will be more likely to form network ties with legislators who have similar personal traits compared to legislators with different personal traits.
Since personalistic linkages can be the result of counter-incentives to party cohesion within the institutional environment (e.g., lack of party control over candidate lists), it is worth empirically evaluating which is in fact more powerful. Candidate entrepreneurism in the electoral environment might influence network formation on the basis of personal traits, but party leaders may seek to counteract these forces by informal means. If so, scholars might know less about party cohesion than they think—party cohesion could be much higher than observed from personal vote-seeking and voting behavior alone. We turn next to empirically analyzing the relative strengths of “personal” and “party” factors on network formation.
NETWORK ANALYSIS
Eliciting network ties is a vague and difficult process. Two people may disagree about whether they share a tie, depending on how a network question is worded, or they may disagree about the nature of the relationship. For example, a simple question such as “Do you often have lunch with Brian?,” could easily be misinterpreted. Does it count as lunch if only one person eats? What kind of a relationship does that constitute? This vagueness means that networks of each type might be interpreted slightly differently, so measuring multiple networks is better than measuring only one.Footnote 3
Network questions can also be tiresome for respondents to answer. A person may interact with many people in a given day, week, or month, in various contexts, but it is highly taxing from a cognitive standpoint to recall everyone with whom a person interacts. A respondent may quickly be exhausted after answering a couple of network questions. In order to address this issue, I implement a digital survey design specifically created to aid respondents in recalling network ties more easily than existing methods by embedding interactive search features within the survey questions (see details in the following section).
Network links are measured as reported relationships between offices of legislators in the Brazilian Congress. Legislative offices form relationships with other legislative offices, which represent important real relationships between legislators themselves. Office managers and senior staff are frequently instructed to communicate or cooperate with various other offices on behalf of the Congressperson in her absence. Research suggests that office staff are very frequently executors of legislators’ interests, and expand their influence by doing so (DeGregorio Reference DeGregorio1988; DeGregorio Reference DeGregorio1995). The reason for measuring network ties in this way is also practical. Congress people in Brazil are usually only in the Chamber building on one day per week—on Tuesdays—when legislation is presented and debated on the Chamber floor. Legislators’ staffers, however, are available five days per week. When congressional deputies are in their offices, they are meeting with representatives of their districts who are lobbying for various pieces of legislation. Finally, even when a deputy agrees to participate in a study, they often pass off the responsibilities to their office managers or low-ranking staff. The sampling strategy sought participation from the staffer most familiar with inter-office interactions.
Survey Data
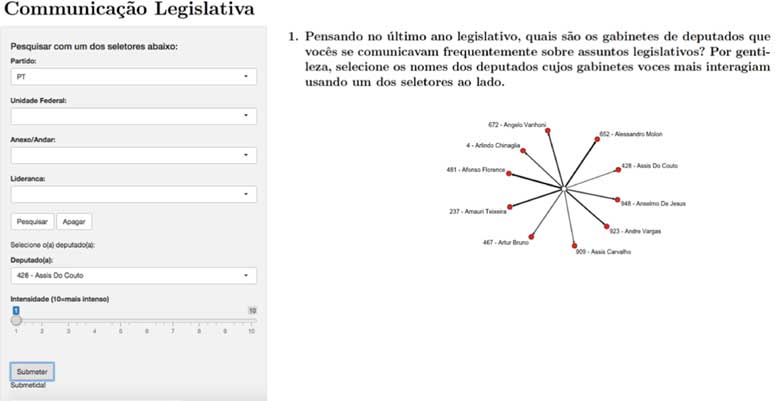
The primary network data come from an original interactive digital survey conducted within the Brazilian Chamber of Deputies in the summer of 2014. Between June and July of 2014, I visited every legislative office in the Brazilian Chamber of deputies, Brazil’s equivalent of the US House of Representatives. I asked the office manager (chefe de gabinete) or staff member with the most experience related to inter-office communication to participate. One participant from each office then filled out the survey on a touchscreen computer (Figure 1).
Screen shot of digital survey

The digital survey worked as follows. After reviewing a simple consent page with details of the study, participants were presented with a screen with a panel of search boxes and one sliding bar on the left-hand side, a mostly empty space with a circle in it to the right, and a survey question at the top. After reading the question, users could use each of the search boxes to search for an office with which their office interacts. Users could search based on party, leadership status, Congress building, and state. When a participant selected a deputy office from a list produced by the search function, the survey would present an image of the ego-centric network (a network from the respondent’s own perspective) of the participant’s choices. This allowed participants to record their answers for later reference and to better understand what the office’s ego-centric network looks like. It also had the benefit of making the survey enjoyable for the participants relative to a pen-and-paper survey.
The survey asked three questions related to communication, socializing, and information-seeking with other legislative offices. I requested participation from the office manager (chefe de gabinete), or alternatively the staff member with the most experience related to communication and cooperation between legislative offices.
Survey wording: communication network
Thinking about the last legislative year, which deputy offices did your office frequently communicate with about legislative issues? Please select the names of the deputies whose offices you most interacted with using the selectors to the side.Footnote 4
Survey wording: social network
Thinking about the last legislative year, which deputy offices did your office frequently communicate with to socialize, converse casually, or discuss non-legislative issues? Please select the names of the deputies whose offices you most interacted with using the selectors to the side.Footnote 5
Survey wording: information-seeking network
Thinking about the last legislative year, which deputy offices did your office frequently seek to resolve questions about legislative proposals or procedures? Please select the names of the deputies whose offices you most sought using the selectors to the side.Footnote 6
The survey achieved a 25 percent response rate across the entire Brazilian Congress in the 2014 survey (out of 513 deputies). Without further data collection, we are left with what may be described as a “sample” of a network. However, from a methodological perspective, one should avoid sampling from a network (Kossinets Reference Kossinets2006). A network is a single unit composed of vertices and edges representing a pattern of relations. Missing data can be highly problematic in networks, because ties are mutually dependent or endogenous, and without adequate statistical treatment there is bias in coefficients toward 0 (Burt Reference Burt1987). In addition, missing data can cause inconsistency in estimates of centrality (Kossinets Reference Kossinets2006). In order to address this problem, I supplement linkages in the 2014 data with a survey from 2013 that asked nearly the same questions using a pen-and-paper survey.Footnote 7 This approach increases the response rate to 45 percent.Footnote 8 In supplemental analyses, I also employ multiple imputation to restore the missing edges in the remainder of the data using methods designed for graph data (Hunter et al. Reference Hunter, Handcock, Butts, Goodreau and Morris2008).
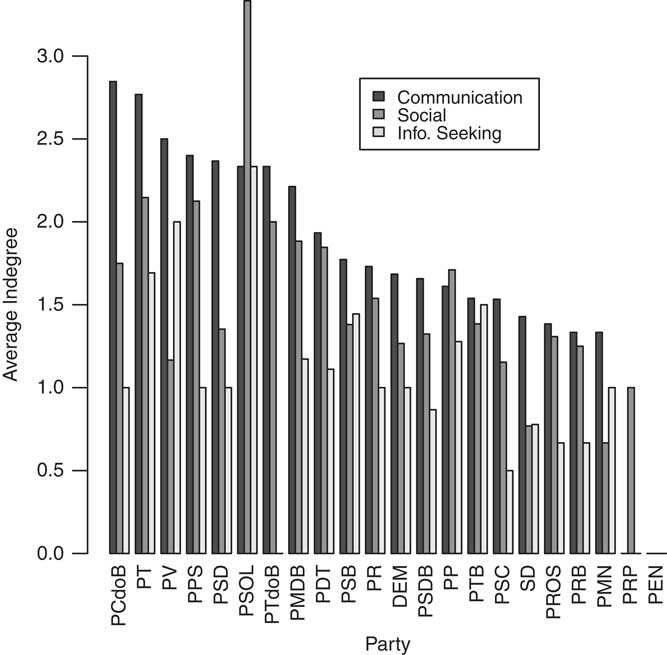
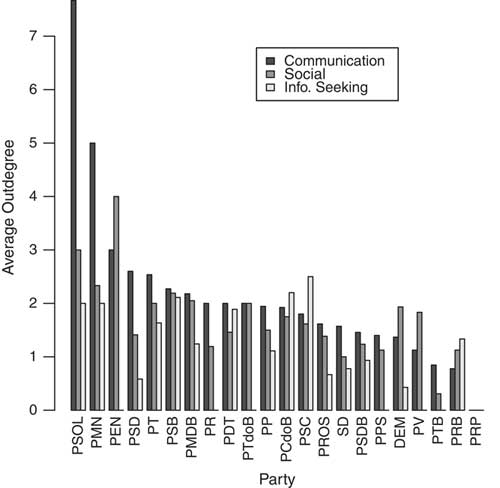
In Figures 2 and 3, I plot the average number of incoming and outgoing connections by party in each type of network. In each graph, the parties are ordered from the most communication links to the least (dark bars). In Figure 2, the parties with the most incoming communication links are the Communist Party of Brazil, the Worker’s Party (PT), and the Green Party. The ranking is slightly different for outgoing communication links, with the Socialist and Freedom Party (PSOL), Party of National Mobilization, and the National Ecological Party (PEN). For social networks, the parties with the most incoming links are the PSOL, the PT, and the Popular Socialist Party (PPS), and the most outgoing links are the PEN, the PSOL, and the PPS. For information-seeking relationships, the parties with the most incoming links are the Brazilian Worker’s Party (PTdoB), the PEN, and the PSOL, and the most outgoing are the PTdoB, the PEN, and the Social Christian Party. Interestingly, many of the most highly connected parties are the small–medium-sized parties, rather than larger more powerful parties. While the successful Worker’s Party has a relatively high number of linkages, the other large Brazilian parties—the Brazilian Democratic Movement and the Brazilian Social Democracy Party—have below average numbers of linkages.
A barplot of the average incoming links by party

A barplot of the average outgoing links by party

To check for representativeness, selection bias, and sensitivity of the survey, I collected complete biographical data on each of the deputies, then conducted t-tests to examine whether the means and distributions of the observable traits of deputies in the sample were different from those not included in the sample. I found that the deputies whose offices responded to the survey were no more likely to be in leadership positions, had approximately the same level of legislative experience (measured by the number of legislative mandates), were not more likely to be old or young, and were not more likely to be educated compared to those offices that did not respond to my survey. However, women are oversampled in the survey, thus respondents are more likely to be women. Finally, with regard to sensitivity, I had very few offices (<5) refuse to take the survey and/or state the reason to be sensitivity concerns. Office staffers are instructed to respond to survey researchers, and because the survey did not pry very deeply into the content of the connections between legislative offices, staffers reported the survey to be of relatively low risk. I detected no observable differences between my sample and the Congress population on the observable traits I collected.
Deputy Data and Brazil’s System
Biographical data about the legislators was acquired from the Brazilian Chamber website (http://www2.camara.leg.br/) using web-scraping techniques. From the biographical pages of each deputy, their age, number of mandates (to the Congress), education (divided into categories as pre-high school, high school, college, and above college), political party, home state, and office floor were collected. The deputies in my sample report roughly the same distribution of education and levels of Chamber experience (number of legislative mandates) as in the Chamber of deputies.
Brazil has a strong federal system composed of 26 states (27 constituencies including the federal district). Each state elects some number of deputies approximately commensurate with its population size. District magnitudes vary in size from 8 to 70 deputies. In elections, voters have the option to cast a ballot for a person or for a party, but Brazil has a fairly low rate of party voting (Samuels Reference Samuels2006). Voting lists are open, their order being determined by the vote totals of the candidate, rather than the party. Despite the importance of the individual in this system, Brazilian law requires candidates to run under a party label, and must have affiliated with the party for at least a year. However, partisans frequently take advantage of their ability to switch parties. The personalistic nature of Brazil’s system render it a useful case for study on network formation, because the institutional makeup of Brazil incentivizes deputies to form networks to gather information and support for personal success. For example, legislators in Brazil typically rely on campaign contributions from state-level contractors to fund their re-election campaigns (Samuels Reference Samuels2001). In order to acquire these funds, legislators must submit budgetary amendments that bring pork to their districts. The amendments must pass through a budgetary committee and are subject to review by the president. Legislator amendments must specify sources of funding and cannot increase the overall budget; so legislators must be judicious about the amendments they submit. In this process, the ability to acquire accurate information about the considerations of the committee, the leadership, and the president pays substantial dividends.
Model and Results
Exponential random graph modeling is the empirical strategy I employ here. ERGMs are network models used to understand why relationships (ties) of various types form. ERGMs provide parameter estimates via maximum likelihood techniques similar to commonly used approaches such as logit or probit, but with a few important differences. In fact, it is possible to think about a simplified ERGM model, which is identical to a model for a typical binary outcome such as a logit or probit model. Under the assumption of no complex dependence among ties, for example, one could use a logit regression to estimate the presence of a network tie in a dyad. In order to make such an estimate, a logit model finds the most likely parameters given the observed data by deploying an algorithm that “climbs the hill” to find the maximum of a likelihood function.
The same method is not applicable to network data because the likelihood is not as easy to define—one must know the distribution of all possible networks, creating a combinatorial explosion of possible networks.Footnote 9 ERGM’s estimate an empirical likelihood by making many draws from a set of random networks based on principles of Markov Chain Monte Carlo (MCMC). The parameter estimates are derived by finding the maximum likelihood from this MCMC-generated distribution. This allows ERGM’s to incorporate complex interdependencies among ties, such as reciprocity and transitivity.
Using these principles, the ERGM framework treats an observed network as one realization among a set of possible realizations of the network. Given any set of coefficients, ERGM’s render it possible to calculate the likelihood of a randomly drawn network. Using this technique, it is possible to create marginal distributions of the coefficients from which it is possible to make inferences about causal effects and variances of covariates of interest.
The ERGM equation is
 $$P_{{\theta ,y}} \left( {Y{\equals}y\!\mid\!X} \right)\, {\equals}\, {{{\rm exp}\left( {\theta ^{T} g\left( {y,X} \right)} \right)} \over {k\left( {\theta ,\gamma } \right)}},y\in\gamma ,$$
where θ is a vector of coefficients to be estimated, g(y) a vector of statistics from an adjacency matrix, and k(θ,γ) a normalizing constant which defines all possible networks, γ. The log-odds of a tie is given as
 $${\rm logit}\left( {Y_{{ij}} \, {\equals}\, 1} \right)\, {\equals}\, \theta ^{T} \delta \left[ {g\left( {y,X} \right)_{{ij}} } \right],$$
δ[g(y,X) ij ] is the change in network statistics g(y,X) produced when Y ij goes from 0 to 1. This “changescore” allows one to calculate the conditional log-odds of the network given any value of g(y,X) ij (Hunter et al. Reference Hunter, Handcock, Butts, Goodreau and Morris2008; Goodreau, Kitts and Morris Reference Goodreau, Kitts and Morris2009).
There are many structural features of the network that may be modeled, but of importance for my question here is transitivity, or the tendency for “friends of friends to become friends.” If members trust one another’s judgment, they are likely to trust their choice in friends and forge ties with the same people (Carpenter, Esterling and Lazer Reference Carpenter, Esterling and Lazer2004).
I use ERGMs to examine hypotheses related to the formation of different types of ties among legislators in the Brazilian Chamber of Deputies. I test whether tie formation is driven by the partisanship versus the personal traits of deputies. I examine the relative strength of partisanship in comparison to experience, age, education, physical proximity within the Congress building, and transitivity (whether friends of friends also become friends) on tie formation. All models were fitted in R using the ERGM package (Hunter et al. Reference Hunter, Handcock, Butts, Goodreau and Morris2008).
What the ERGM analysis reveals is the cohesive power of political parties in an environment often characterized as having incohesive parties. In fact, I find that partisanship is just as strong a predictor of network tie formation as state membership. This is important because as I note above, prior literature has elaborated the large role that state connections play in re-election for deputies in Brazil (Samuels Reference Samuels2008). This hints that networks may play a key, yet often unobserved, role in party cohesion. My findings can be summarized as follows. First, I find that partisanship exhibits an effect as strong as state membership on tie formation across communication and social networks, but plays a stronger role than state membership in information-seeking networks. Second, I find that personal traits exhibit appreciable impacts on tie formation among legislators.
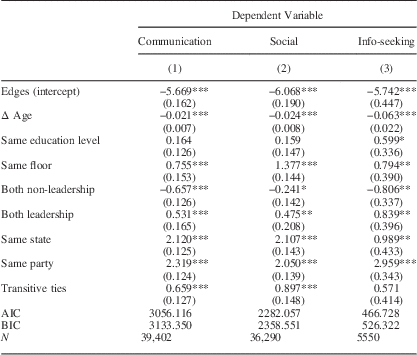
In Table 1 I present the results of three ERGM models, one for each type of network, estimating the effects of all partisan and personal covariates of interest.
Exponential Random Graph Models Main Results

Note: AIC=Akaike information criterion; BIC=Bayesian information criterion.
*p<0.1, **p<0.05, ***p<0.01.
In order to demonstrate how partisanship affects tie formation based on the models, we can calculate the expected probability of a tie between deputies by specifying values for each of the covariates in a model, multiplying by the estimated coefficients, summing, and exponentiating.Footnote 10 Doing so, we find large differences in the probabilities of tie formation among co-partisans versus non-co-partisans. The probability of a communication tie between co-partisans is 0.12 compared with 0.01 between non-co-partisans. The probability of a social tie between co-partisans is 0.23 compared to about 0.04 between non-co-partisans. The probability of an information-seeking tie between co-partisans is 0.15 compared to about 0.01 between non-co-partisans. The effect of partisanship in information-seeking networks is stronger than state membership,Footnote 11 suggesting that parties may centralize information to drive party cohesion. In addition, we can tell from the analysis that the effects of partisanship are not purely due to leaders interacting with the rank-and-file, because the effects of leadership are estimated in the model. Therefore, many of the ties formed between co-partisans must be among rank-and-file members, rather than between party leaders and rank-and-file members.
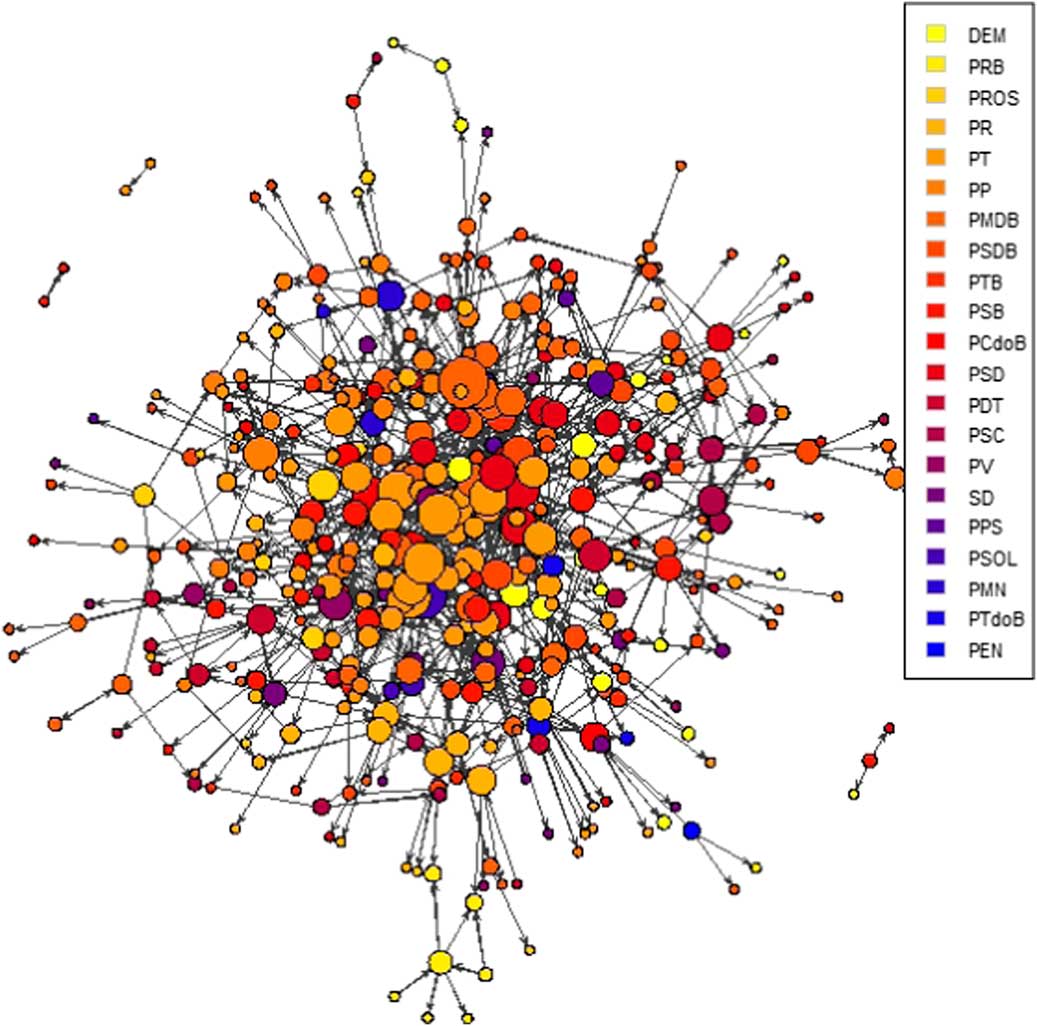
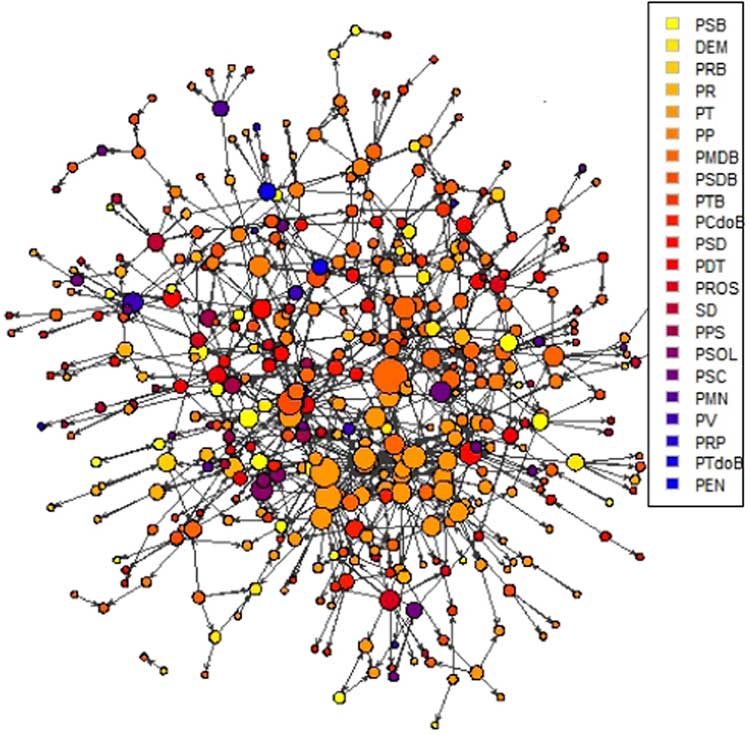
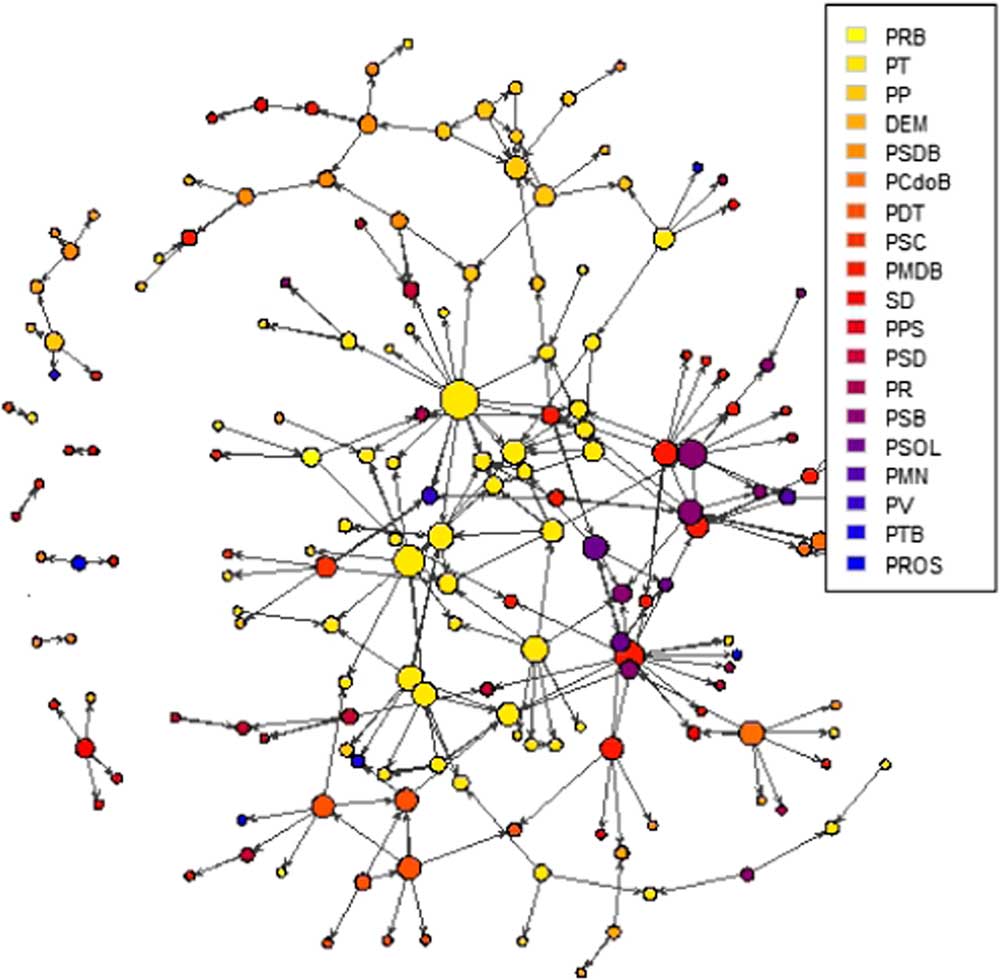
In Figures 4 to 6, the effect of partisanship is more directly observable. The different colors in these images represent different parties, and the size of the nodes reflects their degree centrality (the number of incoming links plus the number of outgoing links). It is visible that parties tend to cluster together, with the most central cluster in all the networks being the Worker’s Party (Partido dos Trabalhadores).
A projection of the communication network Note: The projection algorithm is the Fruchterman–Reingold, and places central actors closer to the center of the projection. Node size is determined by
 $$\left( {Indegree{\plus}Outdegree} \right)^{{{1 \over 2}}} $$
.

A projection of the social network Note: The projection algorithm is the Fruchterman–Reingold, and places central actors closer to the center of the projection. Node size is determined by
 $$\left( {Indegree{\plus}Outdegree} \right)^{{{1 \over 2}}} $$
.

A projection of the information-seeking network Note: The projection algorithm is the Fruchterman–Reingold, and places central actors closer to the center of the projection. Node size is determined by
 $$\left( {Indegree{\plus}Outdegree} \right)^{{{1 \over 2}}} $$
.

Age exhibits a fairly weak effect on tie formation. Legislators of the same age have a slightly >0.01 probability of forming a communication tie if they are the same age, and this already small probability declines by a tiny amount if they are ten years apart (the SD of age is about 11). For social ties, legislators of the same age have a roughly 0.05 probability of forming a tie compared to 0.04 for legislators ten years apart. For information-seeking ties, the probability of legislators of the same age forming a tie is about 0.02, and this declines by a small amount if legislators are ten years apart to about 0.01 (0.008).
Physical proximity, specifically having an office on the same physical floor as another deputy, exerts a statistically significant but substantively mild effect on tie formation. While two legislators who have offices on the same floor in the Congress building are nearly twice as likely to form communication ties compared to legislators with offices on different floors, nearly four times as likely to form social ties, and approximately two times more likely to form information-seeking relationships; the substantive probabilities are actually fairly small. To be more specific, the probability of a communication tie between two legislators on the same floor is a little over 0.01, while it is about 0.006 between legislators on different floors. For social relationships, the probability of forming a tie is 0.04 between legislators on the same floor compared to 0.01 for legislators on different floors. For information-seeking ties, the probability is about 0.01 for legislators on the same floor and about 0.004 for legislators on different floors.
Hierarchy in the congress also influences tie formation. The results here suggest that party leaders are more likely to share ties with other leaders than with non-leaders. A leader is roughly 70 percent more likely to form communication ties with other leaders compared with rank-and-file deputies. The probability of a communication tie between a leader and a rank-and-file member is about 0.03 compared to about 0.04 between leaders. A leader is 61 percent more likely to form social ties with other leaders, which amounts to about a 0.05 probability of a social tie between leaders and rank-and-file compared to 0.07 between leaders. For information, a leader is 2.3 times more likely to form information-seeking ties with other leaders, which may sound large, but the probability of an information-seeking tie between a leader and a rank-and-file member is 0.02 compared to about 0.04 between leaders.
Finally, as one would expect from the Brazilian case, there are strong regional effects that are observable from the models. Legislators from the same state are more likely to form all types of relationships than legislators from different states. This effect is about as strong as partisanship, as its coefficients are not significantly different from those of partisanship in the models of communication and social ties (p>0.05, see footnote 11). Examining the coefficient of “same state,” we observe that legislators from the same state are roughly eight times more likely to form communication and social types of relationships than legislators from different states. For information-seeking relationships, legislators from the same state are about 2.7 times more likely to form relationships compared to legislators from different states. These effects are more striking when stated in terms of probabilities. For communication ties, the probability of a tie between legislators from the same state is about 0.10 compared to 0.013 between deputies from different states. For social relationships, the probability is about 0.24 between legislators from the same state, whereas it is only about 0.04 between deputies from different states. For information-seeking ties, the probabilities are smaller—legislators from the same state bear about a 0.02 probability of forming information-seeking ties, compared to about 0.01 for deputies from different states.
To check for the robustness of the model, I tested alternative specifications that control for the effects of ideology (based on the entire corpus of voting records for this session of Congress) (Poole and Rosenthal Reference Poole and Rosenthal2001).Footnote 12 I find the effects of partisanship to be robust to alternative specifications and modeling choices (see Online Appendix Table 2). The coefficient for partisanship declines only slightly when ideology is included, and remains substantively important. In addition, I test for proper mixing and overall convergence in the MCMC routine, which produced satisfactory levels of mixing and good convergence. More discussion of these tests and alternative models can be found in the Online Appendix.
Conclusion
This paper has important implications for policy vis-à-vis cooperation and coordination among legislators. The results suggest that even in fragmented, personalistic, regionally based contexts, legislators tend to sort into networks based on party membership to the same degree as state membership. Party membership tends to foster dense intraparty interactions in a variety of contexts, even once controlling for the tendency for leaders to communicate information to the rank-and-file. The party, in contrast to what some literature would lead us to suspect, comprises a considerable effect on the network tie formation of legislators. Further, these ties are not simply professional discussion/collaboration links, but personal social ties. Thus, partisanship carries quite substantial social intraparty bonds.
Why? The theory that I have presented here postulates that party leaders play key roles in fostering intraparty associations. Leaders create opportunities for legislators to interact in a variety of contexts and to create social and communication links. The theorized purpose of these links is to provide monitoring opportunities and establish the reputations of co-partisans so that co-partisans can work and vote together more predictably and more effectively. The end result is higher intraparty cohesion, and quite possibly, more effective collective action.
Do these findings generalize to other contexts? Brazil is frequently cited as the poster child of weak institutions and personalistic politics. If parties can foster intense intraparty interaction in this context, then these effects should be equal or greater in other contexts. It is likely that networks may play a larger role in legislatures than political scientists have heretofore examined. This paper provides an empirical test to growing evidence that suggests networks matter for explaining important political phenomena. In sum, despite what has long been cited as a fraught context with weak institutional rules to enforce party discipline, the party is a strong source of social cohesion among partisans in the Brazilian legislature. These findings suggest that it is party leaders that seek to build up network ties within their parties, in order to foster intraparty cohesion and the prerequisites of collective action. The empirical results suggest that intraparty cohesion is quite substantial and spans communication, social, and information-seeking ties.