1. Introduction
The potential gains from cooperation in international monetary policy is a classic question whose relevance has been brought again to the fore by the adoption of unconventional monetary policy in response to the great recession and, more recently, to the COVID-19 pandemic. Unlimited quantitative easing forces trade partners to inject excessive liquidity in order to avoid worsening terms of trade. Footnote 1 This may lead to an undesirable regime of competitive devaluation. In such a context, a mechanism that properly weighs domestic versus international gains in order to foster monetary policy cooperation is likely to be more beneficial than ever. A growing literature investigates the international monetary policy problem within a general equilibrium framework. Exchange rate pass-through is often considered an important factor in the policy design. Two types of exchange rate pass-through are generally used in literature: producer currency pricing (PCP), in which pass-through is complete, and local currency pricing (LCP), in which no pass-through exists. However, some scholars indicate no gains from international monetary policy cooperation in either PCP or LCP models (Corsetti and Pesenti (2005,Reference Corsetti and Pesenti2008); Corsetti et al. (Reference Corsetti, Dedola and Leduc2010); Devereux et al. (Reference Devereux, Engel and Tille2003)), while others reveal contrasting results (Clarida et al. (Reference Clarida, Gal and Gertler2002); Obstfeld and Rogoff (Reference Obstfeld and Rogoff2002); Canzoneri et al. (Reference Canzoneri, Cumby and Diba2005)).
Our study builds a simple two-country dynamic general equilibrium model with incomplete exchange rate pass-through. To extract the relationship between exchange rate pass-through and cooperation gains, we assume that the intratemporal elasticity of substitution between domestic and import goods equals the inverse of the intertemporal elasticity of substitution in consumption, and both equal one. Footnote 2 With this assumption, no gains exist from cooperation under PCP or LCP, as many models have demonstrated. However, cooperation gains are evident when exchange rate pass-through lies in the middle range. In addition to Corsetti and Pesenti (Reference Corsetti and Pesenti2005), we explore an explicit interest rate rule and analyze how a self-interested and cooperative central bank uses the interest rate to react to exogenous shocks under different degrees of pass-through. Several results of the analysis are worth highlighting as follows.
First, the cooperation policy is not necessarily identical to the Nash policy. Cooperation gains exist under incomplete exchange rate pass-through in which the externality of terms of trade remains. These gains are derived from internalizing the externality of terms of trade by cooperation. Second, there are asymmetric incentives for countries to cooperate: the higher the degree of exchange rate pass-through, the more the incentive for the country to cooperate. Furthermore, when the degrees of exchange rate pass-through of two countries significantly differ, cooperation might improve the welfare of the country with a high pass-through, while worsen that of the country with a low pass-through. In this case, the incentives of two countries to cooperate are contradictory. Third, the cooperation policy raises variations in exchange rates. High variations in exchange rates help smooth the shocks across countries by adjusting the terms of trade. Thus, there seems no benefit in adopting fixed exchange rate regime in the benchmark model. However, if we add the assumption that the central bank is incapable of controlling monetary policy perfectly, high monetary disturbance may force the country to switch to a fixed exchange rate regime. The degree of exchange rate pass-through and the size of the country significantly influence on the choice of an exchange rate regime. A fixed exchange rate regime is preferred especially for small countries with a high degree of exchange rate pass-through.
Related literature. Corsetti et al. (Reference Corsetti, Dedola and Leduc2010) and Devereux et al. (Reference Devereux, Engel and Tille2003) demonstrate that the cooperation policy, in a two-country model with nominal price rigidity, imperfect competition and without nontradable goods, is identical to the noncooperation policy under PCP and LCP, that is, there are no cooperation gains. Footnote 3 Corsetti et al. (Reference Corsetti, Dedola and Leduc2010) term this phenomenon as “divine coincidence”: price dispersion within categories of goods automatically corrects any possible misalignment in the relative prices of domestic and foreign goods. This divine coincidence can be avoided in several ways. Benigno and Benigno (2003,Reference Benigno and Benigno2006) relax the assumption of the unit intratemporal elasticity of substitution between domestic and foreign goods and observe cooperation gains under PCP, except when the intratemporal elasticity equals one or the inverse of the intertemporal elasticity of substitution in consumption. Footnote 4 Canzoneri et al. (Reference Canzoneri, Cumby and Diba2005) add a nontradable sector into this model under PCP. They observe that cooperation gains are generated when the technological shocks of the tradable and the nontradable sectors are not completely correlated. In a sticky wage model, Obstfeld and Rogoff (Reference Obstfeld and Rogoff2002) demonstrate the absence of cooperation gains in addition to the special case that the intertemporal elasticity of substitution in consumption equals one. In this model, exchange rate pass-through is complete, as in the case of PCP. Furthermore, Liu and Pappa (Reference Liu and Pappa2008) extend this model to asymmetric trading structures and observe potential cooperation gains under PCP. In addition, Corsetti et al. (Reference Corsetti, Dedola and Leduc2010) indicate cooperation gains in a model with LCP and asset market imperfections. A review of the existing literature reveals that the sources of cooperation gains are diversified, though mostly related to terms of trade externality. Footnote 5
Terms of trade externality is an important channel in international monetary transmission (Chang et al. (Reference Chang, Chang, Tsai and Wang2019); Ji and Seater (Reference Ji and Seater2020); Gu (Reference Gu2021); Yilmazkuday (Reference Yilmazkuday2021)). A country’s monetary policy may affect those of others through the terms of trade movements. If this externality is negative, a country’s optimal policy, irrespective of the cost of such externality, may be overreactive compared with globally optimal policy. If this externality is positive, a country’s optimal policy is likely to be underreactive. Cooperation gains are evident only in a few models because these models consider externality. When the intratemporal elasticity of substitution between domestic and foreign goods equals the inverse of the intertemporal elasticity of substitution in consumption, the externality vanishes under PCP and LCP, that is, divine coincidence occurs. However, this externality exists only in general cases (Benigno and Benigno (2003,Reference Benigno and Benigno2006)). Thus, the occurrence of externality of the terms of trade depends on model specification.
The externality of terms of trade largely relies on the levels of exchange rate pass-through. However, a majority of the previous studies have focused on only two extreme cases, PCP and LCP. The implications of incomplete exchange rate pass-through on international monetary policy cooperation have not been thoroughly investigated in literature. However, Corsetti and Pesenti (Reference Corsetti and Pesenti2005) consider intermediate pass-through after studying PCP and LCP cases and believe that cooperation gains are associated with exchange rate pass-through levels in a nonmonotonic way. However, the explicit relationship between cooperation gains and exchange rate pass-through remains an unresolved issue. This study addresses this gap.
Recent literature has emphasized the importance of “vehicle currency pricing” and particularly “Dominant Currency Pricing” (DCP). Gita Gopinath’s studies demonstrate that the US dollar drives global trade prices (i.e. DCP) rather than bilateral exchange rates (Boz et al. (Reference Boz, Gopinath and Plagborg-Moller2019); Gopinath et al. (Reference Gopinath, Boz, Casas, Diez, Gourinchas and Plagborg-Moller2020)). In addition, Gopinath et al. (Reference Gopinath, Itskhoki and Rigobon2010) indicate the case when the choices of invoicing currencies are endogenous.
The remainder of the paper is organized as follows. Section 2 presents the construction of the general equilibrium model. Section 3 solves the model and compares the Nash policy with the cooperation policy. Section 4 demonstrates the welfare implication of the cooperation policy and discusses the incentive problem. Section 5 compares the variations in exchange rates under different policies and shows the desirability of a fixed exchange rate regime. Section 6 concludes the paper.
2. The model
We adapt the main framework of Devereux et al. (Reference Devereux, Engel and Tille2003) in two ways. First, we simultaneously model two types of pricing strategies of firms in line with the study by Betts and Devereux (Reference Betts and Devereux1999): PCP and LCP. We combine the PCP and the LCP into a single model, in which firms can price their goods in either domestic currency or foreign currency. This setting allows us to mimic incomplete exchange rate pass-through, which introduces important policy implications in the model. Footnote 6 Second, we modify the production sectors to allow for a range of subsectors in both tradable and nontradable sectors, which facilitates analytical solutions of endogenous variables in the mixed pricing strategy model without using log-linearization. The mixed pricing strategy enables different degrees of incomplete exchange rate pass-through. The basic setup of the model is as follows.
2.1 Households
Two countries are considered in the model, Home and Foreign. Each country produces a range of nontradable goods, indexed by [0,1], and tradable goods. The tradable goods are indexed by [0,1], with some of them produced in Home, indexed by [0,n], and the rest produced in Foreign, indexed by (n,1]. There are n households living in Home and
 $1-n$
households living in Foreign. The representative household in Home is both a consumer and a labor supplier. The expected lifetime utility function of the household is
 \begin{equation}\mathbb{E} \sum_{t=0}^{\infty}\beta^t[ln(C_t)-\eta L_t],\end{equation}
where
 $\beta\in (0,1)$
is a subjective discount factor,
 $C_t$
denotes the final consumption,
 $L_t$
denotes the hours worked, and
 $\mathbb{E}$
is an expectation operator.
The household’s consumption is financed by labor income, profit income, and a lump-sum transfer from government. In addition, the household has access to an international financial market, where state-contingent nominal bonds (denominated in home currency) are traded. The budget constraint of the household is
 \begin{equation}P_tC_t+\mathbb{E}_t(Q_{t,t+1}B_{t+1})=W_tL_t+\Pi_t+B_t,\end{equation}
where
 $W_t$
is the nominal wage rate,
 $Q_{t,t+1}$
is the bonds’ price,
 $B_{t+1}$
is the nominal bonds holding that pays one unit of home currency in period
 $t+1$
, and
 $\Pi_t$
is the profit income.
Table 1 summarizes the consumption and price indices. The final aggregate consumption
 $C_t$
comprises nontradable aggregate goods
 $C_{N,t}$
and tradable aggregate goods
 $C_{T,t}$
in the Cobb–Douglas form. The consumption of tradable goods is added with domestically produced aggregate tradable goods
 $C_{H,t}$
and import aggregate goods
 $C_{F,t}$
in the Cobb–Douglas form.
 $C_{N,t}(i)$
,
 $C_{H,t}(i)$
, and
 $C_{F,t}(i)$
are the consumption of goods produced in industry i in nontradable and tradable sectors in Home and Foreign country. As indicated in the construction of
 $C_{N,t}$
,
 $C_{H,t}$
, and
 $C_{F,t}$
in Table 1, we impose the elasticity of substitution across industries as unity. This is our key innovation in the model setting that facilitates analytical solution with any degree of exchange rate pass-through. The final goods production needs to be aggregated across different industries. Owing to the assumption of unit elasticity of substitution across industries, any variables related to PCP and LCP would be in a multiplicative form (or additive form with logarithm), enabling us to solve the model analytically.
Summary of consumption and price indices of the representative household in Home

The household’s problem is to maximize (1) subject to (2). The optimal labor supply decision and the intertemporal decision are
 \begin{equation}W_t=\eta P_tC_t, \end{equation}
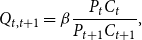 \begin{equation}Q_{t,t+1}=\beta \frac{P_tC_t}{P_{t+1}C_{t+1}},\end{equation}
Equation (4) indicates that the intertemporal marginal rate of substitution equals the price of the state-contingent bond. Let
 $R_t$
denote the gross nominal interest rate on a risk-free nominal bond,
 $R_t=1/\mathbb{E}_tQ_{t,t+1}$
. Then equation (4) becomes the intertemporal Euler equation:
 \begin{equation}\beta R_t\mathbb{E}_t\left[\frac{P_tC_t}{P_{t+1}C_{t+1}}\right]=1.\end{equation}
2.2 Firms
A continuum of firms engages in producing differential intermediates in each industry, indexed by [0,1]. The firms in the same industry i are monopolistically competing with each other with the elasticity of substitution
 $\theta>1$
. A final goods firm in each industry assembles the intermediates with CES technology:
 \begin{equation}Y_{k,t}(i)=\left[\int_0^1Y_{k,t}(i,j)^{\frac{\theta-1}{\theta}}dj\right]^{\frac{\theta}{\theta-1}}, \quad k=N,H,\end{equation}
where
 $Y_{k,t}(i)$
is the output of industry i in sector k, k is either a nontradable sector (N) or a tradable sector in Home (H), and
 $Y_{k,t}(i,j)$
is the input intermediate produced by firm j in industry i. The final goods firms across industries behave competitively. Then, the prices of final goods in each industry are
 \begin{equation}P_{k,t}(i)=\left[\int_0^1P_{k,t}(i,j)^{1-\theta}dj\right]^{\frac{1}{1-\theta}},\quad k=N,H.\end{equation}
By solving the cost-minimizing problem of the final goods firm, the demand function of each intermediate is
 \begin{equation}Y_{k,t}(i,j)=\left[\frac{P_{k,t}(i,j)}{P_{k,t}(i)}\right]^{-\theta}Y_{k,t}(i), \quad k=N,H.\end{equation}
The intermediate goods firms use only labor with the technology:
 \begin{equation}Y_{k,t}(i,j)=A_tL_{k,t}(i,j),\quad k=N, H,\end{equation}
where
 $L_{k,t}(i,j)$
is the labor input and
 $A_t$
is the stochastic technology level. The logarithm of the technology level follows an AR(1) process, that is
 $a_t=\rho a_{t-1}+u_t$
, where
 $a_t=ln(A_t)$
,
 $\rho\in [0,1]$
, and
 $u_t$
is mean-zero, i.i.d. the white noise process with variances
 $\sigma_u^2$
. The production function (9) implies that the marginal cost is
 $MC_{k,t}(i,j)=W_t/A_t$
.
Intermediate goods firms are price takers in the labor market and monopolistic competitors in the intermediate goods markets. They can set prices to maximize their profits. However, a type of price stickiness exists in the economy, in which firms must set prices one period prior to the realization of shocks. Meanwhile, all prices fully adjust to all shocks after one period, indicating there is no price persistence. With such price stickiness, the problem of each firm is to choose a price at period
 $t-1$
to maximize the expected profit of period t. The problem of the firm j in industry i of the nontradable sector lies in maximizing its profit (10) subject to (8):
 \begin{equation}\mathbb{E}_{t-1}Q{_{t-1,t}}Y{_{N,t}(i,j)[P_{N,t}(i,j)-MC_{N,t}(i,j)].}\end{equation}
The solution of the profit-maximizing problem gives the following optimal pricing rule:
 \begin{equation}P_{N,t}(i,j)=\frac{\theta}{\theta-1}\frac{\mathbb{E}{_{t-1}}Q{_{t-1,t}}Y{_{N,t}(i,j)}MC{_{N,t}(i,j)}}{\mathbb{E}{_{t-1}}Q{_{t-1,t}}Y{_{N,t}(i,j)}}.\end{equation}
In the tradable sector, goods are sold in both Home and Foreign. The problem of firms selling goods in Home is similar to the problem of nontradable firms. Consequently, their optimal pricing rule is
 \begin{equation}P_{H,t}(i,j)=\frac{\theta}{\theta-1}\frac{\mathbb{E}{_{t-1}}Q{_{t-1,t}}Y{_{H,t}(i,j)}MC{_{H,t}(i,j)}}{\mathbb{E}{_{t-1}}Q{_{t-1,t}}Y{_{H,t}(i,j)}}.\end{equation}
From the perspective of pricing currency, trade firms have two types of pricing strategies: domestic currency, that is, PCP, and foreign currency, that is, LCP. For simplicity, we assume that all firms in the same industry adopt only one pricing strategy, either PCP or LCP. There is
 $\tau^*$
industries in Home’s tradable sector adopting PCP strategy, and
 $(1-\tau^*)$
adopting LCP strategy. Therefore, PCP firms’ pricing rule in Home’s tradable sector is
 \begin{equation}P_{H,PCP,t}(i,j)=\frac{\theta}{\theta-1}\frac{\mathbb{E}_{t-1}Q_{t-1,t}Y_{H,PCP,t}(i,j)MC_{H,t}(i,j)}{\mathbb{E}_{t-1}Q_{t-1,t}Y_{H,PCP,t}(i,j)}.\end{equation}
Since the price is fixed in home currency a period ago, every unit change in the exchange rate will translate into one unit change in the price in terms of foreign currency. Thus, there exists complete exchange rate pass-through in PCP goods.
By contrast, the LCP firms need to take exchange rate changes into their pricing consideration. Their problem is
 \begin{equation}Max\; \mathbb{E}_{t-1}Q_{t-1,t}Y_{H,LCP,t}(i,j)[S_tP^*_{H,LCP,t}(i,j)-MC_{H,t}(i,j)],\end{equation}
 \begin{equation}s.t. \quad Y_{H,LCP,t}(i,j)=\left[\frac{S_tP^*_{H,LCP,t}(i,j)}{P_{H,LCP,t}(i)}\right]^{-\theta}Y_{H,LCP,t}(i).\end{equation}
The optimal pricing rule is
 \begin{equation}P^*_{H,LCP,t}(i,j)=\frac{\theta}{\theta-1}\frac{\mathbb{E}_{t-1}Q_{t-1,t}Y_{H,LCP,t}(i,j)MC_{H,t}(i,j)}{\mathbb{E}_{t-1}Q_{t-1,t}Y_{H,LCP,t}(i,j)S_t},\end{equation}
where
 $S_t$
is the nominal exchange rate (Home-currency price of Foreign currency). The pricing rule of LCP goods indicates that only the expected exchange rate will affect the optimal price in foreign currency and that the realized current exchange rate has no effect on it. Therefore, there is no exchange rate pass-through in LCP goods.
In a model with mixed pricing strategy, that is, both PCP and LCP coexisting in the economy, the overall exchange rate pass-through may be incomplete. The degree of incompleteness depends on the shares of these two strategies. The exchange rate pass-through is high when PCP dominates, and low when LCP dominates. In extreme cases, when all firms adopt the PCP strategy, the pass-through is complete; when all firms adopt the LCP strategy, the pass-through is zero. The following analysis indicates that the degree of incompleteness of pass-through significantly impacts the optimal monetary policy and its welfare implication.
The Foreign country’s structure is similar to that of Home country. In what follows, we denote all Foreign variables with a superscript asterisk and assume that all other parameters are identical to their counterparts in Home country, except that Foreign country has
 $1-n$
households, the PCP ratio of Foreign trade industries is
 $\tau$
, and the LCP ratio is
 $(1-\tau)$
.
2.3 Risk sharing and market clearing
We assume a complete international financial market in which residents in each country can purchase a full set of state-contingent nominal bonds. This setting allows each household to enjoy perfect risk sharing across countries. Accordingly, the Foreign household’s optimal intertemporal decision is
 \begin{equation}Q_{t,t+1}=\beta \frac{P^*_tC^*_t}{P^*_{t+1}C^*_{t+1}}\frac{S_t}{S_{t+1}},\end{equation}
By combining the equation with its Home counterpart (4) and iterating with respect to t, we arrive at a risk-sharing condition:
 \begin{equation}E_t=\phi_0\frac{C_t}{C_t^*},\end{equation}
where
 $E_t=S_tP^*_t/P_t$
is the real exchange rate and
 $\phi_0=E_0C^*_0/C_0$
. For simplicity, let
 $\phi_0=1$
. This condition implies that factor price equalization holds. This arises immediately out of equations (3) and (18), and thus we have
 $W_t=S_tW^*_t$
.
Using the labor supply condition (3), its counterpart of Foreign, and the risk-sharing condition, we can simplify the optimal pricing rules and price indices in Table 2. The prices in Table 2 reveal that the exchange rate pass-through in the short run depends on the ratio of PCP strategy in the tradable sector, and on two preference parameters,
 $\gamma$
and n. The short-run elasticity of exchange rate to consumer price index is
 $(1-n)\gamma\tau$
in Home, and
 $-n\gamma\tau^*$
in Foreign. Thus, when a country is smaller in terms of the smaller ratio of nontradable consumption to tradable consumption, or the larger PCP ratio in import goods, the exchange rate considerably affects the aggregate price level.
Prices in Home and Foreign

Since labor is mobile within each country (but not across countries), labor market clearing condition for Home is
 \begin{equation}nL_t=L_{N,t}+L_{H,t},\end{equation}
where labor demands in the nontradable sector and the tradable sector are
 \begin{equation}L_{N,t}=n\frac{(1-\gamma)P_tC_t}{A_tP_{N,t}},\end{equation}
 \begin{equation}L_{H,t}=n\frac{n\gamma P_tC_t}{A_tP_{H,t}}+(1-n)\left[\frac{n\gamma\tau^*S_tP^*_tC^*_t}{A_tP_{H,PCP,t}}+\frac{n\gamma(1-\tau^*)P^*_tC^*_t}{A_tP^*_{H,LCP,t}}\right].\end{equation}
The nominal bonds are traded in the international financial market, and the bond market clearing requires that the sum of bonds is zero,
 $nB_t+(1-n)B^*_t=0$
.
2.4 Monetary policy
The monetary policies adopted by both countries’ central banks are interest rate rules. Similar with the study by Obstfeld (Reference Obstfeld2006), the central bank uses nominal interest rate to respond to the price fluctuations and real shocks. Home’s and Foreign’s monetary policy rules are
 \begin{equation}r_t=r+\phi p_t-\alpha_Hu_t-\alpha^*_Hu^*_t,\end{equation}
 \begin{equation}r^*_t=r^*+\phi p^*_t-\alpha_Fu_t-\alpha^*_Fu^*_t,\end{equation}
where
 $r_t=lnR_t$
and
 $r_t^*=lnR^*_t$
. These rules imply that the interest rate responds to both nominal changes and real shocks. The crucial task is to calculate the optimal values of coefficients
 $\{\alpha_H,\alpha^*_H,\alpha_F,\alpha^*_F\}$
under different settings in the following.
2.5 Log form of the model
The preceding setup allows us to solve the model explicitly with analytical solutions through log form of the model. The unexpected part of each variable is log-normally distributed, because all shocks (Home and Foreign labor productivity shocks) follow log-normal distributions. We let the lowercase denote the log value of that variable, that is,
 $x_t=lnX_t$
. Taking log of the equations in the first column in Table 1, we get
 \begin{equation}p_t=\Omega_p+p_{t|t-1}+c_{t|t-1}+(1-n)\gamma\tau(s_t-s_{t|t-1})-\Theta_{t|t-1,}\end{equation}
where
 $\Omega_p=ln\frac{\theta\eta}{\theta-1}+\frac{1}{2}[\sigma^2_p+\sigma^2_c+\sigma^2_{\vartheta}]+\sigma_{pc}-\sigma_{p\vartheta}-\sigma_{c\vartheta}+(1-n)\gamma\tau(\frac{1}{2}\sigma^2_s+\sigma_{su^*}-\sigma_{ps}-\sigma_{cs})$
,
 $\Theta_t=[1-(1-n)\gamma]a_t+(1-n)\gamma a^*_t$
,
 $\vartheta_t=[1-(1-n)\gamma]u_t+(1-n)\gamma u^*_t$
.The variances and covariances in the expression are endogenously determined, and they can be computed once the equilibrium values of c, p, and s are solved in terms of current shocks. By taking expectation at time
 $t-1$
on (24), the expected consumption is obtained as follows:
 \begin{equation}c_{t|t-1}=-\Omega_p+\Theta_{t|t-1},\end{equation}
which implies that the expected consumption level is affected by the expected productivity, and the magnitude of fluctuations of the economy. Combining (24) and (25), we have
 \begin{equation}p_t-p_{t|t-1}=(1-n)\gamma\tau(s_t-s_{t|t-1}).\end{equation}
It indicates that the unexpected change in the price level is determined by the unexpected change of exchange rate exclusively. The magnitude of the effect of exchange rate on price level depends on three parameters
 $\{n,\gamma,\tau\}$
. When all firms in the tradable sector of Foreign adopt the LCP strategy (
 $\tau=0$
), the unexpected change in exchange rate does not affect Home’s price level, given that all import prices are fixed in Home’s currency in the short run.
Similarly, the price of Foreign can be derived as follows:
 \begin{equation}p^*_t=\Omega_{p^*}+p^*_{t|t-1}+c^*_{t|t-1}-n\gamma\tau^*(s_t-s_{t|t-1})-\Theta^*_{t|t-1,}\end{equation}
where
 $\Omega_p^*=ln\frac{\theta\eta}{\theta-1}+\frac{1}{2}[\sigma^2_{p^*}+\sigma^2_{c^*},+\sigma^2_{\vartheta^*}]+\sigma_{p^*c^*}-\sigma_{p^*\vartheta^*}-\sigma_{c^*\vartheta^*}+n\gamma\tau^*(\frac{1}{2}\sigma^2_s+\sigma_{su}-\sigma_{p^*s}-\sigma_{c^*s})$
,
 $\Theta_t^*=n\gamma a_t+(1-n\gamma) a^*_t$
,
 $\vartheta_t^*=n\gamma u_t+(1-n\gamma) u^*_t$
.
The expected consumption of Foreign’s household is
 \begin{equation}c^*_{t|t-1}=-\Omega_{p^*}+\Theta^*_{t|t-1}.\end{equation}
Substituting (28) into (27), we obtain the relationship of the unexpected price level and exchange rate:
 \begin{equation}p^*_t-p^*_{t|t-1}=-n\gamma\tau^*(s_t-s_{t|t-1}).\end{equation}
Compared with (26), the exchange rate changes have contrasting effects on the price levels of Home and Foreign, because the rise of exchange rate means depreciation of Home currency, and appreciation of Foreign currency. Thus, when the exchange rate increases, Home’s price level inflates and Foreign’s price level deflates provided there are at least some PCP firms in both the countries. This expression indicates that there exists no one-to-one correspondence between changes in exchange rate and price level in the short run even when all firms adopt the PCP strategy, because of the existence of nontradable goods, constituting a significant share in the consumer price index, which are not affected by the exchange rate immediately. This result differs from those of many other models in which no nontradable goods exist and the law of one price holds.
The log form of (5) is
 \begin{equation}r_t=-ln\beta+p_{t+1|t}-p_t+c_{t+1|t}-c_t-\frac{1}{2}(\sigma^2_p+\sigma^2_c)-\sigma_{pc}.\end{equation}
Substituting log nominal interest rate by Home’s monetary policy rule and after some algebraic manipulations, we have the following expression of the price level:
 \begin{equation}p_t=-\Omega_{\bar{p}}+\frac{\rho}{1+\phi-\rho}(\Theta_{t|t-1}-\Theta_{t-1})+(1-n)\gamma\tau(s_t-s_{t|t-1}),\end{equation}
where
 $\Omega_{\bar{p}}=[r+ln\beta+(\sigma^2_p+\sigma^2_c)/2+\sigma_{pc}]/\phi$
. Several implications can be inferred from this expression. First, the price level will be directly affected by exchange rate movements, and its magnitude depends on the share of PCP. Second, the expected changes in productivity in both Home and Foreign affect the price level through the price markup channel. In fact, Foreign’s productivity changes also affect Home’s price level. This does not rely on the pricing strategies that firms adopt but rests on the preference of households. The more the domestic residents prefer import goods, the more the price level is affected by Foreign’s productivity. Third, the price level is negatively associated with the volatilities of price and consumption. This originates from risk-averse households, and hence, uncertainty lowers their welfare. Consequently, a lower average price, implying a higher average consumption, is needed to compensate this risk.
Combining (22), (25), (30), and (31), the consumption in log form is
 \begin{equation}c_t=(1+\phi)(1-n)\gamma\tau(s_t-s_{t|t-1})+\frac{\phi}{1+\phi-\rho}\Theta_{t+1|t}+\alpha_Hu_t+\alpha^*_Hu^*_t+\Omega_c,\end{equation}
where
 $\Omega_c$
is a function of date
 $t-1$
(and earlier) information including variances and covariance of variables. Taking expectation of (32) at period
 $t-1$
, and abstracting from (32), we get
 \begin{equation}c_t-c_{t|t-1}=(1+\phi)(1-n)\gamma\tau(s_t-s_{t|t-1})+\frac{\phi}{1+\phi-\rho}\vartheta_t+\alpha_Hu_t+\alpha^*_Hu^*_t.\end{equation}
Unexpected change in consumption would be affected through three channels. The first is the exchange rate pass-through. Fluctuations in exchange rate alter import prices, and expenditure switching becomes effective by shifting the consumption between domestic and foreign goods, thereby affecting the total consumption. The second channel is the expected change in future productivity. Households expect that the price level will be lower based on an expected rise in productivity. The expected lower price means higher consumption in future. Therefore, households will increase current purchase to smooth intertemporal consumption. The last channel is the monetary policy rule, which responds to variations in productivity. When there is a positive productivity shock, the central bank will lower the interest rate, encouraging current consumption.
Similarly, we have the counterpart of (33) for Foreign, which is as follows
 \begin{equation}c_t^*-c^*_{t|t-1}=-(1+\phi)n\gamma\tau^*(s_t-s_{t|t-1})+\frac{\phi}{1+\phi-\rho}\vartheta^*_t+\alpha_Fu_t+\alpha^*_Fu^*_t.\end{equation}
The factors affecting the unexpected change in Foreign’s consumption is similar to those of Home’s consumption.
Equations (33) and (34) yield the relationship of unexpected exchange rate movements and unexpected changes in Home’s and Foreign’s consumption, respectively. Another equation related to these three endogenous variables is needed, then these three variables can be solved and expressed in functions of exogenous shocks. The final equation is the risk-sharing equation (18). The log form of (18) is
 $s_t+p^*_t-p_t=c_t-c^*_t$
. Abstracting it from its expected form at
 $t-1$
, we obtain
 \begin{equation}(s_t-s_{t|t-1})+(p^*_t-p^*_{t|t-1})-(p_t-p_{t|t-1})=(c_t-c_{t|t-1})-(c^*_t-c^*_{t|t-1}).\end{equation}
Substituting (26) and (29) into equation (35), we get
 \begin{equation}[1-n\gamma\tau-(1-n)\gamma\tau^*](s_t-s_{t|t-1})=(c_t-c_{t|t-1})-(c^*_t-c^*_{t|t-1}).\end{equation}
Thus, equations (33), (34), and (36) can solve these three endogenous variables, and subsequently all other variables can be solved explicitly. The solutions of the system are
 \begin{equation}s_t-s_{t|t-1}=b(\bar{\alpha}_H-\bar{\alpha}_F)u_t+b(\bar{\alpha}^*_H-\bar{\alpha}^*_F)u^*_t,\end{equation}
 \begin{equation}c_t-c_{t|t-1}=[(1+\xi)\bar{\alpha}_H-\xi\bar{\alpha}_F]u_t+[(1+\xi)\bar{\alpha}^*_H-\xi\bar{\alpha}^*_F]u^*_t,\end{equation}
 \begin{equation}c_t^*-c^*_{t|t-1}=[-\xi^*\bar{\alpha}_H+(1+\xi^*)\bar{\alpha}_F]u_t+[-\xi^*\bar{\alpha}^*_H+(1+\xi^*)\bar{\alpha}^*_F]u^*_t,\end{equation}
where
 $b=\frac{1}{1-(1+n\phi) \gamma \tau^*-[1+(1-n)\phi]\gamma \tau}$
,
 $\bar{\alpha}_H=\alpha_H+[1-(1-n)\gamma]\frac{\phi}{1+\phi-\rho}$
,
 $\bar{\alpha}^*_H=\alpha^*_H+ (1-n)\gamma\frac{\phi}{1+\phi-\rho}$
,
 $\bar{\alpha}_F=\alpha_F+n\gamma\frac{\phi}{1+\phi-\rho}$
,
 $\bar{\alpha}^*_F=\alpha^*_F+(1-n\gamma)\frac{\phi}{1+\phi-\rho}$
,
 $\xi=(1+\phi)\zeta b$
,
 $\xi^*=(1+\phi)\zeta^*b$
,
 $\zeta=(1-n)\gamma \tau$
, and
 $\zeta^*=n\gamma\tau^*$
.
The solutions indicate that monetary policy significantly affects unexpected changes in endogenous variables. In the following sections, these solutions are used to study the optimal policy according to the welfare criterion. The first question that arises is, as a central bank acting in a self-interested manner, how does one react to exogenous shocks to improve welfare. The second question of interest is whether international monetary cooperation will increase welfare in each country.
3. Optimal policy design
Two policy scenarios are examined. Under the first scenario, self-interested central banks play noncooperative games and pursue their own Nash policies. Under the second scenario, both the countries cooperate in monetary policy, aiming to maximize worldwide welfare.
Under the first policy scenario, central banks make their own optimal interest rate rules, given the actions of the other central bank. Equations (33) and (34) indicate that the exchange rate changes affect consumptions in both the countries with incomplete exchange rate pass-through. Therefore, the optimal policy of a self-interested central bank might unintentionally change the other country’s consumption, a typical type of externality. When this externality is positive, that is, an expansionary monetary policy, it benefits the home country. It also raises the welfare of the other country, which is a monetary policy desirable from the world’s perspective (Obstfeld and Rogoff (Reference Obstfeld and Rogoff1995)). However, a self-interested country will not engage in a policy action to benefit another country. Therefore, the self-interested policy might be inefficient from a global perspective. In contrast, when the externality is negative, that is, a self-interested monetary policy is “beggar-thy-neighbor” as in Betts and Devereux (Reference Betts and Devereux1999), a less active policy action is needed to alleviate the harms to the other country. Correspondingly, the Nash equilibrium might trap both countries in a prisoner dilemma. In these cases, international monetary policy cooperation may be desirable.
Given the full tractability of the model, the optimal policy rules can be solved in a closed form. The general solutions of optimal monetary policies are solved for both the central banks under the Nash scenario and the cooperation scenario; then, the properties of the solutions are examined using three special cases. Finally, a numerical example is presented for better understanding the solutions.
3.1 The general solutions of the Nash policy
The goal of each self-interested central bank is to maximize expected national welfare. The expected labor supply of Home can be retrieved from (19) as follows:
 \begin{equation}L_{t|t-1}=\frac{\theta-1}{\theta\eta}.\end{equation}
This implies a constant expected amount of labor. Therefore, there is no need for the central bank to be concerned with labor disutility. This is the special result attributable to the log form of consumption in the utility function. Thus, the expected utility is
 \begin{equation}c_{t|t-1}-\frac{\theta-1}{\theta}.\end{equation}
It implies that maximizing expected utility is equivalent to minimizing
 $\Omega_p$
. Using the solutions in the system of (37), (38), and (39),
 $\Omega_p$
can be expressed as a function of variations of exogenous shocks
 $u_t$
and
 $u^*_t$
. Therefore, we arrive at the following proposition.
Proposition 1 Under the Nash equilibrium, the optimal policy rules for central banks are the solutions of
 \begin{equation}\left[\begin{array}{cc}A &-B \\-B^* & A^*\end{array}\right]\left[\begin{array}{c}\bar{\alpha}^N_H\\\bar{\alpha}^N_F\end{array} \right] =\left[\begin{array}{c}D\\K^* \end{array} \right],\left[\begin{array}{cc}A &-B\\-B^* &A^* \end{array} \right]\left[\begin{array}{c}\bar{\alpha}^{*,N}_H\\\bar{\alpha}^{*,N}_F \end{array}\right]=\left[\begin{array}{c}K\\D^*\end{array} \right],\end{equation}
where
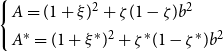 $\left\{ \begin{array}{l} A=(1+\xi)^2+\zeta(1-\zeta)b^2\\ A^*=(1+\xi^*)^2+\zeta^*(1-\zeta^*)b^2 \end{array}\right.$
,
 $\left\{\begin{array}{l}B=\xi(1+\xi)+\zeta(1-\zeta)b^2\\B^*=\xi^*(1+\xi^*)+\zeta^*(1-\zeta^*)b^2\end{array}\right.$
,
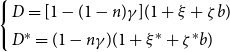 $\left\{\begin{array}{l} D=[1-(1-n)\gamma](1+\xi+\zeta b)\\ D^*=(1-n\gamma)(1+\xi^*+\zeta^*b)\end{array} \right.$
,
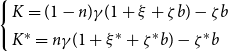 $\left\{\begin{array}{l} K=(1-n)\gamma(1+\xi+\zeta b)-\zeta b\\ K^*=n\gamma(1+\xi^*+\zeta^* b)-\zeta^*b \end{array}\right.$
.
Proof: see the Appendix.
The proposition indicates that the Nash policy has a closed-form solution. However, it is difficult to examine how the pricing strategies affect the policy rules explicitly. Therefore, three special cases, that is, PCP case, LCP case, and single currency pricing (SCP) case, are examined in depth. The SCP case is where all firms in both countries price their export goods in Foreign’s currency. Furthermore, a numerical example is adopted to investigate the properties of the solutions in other cases.
System (42) shows that each country’s central bank chooses a reaction coefficient considering the other country’s monetary policy rule. The reaction functions of Home’s central bank are as follows:
 \begin{equation}\left\{ \begin{array}{l} \bar{\alpha}^N_H=\frac{B}{A}\bar{\alpha}^N_F+\frac{D}{A}\\\bar{\alpha}^{*,N}_H=\frac{B}{A}\bar{\alpha}^{*,N}_F+\frac{K}{A} \end{array} \right.\end{equation}
Given
 $B>0$
, (43) indicates that if the Foreign’s policy is more active, then the Home’s policy is also more active. This may lead to a suboptimal equilibrium, that is, a type of prisoner dilemma. The logic is as follows. Considering temporary positive technological shocks in Home, Home’s central bank uses this advantage and lowers the domestic interest rate to encourage current consumption. However, the lower interest rate in Home leads to a depreciation of Home’s currency, which negatively affects Foreign’s consumption and welfare. To counteract this negative effect, Foreign’s central bank will also lower Foreign’s interest rate. The action taken by Foreign’s central bank will, in turn, mitigate the effect of Home’s policy. Therefore, a more active action is needed for Home’s central bank. This interaction will continue, and the two countries will be trapped into a situation of competitive depreciation. Therefore, Nash equilibrium in this case might not be optimal from the world’s perspective.
Only when
 $B=0$
, the policy interaction disappears. The LCP and the SCP cases satisfy this condition. In the LCP and SCP cases, at least one of B and
 $B^*$
equals zero because
 $\tau=0$
and/or
 $\tau^*=0$
. Then, one country’s policy no longer depends on the other country’s policy. In these cases, whether B and
 $B^*$
are equal to zero depend on exchange rate pass-through. The policy interaction appears only in the situation such that there is, at least, some degree of exchange rate pass-through. In other words, when exchange rate movements affect a country’s consumption price index, its Nash policy rule will be affected by the foreign country’s policy.
In addition, the degree of interaction between two countries’ policies depends on the completeness of exchange rate pass-through. A lower degree of pass-through for Home means a smaller absolute value of
 $B/A$
. Equation (43) shows that the impact of Foreign’s policy on Home’s policy is smaller. Thus, the lower the degree of exchange rate pass-through, the weaker the policy interaction between the countries.
3.2 The general solutions of the cooperation policy
When the central banks of both countries cooperate in monetary policy, their policies aim to maximize the expected total welfare of all households living in both countries. The world’s aggregate welfare adds the utility of all households equally in both Home and Foreign:
 \begin{equation}nU_{t|t-1}+(1-n)U^*_{t|t-1}.\end{equation}
The cooperation policy goal is to maximize (44) by choosing policy reaction rules, that is,
 $\{\bar{\alpha}_H, \bar{\alpha}_F, \bar{\alpha}^*_H, \bar{\alpha}^*_F\}$
. This is equivalent to maximizing
 $nc_{t|t-1}+(1-n)c^*_{t|t-1}$
in the model. Solving this problem, we obtain the following proposition.
Proposition 2 Under the cooperation equilibrium, the optimal policy rules for central banks are the solutions of
 \begin{equation}\Omega\left[\begin{array}{c}\bar{\alpha}^c_H\\ \bar{\alpha}^c_F\end{array}\right]=\left[ \begin{array}{c} nD+(1-n)(n\gamma-K^*)\\ n[1-(1-n)\gamma-D]+(1-n)K^* \end{array}\right],\Omega\left[ \begin{array}{c} \bar{\alpha}^{*,c}_H\\ \bar{\alpha}^{*,c}_F\end{array}\right]=\left[\begin{array}{c}nK+(1-n)(1-n\gamma-D^*)\\ n[(1-n)\gamma-K]+(1-n)D^* \end{array}\right]\end{equation}
where
 $\Omega=\left[\begin{array}{cc} nA+(1-n)(B^*-\xi^*) & -nB-(1-n)B^*\\-nB-(1-n)B^* & (1-n)A^*+n(B-\xi)\end{array}\right]$
.
Proof: see the Appendix.
The solutions show that the optimal cooperation policy rules for both the countries are affected by several key parameters in the model, including country’s size n, the substitution elasticity between tradable and nontradable goods
 $\gamma$
, the share of LCP strategy of both countries’ tradable firms
 $\{\tau,\tau^*\}$
, and the coefficient of price level
 $\phi$
. Furthermore, we consider three special cases to show the properties of the cooperation solutions.
In general, we find that, the Nash and cooperation policies are not identical. However, the optimal policies in these two scenarios are the same in PCP and LCP cases, both of which are studied in literature (Corsetti and Pesenti (2005,Reference Corsetti and Pesenti2008); Devereux and Engel (Reference Devereux and Engel2003)). The advantage of the model in this study is that it nests these two cases into one model with two parameters
 $\tau$
and
 $\tau^*$
. Therefore, the PCP and LCP cases are merely two special cases of our model, and the model can be used to study any intermediate degree of exchange rate pass-through by choosing different values of
 $\tau$
and
 $\tau^*$
.
3.3 The LCP case
The LCP case assumes that all firms adopt the LCP strategy, that is,
 $\tau=\tau^*=0$
. In this case, the law of one price does not hold, because each firm prices its goods separately in its domestic market. Several studies have been built on this assumption (Betts and Devereux (Reference Betts and Devereux1999); Obstfeld (Reference Obstfeld2006); Duarte and Obstfeld (Reference Duarte and Obstfeld2008)). In this case, exchange rate pass-through vanishes. Thus, the Nash and cooperation policies can be reduced to the same following forms:
 \begin{equation}\left[\begin{array}{c}\bar{\alpha}_{H,LCP}\\ \bar{\alpha}_{F,LCP}\end{array}\right]=\left[\begin{array}{c}1-(1-n)\gamma\\ n\gamma \end{array}\right],\left[\begin{array}{c}\bar{\alpha}^*_{H,LCP}\\ \bar{\alpha}^*_{F,LCP}\end{array}\right]=\left[\begin{array}{c}(1-n)\gamma\\ 1-n\gamma\end{array}\right].\end{equation}
The solutions indicate that the optimal policy rules are determined by households’ preference. The higher preference of Home’s households for domestic goods (both nontradable and domestic tradable), that is, a higher value of
 $1-(1-n)\gamma$
, the higher the degree of Home’s monetary policy reaction to Home’s productivity shocks. Meanwhile, the higher preference of Home’s households on import goods, that is, a higher value of
 $(1-n)\gamma$
, implies a higher degree of Home’s monetary policy reaction to Foreign’s productivity shocks. The rationale is intuitive. When there is no exchange rate pass-through, the only source of the variation in import goods’ prices is Foreign’s productivity shocks. It affects the marginal cost, and therefore the pricing behavior of Foreign’s firms. Similarly, the prices of domestic goods are affected only by domestic productivity shocks, since there is no expenditure switching effect from the fluctuations of exchange rates. Therefore, the domestic central bank reacts to shocks in line with the composition of consumption. The solutions (46) is similar to the case in the study by Obstfeld (Reference Obstfeld2006) when
 $n=1/2$
.
Why is the cooperation policy identical to the Nash policy under the LCP? The reason also rests on the nonexistence of exchange rate pass-through. Under the LCP, the pass-through vanishes, that is, consumer price index does not respond to exchange rate changes, because of the predetermined import prices in local currency. This implies that all prices of consumption goods are predetermined. The only monetary policy in need is to adjust the nominal interest rate according to productivity changes. Therefore, the solution (46) shows that there is no need to cooperate without exchange rate pass-through. As in Obstfeld (Reference Obstfeld2006), the economy arrives at flexible price equilibrium under the Nash rules, and there is no room for international monetary cooperation. Footnote 7
3.4 The PCP case
In the second case, all firms adopt the PCP strategy, that is,
 $\tau=\tau^*=1$
. Here, the law of one price holds (Obstfeld and Rogoff (1995,Reference Obstfeld and Rogoff1998); Benigno and Benigno (2003,2006,Reference Benigno and Benigno2008); Liu and Pappa (Reference Liu and Pappa2008)), and the exchange rate pass-through in both countries is immediate and complete. Any change in the exchange rate will translate into the price changes of import goods in terms of the currency of the importing country. The solutions of the Nash and cooperation policies coincide again. They can be reduced to
 \begin{equation}\left[\begin{array}{c}\bar{\alpha}_{H,PCP}\\ \bar{\alpha}_{F,PCP}\end{array} \right]=\left[ \begin{array}{c} 1-(2+\phi)(1-n)\gamma\\ (2+\phi)n\gamma\end{array}\right],\left[\begin{array}{c}\bar{\alpha}^*_{H,PCP}\\ \bar{\alpha}^*_{F,PCP}\end{array} \right]=\left[\begin{array}{c} (2+\phi)(1-n)\gamma\\ 1-(2+\phi)n\gamma \end{array} \right].\end{equation}
Compared with the LCP case, the reaction coefficient of domestic shocks in the PCP case is smaller, and that of foreign shocks becomes larger, given
 $\phi\ge 0$
. In the PCP case, the higher degree of exchange rate pass-through raises the variations in the consumer price index. Consider a positive shock of Home’s productivity. It raises the potential output level and leads to a negative output gap, which, in turn, requires a lower interest rate to boost demand. A lower interest rate induces depreciation of Home’s currency, which positively affects demand. In the LCP case, the latter positive effect does not exist. Hence, in the PCP case, the central bank need not respond to domestic shocks as large as it does in the LCP case. With regard to a positive foreign shock, a more active reaction is needed in the PCP case, because currency appreciation reduces the import prices and increases domestic demand for imports further.
Both the LCP and PCP cases indicate that there is no room for international monetary cooperation because the Nash and cooperation policies are identical. This is evident in the LCP case, because there is no exchange rate pass-through, and thus, no terms of trade externality. However, while complete exchange rate pass-through exists in the PCP case, the externality is important for optimal policy design. Why does the Nash policy remain identical to the cooperation policy under the PCP case? It is because the Nash equilibrium coincides with the flexible price allocation. On the one hand, the central banks of both countries are able to restore flexible price equilibrium for nominal variables. On the other hand, the monopoly powers on the terms of trade are equally distributed across countries and canceled out with each other. Hence, there is no room for policy cooperation in the PCP case either. Footnote 8
To conclude, we present the following proposition.
Proposition 3 The optimal Nash policies of both countries are identical with the optimal cooperation policies in both the PCP and LCP cases. There is no cooperation gain in these two cases.
3.5 The SCP case
In the third case, all firms in both Home and Foreign price their goods in a single currency (Foreign’s currency, for simplicity), that is,
 $\tau=1$
,
 $\tau^*=0$
. In this study, it is referred to “SCP case,” in which, there is complete exchange rate pass-through in Home, and no pass-through in Foreign.
Footnote 9
By solving (42), the Nash policy solutions are
 \begin{equation}\left[\begin{array}{c}\bar{\alpha}^N_{H,SCP}\\ \bar{\alpha}^N_{F,SCP}\end{array} \right]=\left[\begin{array}{c} 1-(1-n\gamma)(2+\phi)(1-n)\gamma\\ n\gamma\end{array} \right],\left[\begin{array}{c}\bar{\alpha}^{*,N}_{H,SCP}\\ \bar{\alpha}^{*,N}_{F,SCP}\end{array} \right]=\left[\begin{array}{c}(1-n\gamma)(2+\phi)(1-n)\gamma\\ 1-n\gamma \end{array}\right].\end{equation}
The Nash policy of Foreign in the SCP case is identical to that in the LCP case because of the nonexistence of exchange rate pass-through for Foreign in both the cases. In the absence of pass-through, the consumption of Foreign’s households will not be affected by exchange rate movements. In addition, the shocks of technology in both the countries do not affect the Foreign’s demand because all prices are fixed one period ago in Foreign’s currency. This can be verified by (42). When
 $\tau^*=0$
, the Nash monetary policies of Foreign are
 $\bar{\alpha}^N_F=n\gamma$
and
 $\bar{\alpha}^{*,N}_F=1-n\gamma$
, regardless the value of
 $\tau$
. However, Home’s central bank needs to respond to domestic shocks less and to foreign shocks more in the SCP case than in the LCP case, given
 $(1-n\gamma)(2+\phi)>1$
. This is because the increase in exchange rate pass-through raises the impact of foreign shocks on domestic welfare.
Unlike the PCP and LCP cases, the cooperation policy is no longer identical to the Nash policy in the SCP case. Solving (45) with
 $\tau=1$
,
 $\tau^*=0$
, we obtain
 \begin{equation}\left[\begin{array}{c}\bar{\alpha}^C_{H,SCP}\\ \bar{\alpha}^C_{F,SCP}\end{array}\right]=\left[\begin{array}{c}1-\frac{(2+\phi)(1-n)\gamma}{1+n\gamma}\\\frac{n\gamma}{1+n\gamma} \end{array}\right],\left[\begin{array}{c}\bar{\alpha}^{*,C}_{H,SCP}\\ \bar{\alpha}^{*,C}_{F,SCP}\end{array}\right]=\left[\begin{array}{c}\frac{(2+\phi)(1-n)\gamma}{1+n\gamma}\\ \frac{1}{1+n\gamma} \end{array} \right].\end{equation}
It is easy to verify that
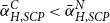 $\bar{\alpha}^C_{H,SCP}<\bar{\alpha}^N_{H,SCP}$
,
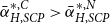 $\bar{\alpha}^{*,C}_{H,SCP}>\bar{\alpha}^{*,N}_{H,SCP}$
,
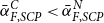 $\bar{\alpha}^C_{F,SCP}<\bar{\alpha}^N_{F,SCP}$
, and
 $\bar{\alpha}^{*,C}_{F,SCP}>\bar{\alpha}^{*,N}_{F,SCP}$
. These results show diverse reaction coefficients of both countries. When Home cooperates with Foreign in the SCP case, Home’s interest rate responds less to the domestic shock and more to the foreign shock, compared with the Nash policy. In contrast, Foreign’s interest rate responds more to the domestic shock and less to the foreign shock. From the global perspective, the monetary policies of both countries must carefully consider the shock of the country with low pass-through, because it is the dominator in the variation of the terms of trade through exchange rate movements.
The SCP case can be used to understand the issue of currency internationalization in reality. A few international currencies function as pricing currencies, such as US dollar, euro, and Japanese yen, while others are insignificant in international trade. The extent the currency is used as pricing currency by foreign countries can be taken as the measure of currency internationalization. With this measure,
 $1-\tau$
is the degree of internationalization of Home’s currency, and
 $1-\tau^*$
is the degree of internationalization of Foreign’s currency. Thus, in the SCP case, Home’s currency is a pure local currency and Foreign’s currency is a complete international one. Therefore, in the SCP case, the Foreign’s currency has full pricing power in trade, while the Home’s currency has none.
The extent of currency internationalization has important policy implications. First, as observed in the Nash equilibrium, it influences the interaction of the policy game across countries. A low degree of currency internationalization means a high exchange rate pass-through, indicating that the country’s policy will be affected more by the other country’s policy in the Nash equilibrium. Second, currency internationalization also affects the cooperation rules. Comparing (46) with (49) reveals that a low degree of Home’s currency internationalization requires the Home’s monetary rule to respond less to domestic shocks, and more to foreign shocks. Third, currency internationalization governs the efficiency of the Nash polices. When both currencies are fully internationalized, the Nash policies are Pareto optimal for both countries. However, the Nash policies are no longer Pareto optimal when one or both currencies are not fully internationalized, except for the PCP case.
The difference in the Nash and cooperation policies implies that the self-interested policy is no longer optimal from a global perspective. The solution (49) shows that if both countries react more to Foreign’s shocks than to Home’s shocks relative to the Nash equilibrium, the total world welfare will improve. This welfare improvement cannot be gained under self-interested policies. Solutions (43) and (49) confirm that Home has incentive to engage in policy cooperation, given Foreign’s promise to act cooperatively. However, the cooperation policy in the SCP case is not incentive compatible for Foreign’s central bank. Given that Home’s central bank adopts the cooperation policy, the self-interested policy of Foreign’s central bank is
 \begin{equation}\left\{\begin{array}{l}\bar{\alpha}^N_F=\frac{B^*}{A^*}\bar{\alpha}^C_H+\frac{K^*}{A^*}\\\bar{\alpha}^{*,N}_F=\frac{B^*}{A^*}\bar{\alpha}^{*,C}_H+\frac{D^*}{A^*} \end{array} \right.\end{equation}
 $B^*=0$
in the SCP case, which implies that the Nash policy is a dominant strategy for Foreign’s central bank, regardless of the magnitude of exchange rate pass-through in Home. Cooperation cannot improve Foreign’s national welfare. Thus, Foreign has no incentive to cooperate, even though it can enhance total world welfare.
This result has an important implication for international monetary policy cooperation. A country with an internationalized currency is less likely to engage in cooperation, while another with a local currency often suffers a welfare loss in the Nash equilibrium. The latter country has an incentive to cooperate, especially those with international currencies. Unfortunately, without the promise of other benefits to the countries with international currencies, cooperation is not easy to develop. This might explain why monetary policy cooperation between developing countries (usually with local currencies) and developed countries (usually with international currencies) is rare. It is not the unwillingness of developing countries to cooperate, but that the developed countries have no incentive to cooperate with developing countries. Without cooperation, developing countries have to use other policies to reduce the negative externality of the terms of trade, such as fixed exchange rate regime.
3.6 A numerical example
In addition to the four simple cases illustrated earlier, propositions 1 and 2 also give the Nash policy rules and the cooperation policy rules for both countries regardless of the exchange rate pass-through. To help understand, we present a numerical example.
Set
 $n=0.5$
,
 $\gamma=0.25$
,
 $\phi=1.5$
, and
 $\rho=0$
. Figure 1 depicts the Nash policy rules of both countries along with the changes in two exchange rate pass-through parameters
 $\{\tau,\tau^*\}$
. Two properties of the Nash policy are worth mentioning.
Sensibility of the Nash monetary policy with respect to pricing strategies.

First, when exchange rate pass-through in Home increases, Home’s policy rules respond less to Home’s shocks than to Foreign’s shocks, while Foreign’s policy rules respond more on Foreign’s shocks and less on Home’s shocks. A higher degree of pass-through leads to a larger variation in prices of import goods due to exchange rate fluctuations. As a result, a more aggressive response is needed to reduce this negative effect.
Second, the sensibility of one country’s policy rule to the other country’s pass-through depends on its own degree of pass-through. As indicated in Figure 1, when Home’s pass-through is very low (the value of
 $\tau$
close to 0), changes in Foreign’s pass-through slightly affects Home’s two reaction coefficients. When Home’s pass-through increases, this effect becomes more significant.
The preceding three cases show that the cooperation policy and Nash policy are identical in the LCP and PCP cases but different in the SCP case. However, when are the optimal policies of cooperation and noncooperation identical? Propositions 1 and 2 show that the Nash policy is not the same as the cooperation policy in general, because the solutions of (42) and (45) are different. For better understanding, a numerical example is presented to compare these two solutions.
Set
 $n=0.5$
,
 $\gamma=0.25$
,
 $\phi=1.5$
, and
 $\rho=0$
again, and given
 $\tau^*=0$
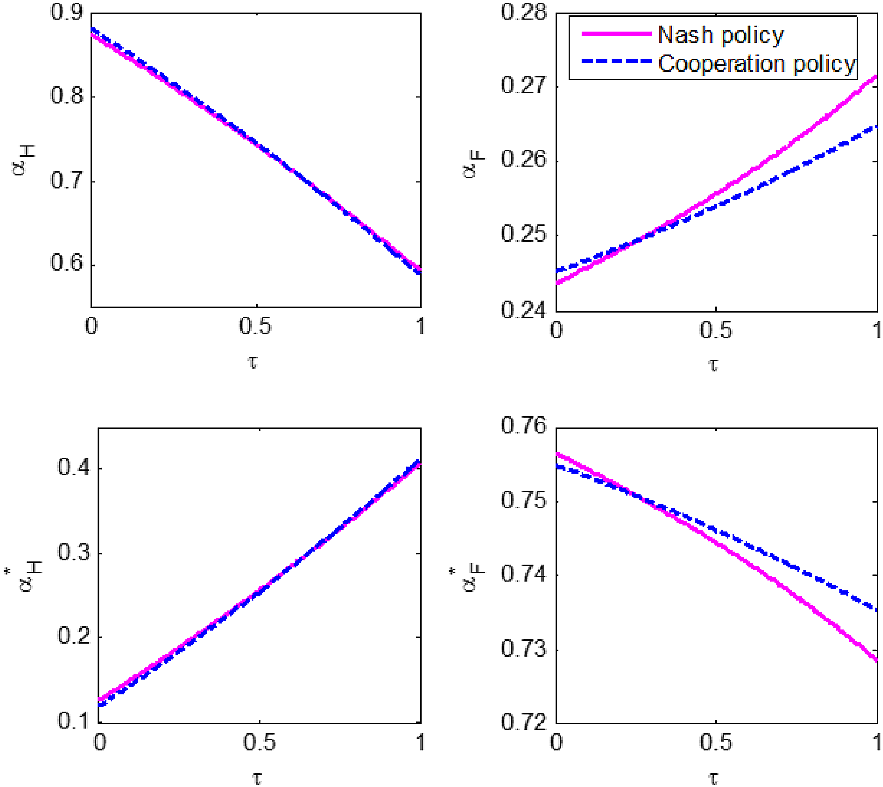
. Figure 2 depicts the Nash policy and cooperation policy of both countries along with the changes in exchange rate pass-through in Home.
Nash policy and cooperation policy under different exchange rate pass-through in Home.
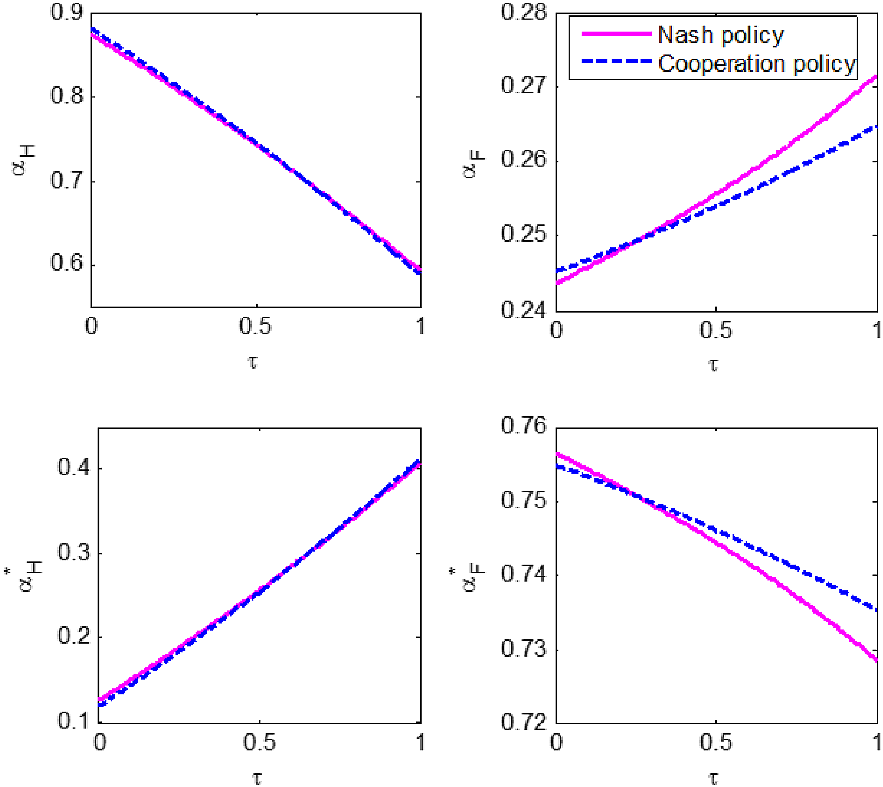
Figure 2 clearly indicates that the cooperation policy is different from the Nash policy except for a certain value of parameter
 $\tau$
. When
 $\tau$
is smaller than that certain value, Home’s cooperation policy reacts more to domestic shocks than to foreign shocks than its Nash policy. On the contrary, when
 $\tau$
is larger than that certain value, Home’s cooperation policy reacts less to domestic shocks than its Nash policy. Foreign’s responses can be similarly found. In short, when Home’s exchange rate pass-through is low, the Nash policies of both countries will underreact to Home’s shocks and overreact to Foreign’s shocks, compared with the cooperation policy. Meanwhile, when Home’s pass-through is high, the Nash policies of both countries will overreact to Home’s shocks and underreact to Foreign’s shocks.
3.7 The DCP case
Recent evidence documents the importance of DCP (Gopinath et al. (Reference Gopinath, Boz, Casas, Diez, Gourinchas and Plagborg-Moller2020)). Boz et al. (Reference Boz, Gopinath and Plagborg-Moller2019) reveal that the majority of international trade is invoiced in dominant currencies, specifically the US dollar. This motivates further exploration of exchange rate pass-through. Our two-country model, Home and Foreign, cannot explicitly include the third (dominant) currency. However, we develop a case when
 $\tau+\tau^*=1$
in our two-country model to mimic the DCP case. We use the following example to explain this case.
The trade between Home and Foreign is invoiced in the third dominant pricing currency. Suppose that Home’s currency appreciates against the third currency by x, and Foreign’s currency depreciates against the third currency by y. Thus, Home’s currency appreciates against that of Foreign by
 $x+y$
. Correspondingly, the export price from Home to Foreign increases by y in Foreign’s currency, and the export price from Foreign to Home decreases by x in Home’s currency. Therefore, the degrees of exchange rate pass-through of Home’s and Foreign’s import price are
 $\tau=x/(x+y)$
and
 $\tau^*=y/(x+y)$
, respectively. The summation of the two countries’ exchange rate pass-through (
 $\tau+\tau^*$
) is
 $[x/(x+y)]+[y/(x+y)]=1$
. Thus, the DCP case can be translated into the case when
 $\tau+\tau^*=1$
in our two-country model. Then, we analyze the monetary cooperation problem with an additional binding constraint, where
 $\tau+\tau^*=1$
. With this assumption, we adopt a numerical simulation to emphasize the optimal policy. Figure 3 depicts the simulation results, given the parameter values:
 $n=0.5$
,
 $\gamma=0.25$
,
 $\phi=1.5$
, and
 $\rho=0$
,
Nash policy and cooperation policy under the DCP case.

When Home’s currency is stable against the third currency and Foreign’s currency is otherwise, the reaction coefficients of Home’s optimal policy relevant to its shocks are greater than those relevant to Foreign’s shocks under the Nash and cooperation equilibria. As Home’s currency stability against the third currency decreases and Foreign’s increases, respectively, the reaction coefficients of Home’s optimal policy decrease and those of Foreign’s increase with Home’s and Foreign’s shocks, respectively. Thees results are still due to terms of trade externality. Furthermore, the impact of exchange rate changes on terms of trade decreases in the country with stable exchange rate against the dominant pricing currency, resulting in the reduced influence of foreign factors. Domestic monetary policy can focus on domestic shocks than on foreign shocks.
Home and Foreign need to cooperate in their monetary policies under the DCP case. Figure 3 depicts that when Home’s currency is stable against the third currency (
 $\tau$
is smaller), its monetary policy underreacts to domestic shocks and overreacts to foreign shocks, compared with its cooperation scenario. In contrast, when Home’s currency is unstable against the third currency (
 $\tau$
is greater), its monetary policy overreacts to domestic shocks and underreacts to foreign shocks, compared with the cooperation scenario.
4. When does cooperation lead to a pareto improvement?
The present analysis shows that cooperation may not lead to a Pareto improvement. In other words, cooperation brings either no gain at all or good for one country and is bad for the other. Are there any cases in which both countries’ households are better off?
4.1 Conditions of a pareto improvement
The model can be solved by computing the welfare of each household and comparing the welfare under different scenarios. For Home, the condition that the cooperation policy is better than the Nash policy is
 \begin{equation}\Omega^N_p>\Omega^C_p,\end{equation}
where
 $\Omega_p$
is defined in (25),
 $\Omega^N_p$
is the value of
 $\Omega_p$
under the Nash policy, and
 $\Omega^C_p$
is the value of
 $\Omega_p$
under the cooperation policy. Given the values of the other parameters, whether Home’s welfare in the Nash policy is higher than that in the cooperation policy depends on two pass-through parameters
 $\tau$
and
 $\tau^*$
. Let
 $n=0.5$
,
 $\gamma=0.25$
,
 $\phi=1.5$
, and
 $\rho=0$
and assume that the variances of technological shocks of both Home and Foreign are the same. Figure 4 shows the relationship of the degrees of exchange rate pass-through and Home’s welfare. In Figure 4, the white area shows the parameters’ region that the welfare of Home’s households from the Nash policy is better than that from the cooperation policy, and the colored area shows the opposite. This figure indicates that Home’s central bank prefers the cooperation policy when the exchange rate pass-through is high in Home and low in Foreign and prefers the Nash policy otherwise. Each point along the border of the two areas shows Home’s indifference over these two policies. Both the LCP and PCP cases lie on the border. The SCP case is located in the “Cooperation Area,” that is, the cooperation policy is preferred by Home’s central bank. Similarly, Foreign’s central bank prefers the cooperation policy when the exchange rate pass-through is high in Foreign and low in Home and prefers the Nash policy when the pass-through is low in Foreign and high in Home. However, the policy choices of two countries may not be compatible.
Policy preferring of Home’s central bank.

We need to search for the conditions under which both countries are better off. It requires that the condition (51) holds for both Home and Foreign.
Given
 $n=0.5$
,
 $\gamma=0.25$
,
 $\phi=1.5$
, and
 $\rho=0$
, the values of
 $\tau$
and
 $\tau^*$
that satisfy (51) are shown in Figure 5 (the colored area). When the values of the two pass-through parameters are close to each other (located in the diagonal area of Figure 5), it is a Pareto improvement to switch from the Nash policy to the cooperation policy for both countries. In the white area in Figure 5, the cooperation policy can only improve a country’s welfare while worsening the other. The SCP case, located in this white area, is a special case.
The condition of the cooperation policy with Pareto improvement.

The symmetry of the colored area in Figure 5 is altered in case of unequal sizes of two countries. Figure 6 shows the case with
 $n=0.25$
. The cooperation policy domination areas of each country in this case differ significantly from those in the symmetric case and from each other. The large country has a large range of parameter values of Cooperation Area (Figure 6(b)), while the small country’s Cooperation Area is small (Figure 6(a)). The conjunct area of the two countries’ Cooperation Area is also asymmetric (Figure 6(c)). A necessary condition to improve the welfare of both countries is that the extent of the large country’s exchange rate pass-through is lower than that of the small country.
Policy domination when
 $n=0.25.$
(a) The colored area is Home’s Cooperation Area, (b) the colored area is Foreign’s Cooperation Area, and (c) the colored area is the conjunct of two countries’ Cooperation Areas.

4.2 Incentives of cooperation
The solutions of the Nash equilibrium and the cooperation equilibrium reveal that these two equilibriums coincide only in a few cases. The cooperation incentive in these cases is trivial. In the other cases, the Nash policy is always better for both countries from their own perspectives. However, another interesting question that arises is whether the other country has an incentive to cooperate given that one country is cooperating. We examine this incentive problem with another numerical example (Figure 7). Given the benchmark values of parameters and
 $\tau^*=0.5$
, the mixed lines in Figure 7(a) and (b) show the Nash responses of Home, determined by (43), at different values of
 $\tau$
when Foreign follows the cooperation policy.
The sensitivity of Home’s Nash rules with respect to the exchange rate pass-through when Foreign uses cooperation policy.

Figure 7 shows an interesting result of the incentive problem. When Home’s exchange rate pass-through is low, given the cooperation policy of Foreign, Home’s self-interested policy is close to its Nash policy and away from its cooperation policy, that is, the mixed line is coinciding with the Nash line and away from the cooperation line in Figure 7 (a) and (b) at small values of
 $\tau$
. When the Home’s pass-through is high, its self-interested policy is close to its cooperation policy and away from its Nash policy, that is, the mixed line is near the cooperation line and away from the Nash line in Figure 7 (a) and (b) at large values of
 $\tau$
. This implies that the willingness to cooperate rises with exchange rate pass-through. A country with a high pass-through has more incentive to cooperate, and the opposite is true for one with a low pass-through. This is a generalized conclusion of the SCP case.
The exchange rate pass-through of one country also impacts the cooperation incentive of the other. The mixed lines in Figure 7(c) and (d) show the optimal policy of self-interested Home given the cooperation policy of Foreign at the benchmark values of parameters and
 $\tau=0.5$
. These lines imply that Home’s self-interested policy is close to its cooperation policy at low degrees of Foreign’s exchange rate pass-through, and close to its Nash policy at high degrees of Foreign’s pass-through. This indicates that one country has high incentive to cooperate with others when the degrees of other countries’ pass-through are low. The SCP case is an extreme case.
5. Implications for exchange rate regime choices
This section presents the policy implications of the preceding analysis on exchange rate arrangements. As indicated by Devereux et al. (Reference Devereux, Engel and Tille2003), the optimal monetary policy in a two-country model is equivalent to a fixed exchange rate regime. We want to examine whether fixed exchange rate regime remains optimal in this model.
5.1 Will the variations in exchange rates diminish under cooperation?
The variations in exchange rates can be calculated by (37) after we specify the policy rules:
 \begin{equation}\sigma^2_s=[b(\bar{\alpha}_H-\bar{\alpha}_F)]^2\sigma^2_u+[b(\bar{\alpha}^*_H-\bar{\alpha}^*_F)]^2\sigma^2_{u^*}.\end{equation}
Because of the complex expression of the policy rules in general cases, we focus on three special cases first. In the LCP case, the Nash and the cooperation policies for both countries are identical, so the variations of exchange rates under both the scenarios are the same as
 \begin{equation}\sigma^2_{s,LCP}=(1-\gamma)^2(\sigma^2_u+\sigma^2_{u^*}).\end{equation}
There are two points observed in (53). First, the variations in exchange rates are in proportion to the sum of the variances of technological shocks of both countries. This expression is the same with the equation (21) in the study by Duarte and Obstfeld (Reference Duarte and Obstfeld2008) because the LCP model in this paper is the same as theirs except that they specify the monetary policies as quantity rules. Second, the variations in the exchange rate are also in proportion to the size of nontradable sector in both countries (represented by
 $1-\gamma$
). Given the variances in technological shocks of both countries, the larger the size of the nontradable sector, the larger the variations in exchange rates. In an extreme case, when
 $\gamma=1$
, that is, there is no nontradable sector in the economy and the variations in exchange rates are absent. Thus, the optimal monetary policy in the LCP case is equivalent to that in the fixed exchange rate regime, similar to the case in the study by Devereux et al. (Reference Devereux, Engel and Tille2003). In this sense, the current model is a generalized version of the models of Devereux et al. (Reference Devereux, Engel and Tille2003) and Duarte and Obstfeld (Reference Duarte and Obstfeld2008). Their models can be taken as two special cases of the current model.
In the PCP case, the Nash policy and the cooperation policy are identical. Thus, the variations in exchange rates under both the scenarios are
 \begin{equation}\sigma^2_{s,PCP}=[1-(2+\phi)\gamma]^2(\sigma^2_u+\sigma^2_{u^*}).\end{equation}
In the SCP case, the variations in exchange rates under the Nash policy are
 \begin{equation}\sigma^{2,N}_{s,SCP}=(1-n\gamma)^2(\sigma^2_u+\sigma^2_{u^*}).\end{equation}
In addition, the variations in exchange rates under the cooperation policy are
 \begin{equation}\sigma^{2,C}_{s,SCP}=\frac{1}{(1+n\gamma)^2}(\sigma^2_u+\sigma^2_{u^*}).\end{equation}
A comparison of (56) and (55) shows that the variations in exchange rates under the cooperation policy are larger than those under the Nash policy.
Given
 $\gamma=0.25$
and
 $\phi=1.5$
, it can be verified by the numerical simulation that the variations in exchange rates under the cooperation policy are larger than those under the Nash policy at any values of
 $\tau$
,
 $\tau^*$
, and n, except for the PCP and LCP cases. This is because both countries have incentives to reduce the negative effect of the variations in exchange rates. For example, when Home experiences a positive technological shock, the Home’s central bank will cut down interest rate to make use of this advantage. However, a lower interest rate in Home leads to the appreciation of Foreign’s currency. The Foreign’s central bank will also reduce the interest rate to counteract this negative effect. As a result, the exchange rate will not change substantially. However, under cooperation, from a global perspective, appreciation of Foreign’s currency is necessary to understand this advantage.
5.2 Why do some countries prefer fixed exchange rate regime?
The preceding analysis shows that monetary cooperation will increase the variations in exchange rates, regardless of exchange rate pass-through. However, in reality, some developing countries prefer fixed exchange rate regime when they face a high exchange rate pass-through. Moreover, it is easy to verify that the welfare of Home does not improve when Home switches from its Nash policy to fixed exchange rate regime, given that Foreign adopts the Nash policy. Thus, the model presented cannot provide a rationale to justify why some developing countries prefer fixed exchange rate regime. This problem can be resolved by modifying the benchmark model.
We conjecture that incapability to control monetary policy may be the cause to opt for fixed exchange rate regime for the developing countries. In the following section, we extend the benchmark model by assuming that Home’s central bank cannot control its interest rate precisely. Accordingly, Home’s interest rate rule is assumed to be
 \begin{equation}r_t=r+\phi p_t-\alpha_Hu_t-\alpha^*_Hu^*_t+w_t,\end{equation}
where
 $w_t$
is a white noise with
 $\mathbb{E} w_t=0$
and
 $Var(w_t)=\sigma^2_w$
. When
 $\sigma^2_w=0$
, the model reduces to the benchmark one. The magnitude of
 $\sigma^2_w$
measures the controllability of Home’s monetary policy.
Incomplete controllability of monetary policy creates another type of shocks in the economy. These monetary shocks can affect real variables through the interest rate channel due to nominal stickiness. As a result, they may affect the intertemporal consumption decisions of households, which, in turn, changes aggregate demand and output. Therefore, monetary uncontrollability may bring economic fluctuations and reduce welfare. From this perspective, fixed exchange rate regime could potentially be desirable, because it reduces the impact of such monetary shocks. However, fixed exchange rate regime also restricts the central bank to use monetary tool to counteract the effects from other types of shocks, such as technological shocks. Therefore, fixed exchange rate regime might be a better policy when the former benefit dominates the latter cost. We formally model this trade-off in this version of the model. Furthermore, we will show that the magnitudes of these two opposite effects of fixed exchange rate regime are associated with the degrees of exchange rate pass-through.
The condition is derived under which Home’s welfare under fixed exchange rate regime is higher than that under the interest rate rule specified in (57):
 \begin{equation}\sigma^2_w>G(\gamma,n,\phi,\tau,\tau^*)(\sigma^2_u+\sigma^2_{u^*}),\end{equation}
where
 $G(\gamma,n,\phi,\tau,\tau^*)>0$
is a function of model’s parameters, including preference, country size, price coefficient in the interest rate rule, and the degrees of both countries’ exchange rate pass-through. This expression has two implications. First, the relative magnitude of monetary shocks and technological shocks determine whether fixed exchange rate regime is preferable. When the variations in Home’s monetary shocks are larger than the product of G and the sum of technological shocks of two countries, fixed exchange rate regime performs better than the interest rate rule.
Footnote 10
This result is intuitive. The welfare deterioration from monetary shocks offsets the benefit of the interest rate rule from reacting to the technological shocks. Meanwhile, fixed exchange rate regime can rule out the negative effect of monetary shocks although it limits the central bank’s ability to intervene the economy. When monetary shocks are dominating in the economy, fixed exchange rate regime is desirable.
Second, (58) also shows that some parameters significantly affect the policy preference. We mainly focus on two types of parameters: the degree of exchange rate pass-through and the country size. It can be verified that the first-order derivatives of G function satisfy
 \begin{equation}\frac{\partial G}{\partial \tau}<0, \quad \frac{\partial G}{\partial \tau^*}<0, \quad \frac{\partial G}{\partial n}>0.\end{equation}
Hence, G is a decreasing function of exchange rate pass-through. With the benchmark values of other parameters, Figure 8 shows the property of the function G: G is very sensitive to the degrees of Home’s exchange rate pass-through. A higher degree of Home’s pass-through translates into a smaller value of G, implying that the condition (58) is easier to satisfy. Therefore, a fixed exchange rate regime might be preferable for Home when its degree of exchange rate pass-through is high. This is because fixed exchange rate regime can help eliminate the externality of the terms of trade, arising from exchange rate pass-through. Moreover, the degree of Foreign’s pass-through also influences the Home’s policy preference. Similar to the effect of Home’s pass-through, a fixed exchange rate regime is preferable for Home when Foreign’s pass-through is high. The reason is also rooted in the externality of the terms of trade. When the degree of Foreign’s pass-through is high, Foreign’s central bank needs to adopt more active policy to alleviate the negative impact from Home’s shocks, which increases the variations in exchange rates. Greater variations in exchange rates lead to greater negative externality of the terms of trade and subsequently, a lower level of welfare of Home. Under this condition, a fixed exchange rate regime might be preferable for Home.
The property of the function G.

The function G is also an increasing function of country size, indicating that small countries prefer a fixed exchange rate regime more. This is because the degree of openness of a small country is higher than that of a large country. As a result, a small country is highly affected by foreign shocks compared with a large country, and so is the externality of terms of trade. Thus, a fixed exchange rate regime, which helps in reducing the externality of the terms of trade, brings more benefits for a small country.
In reality, those countries with a flexible exchange rate regime are either large countries or have currencies broadly accepted in international trade, or both. Meanwhile, those countries adopting fixed exchange rate regime are either small or have unacceptable local currencies in international trade. The degrees of exchange rate pass-through and country size appear highly significant in exchange rate regime choice.
6. Concluding remarks
Exchange rate pass-through significantly affects international monetary policy cooperation. Earlier studies have not arrived at a consensus on welfare gains in international monetary policy cooperation in PCP and LCP cases. A general equilibrium model with monopolistic firms and nominal rigidities in this paper shows that cooperation gains arise when exchange rate pass-through is incomplete. However, the cooperation gains are not equally distributed across countries. The country with a higher degree of exchange rate pass-through gains more from cooperation and thus has a greater incentive to participate. Furthermore, when the degrees of exchange rate pass-through of two countries largely vary from each other, cooperation may improve the welfare of the country with a high pass-through and worsen that of the country with a low pass-through. In this case, the incentives of two countries to cooperate are incompatible.
Our model also highlights the choice of exchange rate regime. We find that in the benchmark model, the variations in exchange rates are higher under the cooperation policy than those under the Nash policy. This cannot explain why some countries prefer fixed exchange rate regime. We extend the benchmark model by including a monetary controllability problem, and this extended model explains why small developing countries prefer a fixed exchange rate regime. A fixed exchange rate regime can eliminate both monetary uncertainty and the negative externality of terms of trade. However, it restricts a central bank from reacting to other shocks. When the former benefit dominates the latter cost, a fixed exchange rate regime is preferred. Furthermore, the degree of exchange rate pass-through and the size of the country significantly affect the exchange rate regime choice. A smaller country with a higher degree of exchange rate pass-through benefits more from fixed exchange rate regime.
The analysis in this study is still limited in the understanding of the international monetary cooperation. As mentioned earlier, several other mechanisms exist, in addition to incomplete exchange rate pass-through, through which cooperation policy can contribute to reducing terms of trade externality. These include more general preferences, trade structure, trade cost, production structure, incomplete asset markets, and asymmetries in nominal inertia (Canzoneri et al. (Reference Canzoneri, Cumby and Diba2005); Benigno and Benigno (Reference Benigno and Benigno2006); Coenen et al. (Reference Coenen, Lombardo, Smets and Straub2007); Liu and Pappa (Reference Liu and Pappa2008)). There are gains from cooperation under each of these specifications. An interesting question is how these mechanisms are interlinked to contribute to cooperation gains, which deserves further inquiry.
Acknowledgements
Supports from China National Social Science Fund (Project #: 18BJL106), Program for Innovation Research in Central University of Finance and Economics and China National Science Fund (Project # 71850005) are gratefully acknowledged. Any remaining errors are the authors’ responsibility.
A. Appendix
A.1 Proof of Expression (24) and (31):
The log forms of Home’s prices in Table 1 are
 \begin{equation}p_{N,t}=p_{H,t}=ln\frac{\theta\eta}{\theta-1}+p_{t|t-1}+c_{t|t-1}-a_{t|t-1}+\Gamma_{P_D},\end{equation}
 \begin{equation}p^*_{F,PCP,t}=ln\frac{\theta\eta}{\theta-1}+p_{t|t-1}+c_{t|t-1}-a^*_{t|t-1}+\Gamma_{P_{F,PCP}},\end{equation}
 \begin{equation}p_{F,LCP,t}=ln\frac{\theta\eta}{\theta-1}+p_{t|-1}+c_{t|t-1}-a^*_{t|t-1}+\Gamma_{P_{F,LCP}},\end{equation}
where
 $\Gamma_{P_D}=\frac{1}{2}(\sigma^2_p+\sigma^2_c-\sigma^2_u)+\sigma_{pc}-\sigma_{pu}-\sigma_{cu}$
,
 $\Gamma_{P^*_{F,PCP}}=\frac{1}{2}(\sigma^2_p+\sigma^2_c+\sigma^2_s+\sigma^2_{u^*})+\sigma_{pc}-\sigma_{ps}-\sigma_{pu^*}-\sigma_{cs}-\sigma_{cu^*}+\sigma_{su^*}$
, and
 $\Gamma_{P_{F,LCP}}=\frac{1}{2}(\sigma^2_p+\sigma^2_c+\sigma^2_{u^*})+\sigma_{pc}-\sigma_{pu^*}-\sigma_{cu^*}$
.
So we have
 \begin{align}P_{F,t}&= \tau p^*_{F,PCP,t}+(1-\tau)p_{F,LCP,t} \notag \\&= ln \frac{\theta\eta}{\theta-1}+p_{t|t-1}+c_{t|t-1}-a^*_{t|t-1}+\tau(s_t-s_{t|t-1})+\Gamma_{P_F},\end{align}
where
 $\Gamma_{P_F}=\tau\Gamma_{P^*_{F,PCP}}+(1-\tau)\Gamma_{P_{F,LCP}}$
. Then the log form of consumer price index is
 \begin{align*}p_t&=(1-\gamma)p_{N,t}+\gamma[np_{H,t}+(1-n)p_{F,t}]\\&=\Omega_p+p_{t|t-1}+c_{t|t-1}+(1-n)\gamma\tau(s_t-s_{t|t-1})-\Theta_{t|t-1},\end{align*}
where
 $\Omega_p=ln\frac{\theta\eta}{\theta-1}+(1-\gamma)\Gamma_{P_N}+\gamma[n\Gamma_{P_H}+(1-n)\Gamma_{P_F}]$
and
 $\Theta_t=[1-(1-n)\gamma]a_t+(1-n)\gamma a^*_t$
.
The counterpart expression (27) for Foreign’s price level can be deduced similarly.
The log form of Home’s intertemporal condition is
 \begin{equation}r_t=-ln\beta+p_{t+1|t}-p_t+c_p{t+1|t}-c_t-\frac{1}{2}(\sigma^2_p+\sigma^2_c)-\sigma_{pc}.\end{equation}
Combining it with the interest rate rule, we have
 \begin{equation}(1+\phi)p_t=p_{t+1|t}+c_{t+1|t}-c_t+\alpha_Hu_t+\alpha^*_Hu^*_t-r-ln\beta-\frac{1}{2}(\sigma^2_p+\sigma^2_c)-\sigma_{pc}.\end{equation}
Denote
 $\bar{p}_t=p_t-(1-n)\gamma\tau(s_t-s_{t|t-1})$
, we have
 $\bar{p}_{t|t-1}=p_{t|t-1}=\bar{p}_t$
. Then (A.7) can be written as:
 \begin{equation}(1+\phi)\bar{p}_t=\bar{p}_{t+1|t-1}+c_{t+1|t-1}-c_{t|t-1}-r-ln\beta-\frac{1}{2}(\sigma^2_p+\sigma^2_c)-\sigma_{pc}.\end{equation}
Iterating (A.8), we get
 \begin{equation}\bar{p}_t=\sum_{k=0}^{\infty}(1+\phi)^{-k-1}(c_{t+k+1|t-1}-c_{t+k|t-1}-\Omega_p,\end{equation}
where
 $\Omega_{\bar{p}}=[r+ln\beta+(\sigma^2_p+\sigma^2_cc)/2+\sigma_{pc})/\phi$
. (25) shows that
 \begin{equation}c_{t+k+1|t-1}-c_{t+k|t-1}=\Theta_{t+k+1|t-1}-\Theta_{t+k|t-1}=\rho^{k+1}(\Theta_{t|t-1}-\Theta_{t-1}).\end{equation}
Substituting (A.10) into (A.9), we obtain
 \begin{equation}\bar{p}_t=-\Omega_p+\frac{\rho}{1+\phi-\rho}(\Theta_{t|t-1}-\Theta_{t-1}).\end{equation}
So the log Home’s consumer price index can be expressed as (31).
A.2 Proof of Proposition 1:
The aim of Home’s central bank is choosing the coefficient and to maximize expected utility of households, which is equivalent to
 \begin{equation}\min_{\bar{\alpha}_H,\bar{\alpha}_H^*} \Omega_P,\end{equation}
where
 $\Omega_p$
is defined in (43). Using (26),
 $\Omega_p$
can be simplified as:
 \begin{equation}\Omega_p=ln\frac{\theta\eta}{\theta-1}+\frac{1}{2}[\sigma^2_c+\zeta(1-\zeta)\sigma^2_s+\sigma^2_{\vartheta}]-\sigma_{c\vartheta}+[1-(1-n)\gamma]\zeta(\sigma_{su^*}-\sigma_{su}).\end{equation}
The variance and covariance in (A.13) are
 \begin{align*}\sigma_c^2&=[(1+\xi)\bar{\alpha}_H-\xi\bar{\alpha}_F]^2\sigma^2_u+[(1+\xi)\bar{\alpha}^*_H-\xi\bar{\alpha}^*_F]^2\sigma^2_{u^*}\\\sigma_s^2&=[b(\bar{\alpha}_H-\bar{\alpha}_F)]^2\sigma^2_u+[b(\bar{\alpha}^*_H-\bar{\alpha}_F)]^2\sigma^2_{u^*}\\\sigma^2_{\vartheta}&=[1-(1-n)\gamma]^2\sigma_u^2+[(1-n)\gamma]^2\sigma^2_{u^*}\\\sigma_{c\vartheta}&=[1-(1-n)\gamma][(1+\xi)\bar{\alpha}_H-\xi\bar{\alpha}_F]\sigma^2_u+(1-n)\gamma[(1+\xi)\bar{\alpha}^*_H-\xi\bar{\alpha}^*_F]\sigma^2_{u^*}\\\sigma_{su}&=b(\bar{\alpha}_H-\bar{\alpha}_F)\sigma^2_u\\\sigma_{su^*}&=b(\bar{\alpha}^*_H-\bar{\alpha}^*_F)\sigma^2_{u^*}.\end{align*}
The first-order conditions for
 $\bar{\alpha}_H$
and
 $\bar{\alpha}^*_H$
are
 \begin{equation}A\bar{\alpha}_H-B\bar{\alpha}_F=D,\end{equation}
 \begin{equation}A\bar{\alpha}^*_H-B\bar{\alpha}^*_F=K,\end{equation}
where
 $A=(1+\xi)^2+\zeta(1-\zeta)b^2$
,
 $B=\xi(1+\xi)+\zeta(1-\zeta)b^2$
,
 $D=[1-(1-n)\gamma](1+\xi+\zeta b)$
, and
 $K=(1-n)\gamma(1+\xi+\zeta b)-\zeta b$
.
Similarly, we can simplify Foreign’s
 $\Omega_{P^*}$
as follows:
 \begin{equation}\Omega_{P^*}=ln\frac{\theta\eta}{\theta-1}+\frac{1}{2}[\sigma^2_{c^*}+\zeta^*(1-\zeta^*)\sigma^2_s+\sigma^2_{\vartheta^*}]-\sigma_{c^*\vartheta^*}+(1-n\gamma)\zeta^*(\sigma_{su^*}-\sigma_{su}).\end{equation}
The variance and covariance are
 \begin{align*}&\sigma^2_c=[-\xi^*\bar{\alpha}_H+(1+\xi^*)\bar{\alpha}_F]^2\sigma^2_u+[-\xi^*\bar{\alpha}^*_H+(1+\xi^*)\bar{\alpha}^*_F]^2\sigma^2_{u^*}\\&\sigma^2_{\vartheta^*}=(n\gamma)^2\sigma^2_u+(1-n\gamma)^2\sigma^2_{u^*}\\&\sigma_{c^*\vartheta^*}=n\gamma[-\xi^*\bar{\alpha}_H+(1+\xi^*)\bar{\alpha}_F]\sigma^2_u+(1-n\gamma)[-\xi^*\bar{\alpha}^*_H+(1+\xi^*)\bar{\alpha}^*_F]\sigma^2_{u^*}.\end{align*}
Solving the problem of the self-interested Foreign’s central bank, we can get the following first-order conditions:
 \begin{equation} -B^*\bar{\alpha}_H+A^*\bar{\alpha}_F=D^*,\end{equation}
 \begin{equation} -B^*\bar{\alpha}^*_H+A^*\bar{\alpha}^*_F=K^*,\end{equation}
where
 $A^*=(1+\xi^*)^2+\zeta^*(1-\zeta^*)b^2$
,
 $B^*=\xi^*(1+\xi^*)+\zeta^*(1-\zeta^*)b^2$
,
 $D^*=(1-n\gamma)(1+\xi^*+\zeta^* b)$
, and
 $K^*=n\gamma(1+\xi^*+\zeta^* b)-\zeta^* b$
.
Combining (A.14), (A.15), (A.17), and(A.18), we get the Proposition 1.
A.3 Proof of Proposition 2:
The aim function under cooperation is to maximize (44), which is equivalent to
 \begin{equation}\min_{\bar{\alpha}_H,\bar{\alpha}_H^*,\bar{\alpha}_F,\bar{\alpha}^*_F} n\Omega_P+(1-n)\Omega_{P^*.}\end{equation}
The first-order conditions of this problem are the same as that of Proposition 2.
A.4 Proof of Condition (58):
When Home’s interest rate rule is in the form (57), solutions (37), (38), and (39) become
 \begin{align}&s_t-s_{t|t-1}=b(\bar{\alpha}_H-\bar{\alpha}_F)u_t+b(\bar{\alpha}^*_H-\bar{\alpha}^*_F)u^*_t+bw_t,\end{align}
 \begin{align}&c_t-c_{t|t-1}=[(1+\xi)\bar{\alpha}_H-\xi\bar{\alpha}_F]u_t+[(1+\xi)\bar{\alpha}^*_H-\xi\bar{\alpha}^*_F]u^*_t+(1+\xi)w_t,\end{align}
 \begin{align}&c_t^*-c^*_{t|t-1}=[-\xi^*\bar{\alpha}_H+(1+\xi^*)\bar{\alpha}_F]u_t+[-\xi^*\bar{\alpha}^*_H+(1+\xi^*)\bar{\alpha}^*_F]u^*_t-\xi^*w_t.\end{align}
The expression
 $\Omega_P$
becomes
 \begin{equation}\Omega^w_P=\Omega^N_P+\frac{1}{2}A\sigma^2_w.\end{equation}
The expression
 $\Omega^N_P$
in (A.23) is the expression of (A.13) under the Nash equilibrium, which can be reduced as the following form:
 \begin{equation*}\Omega_P^N=ln\frac{\theta\eta}{\theta-1}+\frac{1}{2}f(\gamma,n,\tau,\tau^*)(\sigma^2_u+\sigma^2_{u^*}),\end{equation*}
where
 $f(\gamma,n,\tau,\tau^*)$
is a function of parameters
 $\gamma$
, n,
 $\tau$
, and
 $\tau^*$
.
When Home adopts the fixed exchange rate regime, (26) and (29) become
 $p_t=p_{t|t-1}$
and
 $p^*_t=p^*_{t|t-1}$
. Then, (33) and (34) implies that
 $c_t-c_{t|t-1}=c^*_t-c^*_{t|t-1}=\alpha_Fu_t+\alpha^*_Fu^*_t$
. Under this condition, the optimal policy of self-interested Foreign’s central bank is
 $\bar{\alpha}_F=n\gamma$
and
 $\bar{\alpha}^*_F=1-n\gamma$
.
The expression
 $\Omega_P$
under the fixed exchange rate regime becomes
 \begin{array}{*{20}{c}}
{\Omega _P^s} \hfill & { = ln\frac{{\theta \eta }}{{\theta - 1}} + \frac{1}{2}(\sigma _c^2 + \sigma _\vartheta ^2) - {\sigma _{c\vartheta }}} \hfill \\
{} \hfill & { = ln\frac{{\theta \eta }}{{\theta - 1}} + \frac{1}{2}{{(1 - \gamma )}^2}(\sigma _u^2 + \sigma _{{u^*}}^2).} \hfill \\
\end{array}
Whether the Home’s households are better off under the fixed exchange rate regime depends on the relative magnitude of
 $\Omega^w_P$
and
 $\Omega^s_P$
. The condition that the welfare of the fixed exchange rate regime is higher than that in interest rate rule is
 $\Omega^w_P>\Omega^s_P$
, that is,
 \begin{equation}\sigma^2_w>G(\gamma,n,\tau,\tau^*)(\sigma^2_u+\sigma^2_{u^*})\end{equation}
where
 $G(\gamma,n,\tau,\tau^*)=[(1-\gamma)^2-f(\gamma,n,\tau,tau^*)]/A$
.
A.5 Model Extension
Here, we relax the assumption that the intratemporal elasticity of substitution between domestic and import goods and intertemporal elasticity of substitution in consumption equal one. We demonstrate that the main results hold under a more general assumption. Accordingly, we assume that the household’s utility function is a constant relative risk aversion (CRRA) function with risk aversion coefficient (intertemporal elasticity of substitution in consumption)
 $\chi$
. In addition, the intratemporal elasticity of substitution between domestic and import goods is assumed to be
 $\epsilon$
.
A.5.1 The model
The household’s optimization problem is as follows:
 \begin{equation*}Max \; E\Sigma_{t=0}^{\infty}\;\beta^t[\frac{C_t^{1-\chi}}{1-\chi}-\eta L_t]\end{equation*}
 \begin{equation*}s.t. \quad P_tC_t+E_t(Q_{t+1}B_{t+1})=W_tL_t+\Pi_t+B_t.\end{equation*}
Then, the corresponding consumption and price indices are as follows:
Similarly as in the main text, we can reach three key equations about exchange rate, Home’s and Foreign’s consumption:
 \begin{equation}s_t-s_{t|t-1}=b(\bar{\alpha}_H-\bar{\alpha}_F)u_t+b(\bar{\alpha}_H^*-\bar{\alpha}_F^*)u_T^*,\end{equation}
 \begin{equation}\chi(C_t-C_{t|t-1})=[(1+\xi)\bar{\alpha}_H-\xi\bar{\alpha}_F]u_t+[(1+\xi)\bar{\alpha}_H^*-\xi \bar{\alpha}_F^*]u_t^*,\end{equation}
 \begin{equation}\chi (C_t^*-C^*_{t|t-1})=[-\xi^*\bar{\alpha}_H+(1+\xi^*)\bar{\alpha}_F]u_t+[-\xi^*\bar{\alpha}_H^*+(1+\xi)\bar{\alpha}_F^*]u_t^*.\end{equation}
Take the second-order logarithm expansion of Home’s household’s utility function as follows:
 \begin{equation*}C^{1-\chi}(C_{t|t-1}+\frac{1-\chi}{2}\sigma^2_c)-\eta L_{t|t-1},\end{equation*}
where
 $\chi C_{t|t-1}=-\Omega_p+\Theta_{t|t-1}$
.
Therefore, the expected utility maximization is equivalent to maximizing the following:
 \begin{equation}-\Omega_p+\frac{(1-\chi)\chi}{2}\sigma_{C}^2,\end{equation}
where
 $\Omega_{p}\equiv ln(\frac{\theta\eta}{\theta-1})+\chi \sigma_{pC}-\sigma_{C\vartheta}-\chi\sigma_{C\vartheta}+\frac{1}{2}(\sigma^2_{p}+\chi^2\sigma^2_{C}+\sigma^2_{\vartheta})+n\gamma\tau(\frac{1}{2}\sigma^2_s+\sigma_{ps}+\chi \sigma_{Cs}-\sigma_{su^*})+\gamma n(1-\epsilon)\tau(1-n\tau)\frac{1}{2}\sigma^2_s$
.
Similarly, we can arrive at Foreign’s maximization problem to maximize the following:
 \begin{equation}-\Omega_p^*+\frac{(1-\chi)\chi}{2}\sigma_{C^*}^2,\end{equation}
where
 $\Omega_{p^*}\equiv ln(\frac{\theta\eta}{\theta-1})+\chi \sigma_{p^*C^*}-\sigma_{C^*\vartheta^*}-\chi\sigma_{C^*\vartheta^*}+\frac{1}{2}(\sigma^2_{p^*}+\chi^2\sigma^2_{C^*}+\sigma^2_{\vartheta^*})+n\gamma\tau^*(\frac{1}{2}\sigma^2_s+\sigma_{p^*s}+\chi \sigma_{C^*s}-\sigma_{su})+\gamma n(1-\epsilon)\tau^*(1-n\tau^*)\frac{1}{2}\sigma^2_s$
.
Given the model solutions of (A.26), (A.27), and (A.28), we have the following Nash equilibrium policy by maximizing (A.29) and (A.30):
Proposition 4 Under the Nash equilibrium, central banks’ optimal policy rules are the solutions of the following:
 \begin{equation*} \left[ \begin{array}{c} \bar{\alpha}^N_H\\ \bar{\alpha}^N_F \end{array} \right] =\psi^{-1}\left[ \begin{array}{c} D\\ K^* \end{array} \right], \left[ \begin{array}{c} \bar{\alpha}^{*,N}_H\\ \bar{\alpha}^{*,N}_F \end{array} \right] = \psi^{-1}\left[ \begin{array}{c} K\\ D^* \end{array} \right], \end{equation*}
where
 $\psi=\left[\begin{array}{cc} A & -B\\ -B^* & A^* \end{array}\right],$
 $\left\{ \begin{array}{l} A=(2-\frac{1}{\chi})(1+\xi)^2+\zeta[(1-\zeta)+(1-\epsilon)(1-\tau+n\tau)]b^2\\ A^*=(2-\frac{1}{\chi})(1+\xi^*)^2+\zeta^*[(1-\zeta^*)+(1-\epsilon)(1-\tau+n\tau^*)]b^2 \end{array}\right.$
 $\left\{ \begin{array}{l} B=(2-\frac{1}{\chi})(1+\xi)\xi+\zeta[(1-\zeta)+(1-\epsilon)(1-\tau+n\tau)]b^2\\ B^*=(2-\frac{1}{\chi})(1+\xi^*)\xi^*+\zeta^*[(1-\zeta^*)+(1-\epsilon)(1-\tau+n\tau^*)]b^2 \end{array}\right.$
 $\left\{ \begin{array}{l} D=[1-\gamma(1-n)](1+\xi+\zeta b)\\ D^*=(1-\gamma n)(1+\xi^*+\zeta^*b) \end{array}\right.$
 $\left\{ \begin{array}{l} K=\gamma(1-n)(1+\xi+\zeta b)-\zeta b\\ K^*=\gamma n(1+\xi^*+\zeta^* b)-\zeta^*b \end{array}\right.$
.
Given the objective function of cooperation policy,
 $nU_{t|t-1}+(1-n)U^*_{t|t-1}$
, we have the following:
Proposition 5 Under the cooperation equilibrium, central banks’ optimal policy rules are the solutions of the following:
 $\left[\begin{array}{c}\bar{\alpha}^c_H\\ \bar{\alpha}^c_F\end{array}\right] =\Omega^{-1}\left[ \begin{array}{c} nD+(1-n)(n\gamma-K^*)\\ n[1-(1-n)\gamma-D]+(1-n)K^* \end{array}\right]$
 $\left[ \begin{array}{c} \bar{\alpha}^{*,c}_H\\ \bar{\alpha}^{*,c}_F\end{array}\right]=\Omega^{-1} \left[\begin{array}{c}nK+(1-n)(1-n\gamma-D^*)\\ n[(1-n)\gamma-K]+(1-n)D^* \end{array}\right], $
where
 $\Omega=\left[\begin{array}{cc} nA+(1-n)P^* & -nB-(1-n)Q^*\\ -nQ-(1-n)B^* & nP+(1-n)A^*\end{array}\right]$
 $\left\{ \begin{array}{c} P=(2-\frac{1}{\chi})\xi^2+\zeta[(1-\zeta)+(1-\epsilon)(1-\tau+n\tau)]b^2\\ P^*=(2-\frac{1}{\chi})\xi^{*2}+\zeta^*[(1-\zeta^*)+(1-\epsilon)(1-n\tau^*)]b^2 \end{array} \right.$
 $\left\{ \begin{array}{c} Q=(2-\frac{1}{\chi})\xi(1+\xi)+\zeta[(1-\zeta)+(1-\epsilon)(1-\tau+n\tau)]b^2\\ Q^*=(2-\frac{1}{\chi})\xi^{*}(1+\xi^*)+\zeta^*[(1-\zeta^*)+(1-\epsilon)(1-n\tau^*)]b^2 \end{array} \right.$
.
A.5.2 The simulation results
The numerical simulation in Figure 9 indicates that the different values of
 $\chi$
and
 $\epsilon$
significantly affect the Nash equilibrium. The higher the intertemporal elasticity of substitution (
 $\chi$
), the lower is the optimal policy response coefficients,
 $\alpha_H^N$
,
 $\alpha_F^N$
,
 $\alpha_H^{*,N}$
, and
 $\alpha_F^{*,N}$
. Moreover, the higher the intratemporal elasticity of substitution between domestic and import goods (
 $\epsilon$
), the more responsive is the optimal monetary policy to domestic shocks. Thus, the reaction coefficient of Home’s monetary policy increases with its shocks, whereas it decreases with Foreign’s shocks.
The Nash equilibrium with different values of intertemporal elasticity of substitution in consumption (
 $\chi$
) and intratemporal elasticity of substitution between domestic and import goods (
 $\epsilon$
). The parameter values are given as:
 $n=0.5$
,
 $\gamma=0.25$
,
 $\phi=1.5$
,
 $\rho=0$
, and
 $\tau^*=0.5$
.

Figure 10 shows that the reaction coefficients of monetary policy significantly decrease with shocks under the Nash and cooperation equilibria, with increasing
 $\chi$
.
Comparison between the Nash and cooperation equilibria with different values of
 $\chi$
. The parameter values are given as:
 $n=0.5$
,
 $\gamma=0.25$
,
 $\phi=1.5$
,
 $\rho=0$
, and
 $\tau^*=0.5$
.

Figure 11 shows that the difference between the Nash and cooperation equilibria increases with
 $\epsilon$
. When the parameter values are set at the benchmark, the reaction coefficients of the two equilibria do not significantly differ. However, when
 $\epsilon=2$
, the reaction coefficient of the Nash equilibrium significantly differs from that of the cooperation equilibrium.
Comparison between the Nash and cooperation equilibria with different values of
 $\epsilon$
. The parameter values are given as:
 $n=0.5$
,
 $\gamma=0.25$
,
 $\phi=1.5$
,
 $\rho=0$
, and
 $\tau^*=0.5$
.

Compared with the benchmark model, the same degree of exchange rate pass-through allows significantly high cooperation motives for both countries when
 $\chi$
and
 $\epsilon$
increase, as Figure 12 shows.
Cooperation Areas with different values of
 $\chi$
and
 $\epsilon$
. The shaded area by the dotted dashed line denotes the (smallest) Cooperation Area when
 $\chi=\epsilon=1$
. The shaded area by the dashed line indicates the (larger) Cooperation Area when
 $\chi=2$
and
 $\epsilon=1$
. The shaded area by the solid line indicates the (largest) Cooperation Area when
 $\chi=1$
and
 $\epsilon=2$
.

Summary of consumption and price indices