


1. Introduction
As the world grapples with the urgency of addressing climate-related risks, investors are increasingly recognizing the importance of incorporating climate considerations into their investment decisions. The integration of environmental, social, and governance (ESG) factors into portfolio construction has emerged as a means to align investment practices with sustainability goals while pursuing traditional financial objectives.
Traditional portfolio construction, grounded in risk–return trade-offs, does not account for the impacts of investment decisions on corporate governance, society, or the environment. Growing evidence of the link between ESG performance and financial outcomes has led to a shift toward sustainable investing, which seeks to generate positive social and environmental effects alongside financial returns. Sustainable investing has grown substantially over the past decade. According to the Global Sustainable Investment Alliance (Global Sustainable Investment Alliance, 2023), sustainable investment assets exceeded $30 trillion globally in 2022, capturing increasing adoption among institutional investors. This shows that firms with strong ESG performance may be better positioned to manage risks and capture opportunities in a changing economy.
Building on the seminal work of Markowitz (Reference Markowitz1952) on modern portfolio theory (MPT), recent research extends this framework to incorporate climate-related risks and opportunities. We contribute to this literature by examining several portfolio construction methods that integrate ESG considerations. In addition, we introduce an ensemble methodology, drawing from machine learning, that blends allocation strategies to enhance out-of-sample performance of the portfolio strategies.
Climate portfolio construction involves designing investment portfolios that captures sustainable principles and addresses the challenges and opportunities posed by climate change. For example, institutional investors are drawn to investing in sustainable assets like renewable energy to improve returns while safeguarding their portfolios for the future. Moreover, the potential effects of carbon pricing on fossil fuel stocks can influence portfolio construction strategies, encouraging the development of “climate-smart” portfolios. See for example Dadzie-Dennis et al. (Reference Dadzie-Dennis, Feng and Hardy2026) and Pástor et al. (Reference Pástor, Stambaugh and Taylor2021). Such portfolios aim to mitigate risk by reallocating investments toward green and energy-efficient markets. These developments have motivated investors and researchers to design “climate-smart” portfolios that balance risk-adjusted returns with climate alignment.
Climate-related risks are particularly relevant for pension funds, insurers, and other long-horizon institutional investors whose liabilities extend over several decades. For such investors, portfolio construction decisions must account not only for traditional risk–return trade-offs but also for exposure to transition and physical climate risks (Dadzie-Dennis et al., Reference Dadzie-Dennis, Feng and Hardy2026).
Researchers have highlighted the potential benefits of incorporating ESG factors into portfolio construction. De Spiegeleer et al. (Reference De Spiegeleer, Höcht, Jakubowski, Reyners and Schoutens2023) argue that ESG integration can lead to improved risk-adjusted returns and better long-term outcomes for investors. In an earlier study, Fang et al. (Reference Fang, Tan and Wirjanto2019) suggest that sustainable portfolio management can help investors navigate the challenges of climate change while capturing emerging opportunities in sustainable industries. However, the literature also points to challenges in implementing ESG-integrated portfolios, including data availability and quality, as well as the lack of standardized ESG metrics. In the empirical results section, we revisit these challenges; particularly how they manifest in concentrated portfolios, sensitivity to ESG targets, and regional differences. Furthermore, Torricelli et al. (Reference Torricelli and Bertelli2022) emphasize the importance of considering ESG constraints in portfolio optimization to ensure that portfolios are truly aligned with sustainable principles.
We contribute to the literature in three ways. First, we introduce an ensemble portfolio construction framework that combine allocations generated by multiple ESG-aware optimization methods. By averaging across methodologies with different strengths and weaknesses, we aim to reduce estimation error and improve out-of-sample stability. Second, we provide a comparison of five optimization techniques under identical data and constraints. Finally, we offer cross-regional evidence contrasting North American and European markets, where policy environments differ materially.
We ask the overall question: For a passive investor making a one-time portfolio allocation decision, which ESG integration methods deliver the best balance of financial performance and sustainability?
By studying this static allocation problem, we can isolate the comparative performance of different optimization approaches without the confounding effects of rebalancing or dynamic reconstitution.
Specifically, we ask three key questions. (i) Does ESG integration improve portfolio performance relative to traditional portfolio construction approaches? (ii) How sensitive are results to the choice of optimization methodology? (iii) Do conclusions differ across regions?
The remainder of the paper is organized as follows. In Section 2, we review the literature that motivates our analysis. In Section 3, we present the portfolio construction methodologies. We present the data used and assumptions in Section 4. In Section 5, we evaluate their empirical performance. Finally, in Section 6, we summarize our findings and discuss their implications.
2. Selected literature review
This review focuses on three themes that are relevant to our study: (i) the integration of ESG factors into asset allocation decisions, (ii) climate transition risk and investor responses to the net-zero transition, and (iii) portfolio optimization approaches that jointly consider financial and sustainability objectives.
2.1 Integrating ESG factors into asset allocation
Traditional portfolio optimization frameworks focus primarily on risk and return characteristics, whereas ESG-integrated approaches seek to account for ESG factors that may influence long-term financial performance and portfolio robustness. Investors incorporate ESG considerations through screening mechanisms, portfolio constraints, or modified optimization objectives that reflect sustainability preferences.
A growing body of literature suggests that ESG integration can enhance portfolio performance while supporting broader sustainability goals.
For example, Fang et al. (Reference Fang, Tan and Wirjanto2019) develop a scenario-based framework for sustainable portfolio management under climate change and demonstrate the importance of incorporating climate-related risks into investment decisions. Similarly, De Spiegeleer et al. (Reference De Spiegeleer, Höcht, Jakubowski, Reyners and Schoutens2023) view ESG performance as an additional dimension of portfolio allocation and show that ESG integration can improve risk-adjusted outcomes while promoting sustainable development. Torricelli et al. (Reference Torricelli and Bertelli2022) examine the trade-off between financial performance and ESG compliance, highlighting how ESG constraints can be incorporated into optimization frameworks without necessarily sacrificing investment objectives. Likewise, Varmaz et al. (Reference Varmaz, Fieberg and Poddig2024) develop portfolio optimization techniques tailored to sustainable investments and demonstrate how ESG considerations can be embedded directly into the portfolio construction process.
Taken together, these studies suggest that ESG integration can strengthen portfolio performance, improve the management of climate-related risks, and align investment decisions with sustainability objectives. At the same time, they highlight the importance of portfolio construction methodology, as different optimization frameworks may produce substantially different outcomes even when similar ESG goals are imposed.
2.2 Climate transition risk and investor response
Transition policies, carbon-pricing mechanisms, technological innovation, and changing consumer preferences have the potential to reshape the competitive landscape across industries. As a result, investors are considering climate transition risk when making asset allocation decisions.
Investors have become aware that regulatory changes and shifts in market preferences may adversely affect firms with high carbon exposures (Krueger et al., Reference Krueger, Sautner and Starks2020). At the same time, emerging opportunities in renewable energy, clean technology, and low-carbon industries have encouraged investors to reallocate capital toward businesses that may benefit from the transition (Dadzie-Dennis et al., Reference Dadzie-Dennis, Feng and Hardy2026).
Research by Deng et al. (Reference Deng, Leippold, Wagner and Wang2023) examines investor expectations regarding the net-zero transition and its implications for portfolio management. Their findings suggest that policy uncertainty, geopolitical developments, and broader economic conditions influence investor perceptions of climate-related risks and opportunities. More generally, investors have responded to transition risk through a combination of engagement strategies, portfolio tilts, divestment initiatives, and ESG integration approaches (Kim & Yoon, Reference Kim and Yoon2023).
2.3 Portfolio optimization approaches for ESG investing
As ESG investing mature, researchers have explored portfolio optimization techniques capable of balancing financial and sustainability objectives. Traditional mean-variance optimization focuses on maximizing expected returns for a given level of risk. ESG-oriented portfolio construction extends this framework by incorporating additional objectives or constraints related to sustainability performance.
For example, Cao and Wirjanto (Reference Cao and Wirjanto2023) and Xidonas and Essner (Reference Xidonas and Essner2024) develop multiobjective optimization frameworks that balance traditional portfolio objectives with environmental and social considerations. Their results demonstrate that investors can achieve competitive risk-adjusted performance while satisfying ESG targets.
Beyond multiobjective optimization, recent research has expanded the range of portfolio construction methodologies used in sustainable investing. Alternative approaches based on diversification, downside-risk management, and risk budgeting have been proposed to improve portfolio robustness while maintaining ESG alignment.
The literature provides evidence that ESG integration can influence portfolio performance and risk characteristics. However, important questions remain regarding the relative effectiveness of alternative optimization approaches and the extent to which conclusions remain consistent across different markets and regulatory environments.
Although prior research has examined ESG integration, climate transition risk, and multiobjective optimization, few studies to our knowledge has systematically compared multiple portfolio construction techniques, including an ensemble framework, across both North American and European markets using a consistent empirical design. Furthermore, most existing studies often focus on a single optimization methodology, making it difficult to assess whether reported benefits arise from ESG integration itself or from the underlying portfolio construction technique. This study addresses these gaps by comparing multiple ESG-integrated portfolio methodologies under a common empirical framework and evaluating their performance across distinct regional markets.
In the next section, we present the methodology used to construct and evaluate the portfolio strategies considered in this study.
3. Methodology
In this section, we consider five climate portfolio construction strategies motivated by the sustainable investment literature.
We use ESG scores as a proxy for climate-related risk exposure and incorporate sustainability considerations directly into the optimization problem. In Subsections 3.1 and 3.2, we present the corresponding formulations.
We consider
 $N$
risky assets with returns represented by the random vector
 $\mathbf{R}=(R_1,R_2,\ldots ,R_N)^{\top} \! ,$
where asset
 $i$
has expected return
 $\mu _i=\mathbb{E}[R_i]$
and standard deviation
 $\sigma _i$
.
Let
 $\boldsymbol{\mu }$
denote the vector of expected returns and let
 $\boldsymbol{\Sigma }$
denote the covariance matrix of returns. We seek portfolio weights
 $\mathbf{w}=(w_1,w_2,\ldots ,w_N)^{\top}\!,$
subject to
 $\mathbf{w}^{\top }\mathbf{1}=1, \quad w_i\ge 0, \quad i=1,\ldots ,N$
, such that short-selling is prohibited
3.1 Portfolio #1: Maximize return subject to a set constraints
Varmaz et al. (Reference Varmaz, Fieberg and Poddig2024) address the difficulty investors face in specifying abstract preference parameters for ESG by replacing them with investor-specified target levels. Inspired by this approach, we replace the ESG preference parameter with an investor specified target ESG-score and formulate the objective as follows:
 \begin{align} \begin{split} \max _{\text{w} \geq 0} & \hspace {3mm} \mathbf{w}^\top \boldsymbol{\mu } \\[2pt] \textit {s.t} & \hspace {3mm} \mathbf{w}^\top \boldsymbol{1} = 1 \\[2pt] & \hspace {3mm} \mathbf{w}^\top \boldsymbol{\theta } \leq {\theta }_p \\[2pt] & \hspace {3mm} \mathbf{w}^\top \boldsymbol{\alpha } \geq 0.5 \end{split} \end{align}
where
 $\boldsymbol{\mu }$
is the expected return vector,
 $\boldsymbol{\theta }$
is the vector of ESG scores,
 $\theta _p$
is the target ESG level, and
 \begin{equation*} \alpha _i= \begin{cases} 1, & \theta _i \leq \bar {\theta },\\[2pt] 0, & \theta _i \gt \bar {\theta }, \end{cases} \end{equation*}
where
 $\bar {\theta }$
denotes the average ESG score across the investment universe, and
 $\theta _i$
is the ESG score of asset
 $i$
. Consequently,
 $\mathbf{w}^{\top }\boldsymbol{\alpha }$
represents the proportion of portfolio weight allocated to stocks whose ESG scores are below the universe average.
The average ESG score
 $\bar {\theta }$
is calculated from the fixed investment universe at the portfolio formation date and remains constant throughout the analysis. In this static, passive investor framework, the classification of a stock as having below-average ESG risk does not change over time.
In a dynamic setting where the investment universe evolves, an absolute ESG threshold (e.g., Sustainalytics’ “low risk” category) would be more appropriate to avoid unstable classifications, but such an extension is left for future research.
From Eq. (1), we maximize our return subject to four constraints: (i) portfolio weights sum to one, (ii) the portfolio ESG score does not exceed the target value
 $\theta _p$
, (iii) at least 50% of portfolio weight is allocated to stocks with ESG scores below the universe average, and (iv) short-selling is prohibited.
The motivation for the third constraint traces back to the minimum requirements for being a signatory of the United Nations-supported Principles for Responsible Investment (UNPRI), which encourages signatories to allocate a substantial portion of investments to assets meeting baseline sustainability criteria. Specifically, signatories must have a responsible investment, covering more than 50% of assets under management (Kim & Yoon, Reference Kim and Yoon2023).
3.2 Portfolio #2: Minimize variance subject to a set of constraints
This portfolio is inspired by the Green-variance portfolio introduced by De Spiegeleer et al. (Reference De Spiegeleer, Höcht, Jakubowski, Reyners and Schoutens2023). The constraints are the same as those introduced in Section 3.1. We formulate the portfolio:
 \begin{align} \begin{split} \min _{\text{w} \geq 0} & \hspace {3mm} \mathbf{w}^\top \boldsymbol{\Sigma }\mathbf{w} \\[2pt] \textit {s.t} & \hspace {3mm} \mathbf{w}^\top \boldsymbol{1} = 1\\[2pt] & \hspace {3mm} \mathbf{w}^\top \boldsymbol{\theta } \leq {\theta }_p\\[2pt] & \hspace {3mm} \mathbf{w}^\top \boldsymbol{\alpha } \geq 0.5 \end{split} \end{align}
where
 $\boldsymbol{\Sigma }$
is the covariance matrix,
 $\boldsymbol{\theta }$
is the ESG scores vector,
 $\theta _p$
is the target ESG, and
 $\alpha _i = \unicode {x1D7D9}_{\theta _i \lt \bar {\theta }}$
.
Note that these portfolios do not necessarily yield a competitive return, as their main objective is to minimize variance.
Small changes in estimated parameters under the portfolio strategies considered before can produce substantially different portfolio allocations and lead to poor out-of-sample performance. To mitigate this issue, we consider a Bayesian framework that incorporates ESG information into the return estimation process. We use standardized ESG scores to form investor views within a Black–Litterman framework.
3.3 Portfolio #3: Black–Litterman model
Developed by Black & Litterman (Reference Black and Litterman1992), it combines capital asset pricing theory (CAPM) with Bayesian statistics and Markowitz’s MPT (mean-variance optimization) to produce efficient estimates of the portfolio weights. The Black–Litterman model combines a subjective view of investors with a market equilibrium to generate optimal portfolio weights. We first compute the posterior expected returns and covariance matrix, and then use them to derive the optimal portfolio weights.
3.3.1 Expected returns
The expected returns vector,
 $\boldsymbol{\mu }$
, is given by:
 \begin{equation} \boldsymbol{\mu }_{BL} = \boldsymbol{\pi } + \tau \boldsymbol{\Sigma }^\top \boldsymbol{\omega } \end{equation}
where
 $\boldsymbol{\pi }$
is the market equilibrium excess return vector,
 $\tau$
is the scaling factor,
 $\boldsymbol{\Sigma }$
is the covariance matrix of asset returns, and
 $\boldsymbol{\omega }$
is the matrix of errors associated with investor’s subjective views.
In our implementation, these views are derived from standardized ESG scores. Assets with stronger ESG characteristics receive relatively more favorable expected return adjustments, whereas assets with weaker ESG characteristics receive less favorable adjustments. This approach allows sustainability information to influence portfolio construction without replacing the market equilibrium prior.
3.3.2 Covariance matrix
The covariance matrix,
 $\boldsymbol{\Sigma }_{BL}$
, of the portfolio returns is calculated as:
 \begin{equation} \boldsymbol{\Sigma }_{BL} = \tau \boldsymbol{\Sigma } + \boldsymbol{\Sigma }_{\text{Views}} \end{equation}
where
 $\boldsymbol{\Sigma }$
is the covariance matrix of asset returns, and
 $\boldsymbol{\Sigma }_{\text{Views}}$
is the covariance matrix of the errors corresponding to the subjective view.
3.3.3 Optimization
The optimal portfolio weights,
 $\mathbf{w}^*$
, are obtained by solving the following optimization problem:
 \begin{equation} \mathbf{w}^* = \arg \max _{\mathbf{w}} \big\{ \mathbf{w}^\top \boldsymbol{\mu }_{BL} - \mathbf{w}^\top \boldsymbol{\Sigma }_{BL} \mathbf{w} \big\} \end{equation}
3.4 Portfolio #4: Multi-objective portfolio construction
Xidonas and Essner (Reference Xidonas and Essner2024) propose a tri-objective model that expands the mean-risk analysis by incorporating sustainability as an objective in the optimization program. It is constructed to identify portfolios that maximize expected return and ESG assessment while minimizing risk.
Rather than solving the tri-objective problem directly, we implement a two-stage procedure. In the first stage, we identify a sustainability-oriented subset of assets. In the second stage, we determine portfolio weights using a minimax allocation rule. This decomposition simplifies the optimization problem while preserving both sustainability and financial objectives.
3.4.1 Objective 1
In the first stage, we select a subset of assets by solving the following optimization problem:
 \begin{align} \begin{split} \min _{\textbf {w}} & \hspace {3mm} \mathbf{w}^\top \boldsymbol{\theta } \\[2pt] \textit {s.t} & \hspace {3mm} \mathbf{w}^\top \boldsymbol{1} = 1\\[2pt] & \hspace {3mm} \mathbf{w}^\top \boldsymbol{\alpha } \geq 0.5 \\[2pt] \end{split} \end{align}
Eq. (6) defines the objective function with the goal of minimizing the portfolio ESG score, while ensuring that at least 50% of the weight is allocated to stocks with ESG scores lower than the average ESG value, and the total sum of weights equals 1. There is no constraint imposed on the weights, as the optimization process is designed to select the subset of stocks in which the investor will invest. After identifying the eligible asset subset, we determine portfolio weights using a minimax objective function following Young (Reference Young1998).
3.4.2 Objective 2
The ideal portfolio is the one that aims to minimize the largest potential loss experienced over all historical time frames, while also ensuring that the average return across all observed periods meets a predetermined minimum threshold. This principle focuses on guaranteeing a satisfactory minimum return rather than solely minimizing variance as a measure of risk.
Let
 $M_p = \min \mathbf{w}^\top \boldsymbol{\mu }$
denote the minimum gain of the portfolio, such that:
 \begin{align} \begin{split} \max _{\text{w} \geq 0, M_p \in R} & \hspace {3mm} M_p \\[2pt] \textit {s.t} & \hspace {3mm} \mathbf{w}^\top \boldsymbol{1} = 1\\[2pt] \end{split} \end{align}
For comparison, we also consider an unconstrained version that applies the same minimax objective directly to the full investment universe, omitting the ESG minimization step. This allows us to isolate the impact of sustainability-focused asset selection.
Figure 1 summarizes the steps of the multiobjective portfolio construction procedure.
A flowchart of the multiobjective portfolio strategy.

3.5 Portfolio #5: Ensemble portfolio
MPT assumes that expected returns,
 $\boldsymbol{\mu }$
and the covariance matrix,
 $\boldsymbol{\Sigma }$
are known. In practice, both quantities must be estimated, and estimation error can substantially affect portfolio allocations. As documented by Jorion (Reference Jorion1985) and subsequent studies, portfolio optimizers are often highly sensitive to small perturbations in estimated returns and covariances, resulting in unstable weights and poor out-of-sample performance.
Researchers have proposed numerous approaches to mitigate this problem, including shrinkage estimators, Bayesian adjustments, regularization techniques, and structured portfolio constraints (Frahm & Memmel, Reference Frahm and Memmel2010; Huang et al., Reference Huang, Wei, Weng and Wirjanto2023; Kan & Zhou, Reference Kan and Zhou2007; Pollak, Reference Pollak2011; Tu & Zhou, Reference Tu and Zhou2011). Portfolio #3 represents the Bayesian-adjustment approach within our analysis.
However, even after securing improved estimates of the expected returns vector and the covariance matrix of the returns for the portfolio, there remains a risk of overfitting on the historical data based on a single allocation strategy.
This section proposes an alternative strategy. Rather than improving estimates, we combine multiple allocation strategies that operate on the same noisy data but transform it differently. Because Portfolios #1–#4 transform the same information through fundamentally different optimization frameworks (return maximization, variance minimization, Bayesian adjustment, minimax optimization), their allocation errors need not coincide. Averaging across strategies may therefore reduce model-specific errors while preserving common information contained in the underlying data.
This ensemble approach is inspired by machine learning (Breiman, Reference Breiman2001; Hastie et al. Reference Hastie, Tibshirani and Friedman2009) and has been successfully applied in other financial contexts.
We define the ensemble portfolio weights as the simple average of all constituent strategies. Our ensemble portfolio is defined in Equation 8:
 \begin{equation} \mathbf{w}_{r} = \frac {1}{S} \sum _{\forall s} \mathbf{w}_{s,r} \end{equation}
where
 $\mathbf{w}_{s,r}$
are the optimal weights from strategy
 $s$
in region
 $r$
, and
 $S$
is the number of strategies (
 $S=4$
in our application, averaging Portfolios #1–#3 and Portfolio #4 constrained version).
We employ naive stacking (simple averaging) because the approach avoids introducing additional model complexity and hyperparameter tuning. Each constituent strategy is equally informed, providing no basis for differential weighting. Simple averaging is known to be surprisingly robust (Claeskens & Hjort, Reference Claeskens and Hjort2008) and for investors, it is transparent and easy to implement.
For Portfolios #1–#3, we average across all feasible ESG target values
 $(\theta _p)$
identified during the empirical analysis. This captures the full range of sustainability–return trade-offs. For Portfolio #4, we use only the constrained version.
By averaging across targets, the ensemble portfolio naturally balances multiple sustainability scenarios and reduces the risk of over-committing to a single ESG specification.
The ensemble portfolio is most effective when constituent strategies make different allocation mistakes. In our setting, each portfolio relies on a distinct optimization principle and therefore responds differently to estimation error. If these errors are imperfectly correlated, averaging can improve stability and out-of-sample performance. Conversely, if all strategies converge to similar allocations, the benefits of ensemble averaging will naturally diminish.
4. Data and assumptions
4.1 Data
We use the S&P 500 Top 50 and EU STOXX 50 constituents as of June 2020. The investor forms the portfolio in June 2020 using information available up to that date and holds the portfolio from July 2020 through December 2025.
For each index, we collect weekly price data from Yahoo Finance spanning January 2015 to December 2025, along with ESG scores from Sustainalytics.
We retain only those companies with complete historical return data over the full sample period. For the European market, this results in 46 stocks after excluding assets with insufficient data (Prosus N.V., Linde plc, Amadeus IT Group, and Adyen N.V.).
We obtain the ESG scores from Sustainalytics, where a lower score indicates better ESG performance (that is, lower ESG risk). Sustainalytics defines scores as follows: 0–10 (negligible risk), 10–20 (low risk), 20–30 (medium risk), 30–40 (high risk), and above 40 (severe risk). Thus, when we impose constraints such as
 $\mathbf{w}^\top \boldsymbol{\theta } \leq \theta _p$
or allocate at least 50% to stocks with ESG scores below the average
 $(\boldsymbol{\theta } \leq \bar {\theta })$
, we are tilting the portfolio toward firms with lower ESG risk.
For the analysis, we test target ESG scores ranging from 0 to 20, which covers the Sustainalytics “Negligible” and “Low” risk categories.
To avoid redundant reporting, we present only distinct portfolio solutions. When multiple ESG targets generate identical allocations, we report a single representative case. We also identify the ESG targets for which the optimization problem becomes infeasible or the ESG constraint ceases to be binding.
4.2 Data partitioning
The full dataset spans from January 2015 to December 2025, consisting of weekly returns for the selected assets. We partition the data into two periods:
-
• In-sample period: The first half of the data is used to estimate model parameters – the expected return vector
 $\boldsymbol{\mu }$
and covariance matrix
$\boldsymbol{\Sigma }$
– and to compute optimal portfolio weights.
-
• Out-of-sample period: The remaining half of the data is used to evaluate the performance of each portfolio strategy.


This study deliberately adopts a static, passive investor framework as a research design choice. We posit an investor who makes a single portfolio allocation decision at the portfolio formation date (June 2020) and holds that allocation without rebalancing through the out-of-sample evaluation period (July 2020–December 2025).
By eliminating rebalancing decisions, we isolate the comparative performance of different portfolio construction methodologies without confounding factors. Any performance difference reflects the quality of the initial allocation, not active management skill.
The passive-investor framework establishes a baseline against which future studies can evaluate dynamic rebalancing strategies and evolving ESG information.
We assume the investor has access to weekly price and yearly ESG data during the in-sample period (January 2015 – June 2020) but no forward-looking information. Using this historical data, the investor selects optimal weights for all five strategies outlined in Section 3. The investor then enters the market at the start of the out-of-sample period with an initial portfolio value of $1,000 and holds this allocation unchanged. To gauge portfolio strategy performance, we track how the portfolio value evolves during the out-of-sample period.
4.3 Assumptions
We estimate both
 $\boldsymbol{\mu }$
and
 $\boldsymbol{\Sigma }$
using historical price data and maintain this assumption throughout the empirical analysis. To address parameter uncertainty in portfolio optimization, we adopt a Bayesian approach by treating
 $\boldsymbol{\mu }$
and
 $\boldsymbol{\Sigma }$
as random variables with prior distributions updated by observed data.
We use the traditional
 $\frac {1}{N}$
portfolio as the benchmark allocation framework. This is due to research which suggests that the equally weighted portfolio is a challenging benchmark to outperform, often delivering superior out-of-sample performance relative to more complex optimization strategies (DeMiguel et al., Reference DeMiguel, Garlappi and Uppal2009). See also Guo et al. (Reference Guo, Boyle, Weng and Wirjanto2018), Guo et al. (Reference Guo, Boyle, Weng and Wirjanto2019), Guo et al. (Reference Guo, Weng and Wirjanto2018), Qin & Singal (Reference Qin and Singal2022), and Swade et al. (Reference Swade, Nolte, Shackleton and Lohre2023).
For robustness, we also compare each portfolio against their unconstrained counterparts, that is, without ESG constraints. These directly isolate the marginal contribution of ESG integration.
Since the ESG constraint can render the optimization problem infeasible, we determine the set of ESG targets for which the feasible set within the investment universie in non-empty.
5. Numerical results
In this study, we answer three main questions. First, is there any benefit in incorporating ESG into portfolio strategies? To answer this, we compare our results to an equally weighted benchmark and the unconstrained counterpart of each portfolio. Second, how does performance differ across different portfolio optimization techniques? To answer this, we compare the performance of the portfolios discussed across the same ESG targets and performance measures. Third, do investments perform differently across countries and regions? To address this, we examine markets in North America and the European Union (EU).
5.1 Descriptive analysis
Before analyzing portfolio performance, we examine how ESG risk varies across markets and whether ESG classifications are associated with differences in returns, volatility, and firm characteristics.
5.1.1 European market
Table 1 reports summary statistics for EU STOXX 50 firms grouped by Sustainalytics ESG risk category.
Summary statistics of EU STOXX 50 firms by ESG risk category as at the portfolio formation date

Table 1. Long description
A table summarizing statistics of EU STOXX 50 firms grouped by ESG risk category. The table has five columns: ESG category, Count, Ann. return (percent), Ann. volatility (percent), Avg. market cap ($B), Avg. BtM, and Avg. P/E. It has three rows of data. Row 1: 0-10 (Negligible), 6, 9.06, 29.2, 86.4, 0.868, 20.2. Row 2: 10-20 (Low), 27, 8.90, 26.0, 81.2, 0.657, 25.9. Row 3: 20-30 (Medium), 13, 2.68, 29.4, 78.2, 0.681, 13.2.
The European Union (EU) market exhibits a relatively compressed ESG risk distribution, with no firms classified in the High or Severe ESG risk categories. This pattern is consistent with the region’s stringent sustainability regulations and disclosure requirements.
Return differences across ESG categories are modest. Firms classified as Negligible and Low ESG risk generate similar average returns, whereas firms in the Medium-risk category exhibit noticeably weaker performance. These results suggest that firms with moderate ESG risk experienced less favorable return outcomes during the sample period.
We observe no clear relationship between ESG risk classifications and traditional firm characteristics such as market capitalization, book-to-market ratios, or valuation measures within the European sample.
5.1.2 North American market
Table 2 reports summary statistics for S&P 500 Top 50 firms grouped by Sustainalytics ESG risk category.
Summary statistics of S&P 500 Top 50 firms by ESG risk category as at the portfolio formation date

Table 2. Long description
The table presents summary statistics for S&P 500 Top 50 firms grouped by Sustainalytics ESG risk category. It has six rows and seven columns. The columns are labeled as ESG category, Count, Ann. return (percent), Ann. volatility (percent), Avg. market cap ($B), Avg. BtM, and Avg. P/E. The rows are labeled with ESG risk categories: 0-10 (Negligible), 10-20 (Low), 20-30 (Medium), 30-40 (High), and >40 (Severe). Each row provides the count of firms, annual return, annual volatility, average market cap, average book-to-market ratio, and average price-to-earnings ratio for the respective ESG risk category.
Unlike the European sample, the North American market exhibits a broader ESG risk distribution that spans all Sustainalytics risk categories. Firms with lower ESG risk generate stronger average returns, whereas firms in the High and Severe ESG risk categories experience substantially weaker performance.
The highest-risk firms are concentrated in the Energy sector, suggesting that industry composition contributes to the observed relationship between ESG risk and firm performance.
Firm characteristics also vary systematically across ESG risk categories. Lower-risk firms are predominantly large-cap growth-oriented companies, particularly within the Technology and Healthcare sectors, whereas higher-risk firms are concentrated among Energy companies. Consequently, firms with lower ESG risk tend to exhibit valuation characteristics associated with growth stocks, whereas firms with higher ESG risk display characteristics more commonly associated with value stocks.
The weak performance of the High and Severe ESG risk categories coincides with the challenging environment faced by Energy firms during the 2015–2020 period, including the aftermath of the oil price collapse, heightened transition-risk concerns, and the demand shock associated with the COVID-19 pandemic. As a result, firms in these categories experienced weaker profitability and lower valuations than firms in many other sectors.
Overall, the results suggest that the negative association between ESG risk and firm performance in the North American sample is at least partly related to sectoral differences, particularly the contrast between growth-oriented Technology and Healthcare firms and traditional Energy companies.
The EU sample displays a compressed ESG risk distribution and relatively small performance differences across ESG categories, whereas the North American sample exhibits a broader range of ESG risks and a more pronounced decline in returns as ESG risk increases. For sector composition, the highest-risk firms in the North American market are concentrated in the Energy sector, whereas ESG risk categories in Europe are more evenly distributed across Financials, Consumer Discretionary, and Industrials. In addition, firm characteristics vary more systematically with ESG risk in the North American market, where lower-risk firms tend to be large-cap growth companies and higher-risk firms exhibit more value-oriented characteristics. These patterns are considerably weaker in the European sample.
These regional differences in ESG distributions, sector composition, and firm characteristics suggest that ESG constraints may influence portfolio construction differently across the two markets. We therefore examine the optimization results separately for the European and North American samples in the following sections.
5.2 Portfolio #1: Maximize return subject to a set constraints
5.2.1 European market
We first examine Portfolio #1 in the European market across target ESG scores ranging from 0 to 20, corresponding to the Negligible and Low Sustainalytics risk categories.
For
 $\theta _p \leq 6.4$
, no feasible solution exists because the available assets cannot collectively satisfy the sustainability target.
Figure 2 shows the optimal portfolio weights for selected ESG targets. The vertical dashed lines indicate values of
 $\theta _p$
at which the portfolio composition changes.
Feasible solutions first appear at
 $\theta _p = 6.4$
. For
 $\theta _p \leq 8.9$
, the portfolio consists of Vonovia SE (VNA.DE) and ASML Holding N.V. (ASML.AS), with the weight gradually shifting from VNA.DE toward ASML.AS as the ESG constraint relaxes. At
 $\theta _p = 9.0$
, Adidas (ADS.DE) enters the portfolio and progressively replaces ASML.AS. Once
 $\theta _p \geq 12.0$
, the ESG constraint becomes non-binding and the portfolio converges to the unconstrained maximum-return solution, allocating 100% to ADS.DE.
The ESG target constraint
 $\mathbf{w}^\top \boldsymbol{\theta } \leq \theta _p$
drives the allocation. For
 $\theta _p \leq 6.3$
, no feasible solution exists because no combination of assets can satisfy the target. For
 $6.4 \leq \theta _p \leq 8.9$
, VNA.DE is required to satisfy the ESG requirement, and ASML.AS contributes return enhancement. For
 $9.0 \leq \theta _p \leq 11.9$
, ADS.DE gradually replaces ASML.AS as the constraint becomes less restrictive. When
 $\theta _p \geq 12.0$
, the ESG constraint becomes non-binding and the portfolio converges to the unconstrained optimum. The UNPRI constraint (
 $\mathbf{w}^\top \boldsymbol{\alpha } \geq 0.5$
) remains satisfied throughout because both VNA.DE and ADS.DE have ESG scores below the sample average.
Using the optimal weights shown in Figure 2, we evaluate the wealth process for an investor who allocates $1,000 at the beginning of the out-of-sample period. We select
 $\theta _p \in \{6.4,8.9,9.0,11.9,12\}$
to represent the key allocations identified in the weight analysis. Figure 3 displays the resulting wealth processes.
Terminal wealth exhibits a non-monotonic relationship with the ESG target. The strictest feasible target (
 $\theta _p = 6.4$
) produces the lowest terminal wealth because the portfolio is heavily concentrated in VNA.DE. Performance improves substantially at intermediate targets (
 $\theta _p = 8.9$
and
 $9.0$
), where the portfolio benefits from diversification across the available assets.
As the ESG constraint relaxes further, performance deteriorates and converges toward that of the unconstrained portfolio, reflecting increasing exposure to ADS.DE. The equally weighted benchmark outperforms the relaxed ESG-constrained portfolios but underperforms the best-performing intermediate ESG portfolios in terms of return.
Performance and s ustainability m etrics
Table 3 reports the annualized return, annualized volatility, Sharpe ratio, and portfolio ESG score for each strategy.
Performance and sustainability metrics for Portfolio #1 under EU STOXX 50

Table 3. Long description
A table comparing performance and sustainability metrics for different portfolio strategies. The table has 7 rows and 5 columns. Column headers are Portfolio, Ann. return (%), Ann. volatility (%), Sharpe ratio, and Portfolio ESG. Row labels are 1/N (Benchmark), Unconstrained, θ_p = 12.0, θ_p = 11.9, θ_p = 9.0, θ_p = 8.9, and θ_p = 6.4. Row 1: 1/N (Benchmark), 11.33, 15.75, 0.681, 16.56. Row 2: Unconstrained, 4.59, 32.98, 0.140, 11.92. Row 3: θ_p = 12.0, 4.59, 32.98, 0.140, 11.92. Row 4: θ_p = 11.9, 4.44, 32.84, 0.140, 11.90. Row 5: θ_p = 9.0, 19.79, 34.85, 0.518, 9.00. Row 6: θ_p = 8.9, 20.11, 35.09, 0.520, 8.90. Row 7: θ_p = 6.4, 4.97, 29.92, 0.170, 6.40.
Optimal portfolio weights under Portfolio #1 by using the EU STOXX 50 index for a given target ESG,
 $\theta _p$
.

Table 3 confirms the non-monotonic relationship between ESG stringency and portfolio performance. The highest annualized returns and Sharpe ratios occur at
 $\theta _p = 8.9$
and
 $9.0$
, whereas both the strictest feasible portfolio (
 $\theta _p = 6.4$
) and the unconstrained portfolio perform poorly. Per the results, intermediate ESG targets provide sufficient flexibility to diversify across high-return assets while maintaining meaningful sustainability constraints.
Wealth process under portfolio #1 by assuming an initial investment of $1000 and using the EU STOXX 50 index for a given target ESG,
 $\theta _p$
. We include the equally weighted portfolio (black) and the unconstrained portfolio (gray) as benchmarks.

5.2.2 North American market
We next examine Portfolio #1 using the S&P 500 Top 50 constituents.
For
 $\theta _p \leq 9.0$
, no feasible solution exists.
Figure 4 shows the optimal portfolio weights for selected ESG targets. The vertical dashed lines indicate values of
 $\theta _p$
at which the portfolio composition changes.
Optimal portfolio weights under Portfolio #1 by using the S&P 500 top 50 index for a given target ESG,
 $\theta _p$
.

The optimal portfolio contains at most two stocks, NVIDIA Corporation (NVDA) and Danaher Corporation (DHR). For
 $9.0 \leq \theta _p \leq 12.4$
, the portfolio allocates to both assets, with the weight on NVDA increasing as the ESG constraint relaxes. Once
 $\theta _p = 12.5$
, the ESG constraint becomes non-binding and the portfolio converges to the unconstrained maximum-return solution, allocating entirely to NVDA.
The ESG target constraint
 $\mathbf{w}^\top \boldsymbol{\theta } \leq \theta _p$
drives the observed relationship between
 $\theta _p$
and the NVDA-DHR weight split. For targets below NVDA’s ESG score, the optimizer must allocate part of the portfolio to DHR to satisfy the ESG requirement. Once
 $\theta _p$
reaches NVDA’s ESG score, the ESG constraint becomes non-binding. Because NVDA also satisfies the UNPRI constraint, the unconstrained maximum-return portfolio becomes feasible and optimal.
Using the optimal weights shown in Figure 4, we evaluate the wealth process assuming an initial investment of $1,000. We consider
 $\theta _p \in \{9, 10.7, 12.4, 12.5\}$
, which correspond to the key allocations identified.
Wealth process under Portfolio #1 by assuming an initial investment of $1000 and using the S&P 500 Top 50 index for a given target ESG,
 $\theta _p$
. We include the equally weighted portfolio (black) and the unconstrained portfolio (gray) as benchmarks.

The unconstrained portfolio in Figure 5 achieves the highest terminal wealth because it allocates entirely to NVDA, the strongest-performing asset during the out-of-sample period. Portfolios with
 ${\theta _p \geq 12.5}$
produce identical outcomes because they also allocate fully to NVDA. The equally weighted benchmark outperforms the stricter ESG portfolios but underperforms the NVDA-dominated portfolios.
Performance and sustainability metrics
Table 4 reports the annualized return, annualized volatility, Sharpe ratio, and portfolio ESG score for each strategy.
Performance and sustainability metrics for Portfolio #1 under S&P 500 Top 50

Table 4. Long description
A table comparing performance and sustainability metrics for different portfolio strategies. The table has five rows and five columns. Column headers are Portfolio, Ann. return (%), Ann. volatility (%), Sharpe ratio, and Portfolio ESG. Row labels are 1/N (Benchmark), Unconstrained, θ_p = 12.5, θ_p = 10.7, and θ_p = 9.0. Row 1: 1/N (Benchmark), 14.22, 14.91, 0.890, 18.60. Row 2: Unconstrained, 72.61, 46.95, 1.160, 12.45. Row 3: θ_p = 12.5, 72.61, 46.95, 1.160, 12.45. Row 4: θ_p = 10.7, 71.46, 46.43, 1.161, 12.40. Row 5: θ_p = 9.0, 36.78, 31.41, 1.000, 10.70. Row 6: θ_p = 9.0, 9.12, 27.42, 0.320, 9.00.
The strictest feasible target
 $\theta _p = 9.0$
provides not only the strongest ESG alignment but also the weakest financial performance. The equally weighted benchmark offers lower returns but substantially lower volatility, capturing the diversification benefits of naive weighting.
The results from Portfolio #1 demonstrate that the effect of ESG constraints depends not only on the ESG characteristics of the available assets but also on how the constraints alter portfolio concentration.
In both regions, the return-maximization objective produces highly concentrated portfolios. However, the consequences of concentration differ across markets.
In the European sample, both the strictest ESG targets and the unconstrained solution concentrate capital in assets that subsequently underperform, resulting in poor out-of-sample performance. Intermediate ESG targets mitigate this concentration and generate superior outcomes. In contrast, the unconstrained portfolio in the North American sample concentrates entirely in NVDA, which proves to be the strongest-performing asset. Relaxing the ESG constraint therefore increases exposure to NVDA and improves performance, whereas stricter ESG targets reduce exposure and lower returns.
Per these results, ESG constraints do not have a uniform effect on portfolio performance. Their impact depends on whether the constraints increase or reduce exposure to the assets that ultimately drive returns.
5.3 Portfolio #2: Minimize variance subject to a set of constraints
5.3.1 European market
The second portfolio minimizes the variance of the portfolio subject to certain weighting and ESG consideration constraints.
We obtain the first feasible allocation at
 $\theta _p = 6.6$
.
At stringent ESG targets, the optimizer concentrates in a small set of low-ESG-risk firms, including VNA.DE, Schneider Electric S.E. (SU.PA), and Intesa Sanpaolo S.p.A. (ISP.MI). As
 $\theta _p$
increases, additional assets enter the portfolio and diversification improves. By
 $\theta _p = 15.1$
, the ESG constraint becomes non-binding and the portfolio converges to the unconstrained minimum-variance solution containing 11 assets.
The ESG target constraint
 $\mathbf{w}^\top \boldsymbol{\theta } \leq \theta _p$
drives the gradual inclusion of higher ESG assets as
 $\theta _p$
increases. For
 $\theta _p \leq 15.0$
, the constraint is binding, forcing the optimizer to exclude higher ESG assets and favor lower ESG ones such as VNA.DE and SU.PA. As
 $\theta _p$
rises, the constraint becomes less restrictive, allowing the gradual entry of assets with higher ESG scores. For
 $\theta _p \geq 15.1$
, the ESG target constraint becomes non-binding, and only the UNPRI constraint (
 $\mathbf{w}^\top \boldsymbol{\alpha } \geq 0.5$
) remains active, driving the convergence to the unconstrained minimum variance allocation.
Across all feasible targets, Portfolio #2 remains more diversified than Portfolio #1, typically holding between 3 and 11 assets. This outcome is consistent with the variance-minimization objective, which naturally rewards diversification.
Using the optimal weights, we consider the wealth process by assuming the investor invests
 $\$1000$
at the beginning of the out-of-sample period.
For clarity in visualization, we select key boundaries that capture the transitions in portfolio composition:
 $\theta _p = 6.6$
(minimum feasible),
 $7.4$
(Danone S.A. (BN.PA) enters),
 $7.5$
(BN.PA weight increases),
 $8.7$
(Koninklijke Ahold Delhaize N.V. (AD.AS) enters),
 $8.8$
(SU.PA exits),
 $10.6$
(L’Air Liquide S.A. (AI.PA) enters),
 $10.7$
(ISP.MI exits),
 $14.5$
(Flutter Entertainment plc (FLTR.L) enters),
 $14.6$
(Iberdrola, S.A. (IBE1.DE) enters), and
 $15.1$
(non-binding threshold).
Figure 6 displays the resulting wealth processes.
Wealth process under Portfolio #2 by assuming an initial investment of $1000 and using the EU STOXX 50 index for a given target ESG,
 $\theta _p$
. We include the equally weighted portfolio (black) and the unconstrained portfolio (gray) as benchmarks.

The out-of-sample wealth process shows that performance generally improves as the ESG target is relaxed. The strictest feasible portfolio (
 $\theta _p = 6.6$
) generates the lowest terminal wealth. As the ESG target increases, the optimizer can allocate capital across a broader set of assets, increasing diversification and improving out-of-sample performance. For sufficiently relaxed ESG targets, (
 $\theta_p \geq 15.1$
) performance converges to that of the unconstrained minimum-variance portfolio, indicating that the ESG constraint is no longer binding.
Despite this improvement, all ESG-constrained portfolios and the unconstrained minimum-variance portfolio are outperformed by the equally weighted benchmark. This result suggests that, over the evaluation period, the benefits of broad diversification outweighed the volatility reduction achieved by the minimum-variance strategy. Although Portfolio #1 exhibited a non-monotonic relationship between ESG stringency and performance, Portfolio #2 displays a largely monotonic pattern in which stricter ESG constraints lead to lower terminal wealth.
Performance and s ustainability m etrics
Table 5 reports the annualized return, annualized volatility, Sharpe ratio, and portfolio ESG score for each strategy, alongside the equally weighted and unconstrained benchmarks.
Performance and sustainability metrics for Portfolio #2 under EU STOXX 50

Table 5. Long description
The table presents performance and sustainability metrics for various portfolio strategies under EU STOXX 50. It includes columns for annualized return (percent), annualized volatility (percent), Sharpe ratio, and portfolio ESG score. The table has 11 rows and 4 columns. Row 1: 1/N (Benchmark), 11.33, 15.75, 0.680, 16.56. Row 2: Unconstrained, 8.00, 12.20, 0.631, 14.99. Row 3: θp = 15.1, 8.00, 12.19, 0.630, 14.99. Row 4: θp = 14.6, 7.79, 12.24, 0.610, 14.60. Row 5: θp = 14.5, 7.75, 12.26, 0.610, 14.50. Row 6: θp = 10.7, 7.05, 14.84, 0.459, 10.70. Row 7: θp = 10.6, 7.04, 14.96, 0.450, 10.60. Row 8: θp = 8.8, 6.96, 18.05, 0.370, 8.80. Row 9: θp = 8.7, 7.01, 18.26, 0.370, 8.70. Row 10: θp = 7.5, 5.81, 21.52, 0.263, 7.50. Row 11: θp = 7.4, 5.68, 21.82, 0.250, 7.40. Row 12: θp = 6.6, 0.87, 24.95, 0.030, 6.60.
The relationship between ESG strictness and performance in Portfolio #2 is approximately monotonic. Returns and Sharpe ratios increase as the ESG target is relaxed, whereas volatility declines. The equally weighted benchmark achieves the highest return and Sharpe ratio. The unconstrained portfolio and
 $\theta _p = 15.1$
deliver nearly identical performance because they share the same portfolio allocation.
At stringent ESG targets
 $\theta _p = 6.6$
and
 $7.4$
, the optimizer is forced to concentrate in a relatively small set of low-ESG-risk assets, resulting in lower returns and higher volatility. As the ESG target is relaxed, diversification increases, volatility declines, and risk-adjusted performance improves.
Within the EU sample, and under this portfolio strategy, the assets excluded by stricter ESG constraints possess diversification benefits that outweigh any sustainability-related advantage. Consequently, tighter ESG screening primarily manifests as a diversification cost.
5.3.2 North American market
For Portfolio #2 in the North American market, we minimize portfolio variance subject to the same ESG and UNPRI constraints as in Portfolio #1.
We find no feasible solution for
 $\theta _p \leq 8.9$
.
At stringent ESG targets, the optimizer concentrates in a small set of low-ESG-risk firms, primarily Cisco Systems, Inc. (CSCO) and DHR. As
 $\theta _p$
increases, additional assets gradually enter the portfolio and diversification improves. By
 $\theta _p \approx 19$
, the ESG constraint becomes non-binding and the portfolio closely resembles the unconstrained minimum-variance solution containing 14 assets.
Across all feasible targets, Portfolio #2 remains substantially more diversified than Portfolio #1, typically holding between 3 and 15 assets.
The ESG target constraint drives this gradual expansion. At low values of
 $\theta _p$
, the optimizer excludes higher-ESG-risk firms to satisfy the sustainability requirement. As the target is relaxed, the feasible set expands, permitting broader diversification while preserving the variance-minimization objective. Once
 $\theta _p \geq 19$
, the ESG constraint becomes effectively non-binding and the portfolio converges toward the unconstrained minimum-variance allocation.
Using the optimal weights, we consider the wealth process by assuming the investor invests
 $\$1000$
at the beginning of the out-of-sample period.
For clarity in visualization, we select eight representative boundaries that capture the key transitions in portfolio composition:
 $\theta _p = 9$
(minimum feasible),
 $9.9$
(initial diversification),
 $10$
(The Walt Disney Company (DIS), Walmart (WMT), Adobe (ADBE) enter),
 $11.9$
(Merck & Co. (MRK) appears),
 $12.9$
(Oracle Corporation (ORCL) and Bristol-Myers Squibb Company (BMY) join),
 $13.9$
(Pfizer (PFE) and NextEra Energy (NEE) enter),
 $14.9$
(Johnson & Johnson (JNJ) and Visa (V) appear),
 $15.7$
(T-Mobile US (TMUS) and McDonald’s (MCD) join),
 $16$
(Amazon.com (AMZN) enters),
 $17$
(The Procter & Gamble Company (PG) becomes prominent),
 $18$
(further diversification),
 $19$
(near convergence), and
 $19.1$
(upper bound).
Figure 7 displays the resulting wealth processes.
Wealth process under Portfolio #2 by assuming an initial investment of $1000 and using the S&P 500 Top 50 index for a given target ESG,
 $\theta _p$
. We include the equally weighted portfolio (black) and the unconstrained portfolio (gray) as benchmarks.

The equally weighted benchmark achieves the highest terminal wealth among all strategies, substantially outperforming both the unconstrained minimum variance portfolio and every ESG-constrained portfolio.
Among ESG-constrained portfolios,
 $\theta _p = 15.7$
delivers the strongest performance, followed by
 $\theta _p = 16$
,
 $\theta _p = 14.9$
, and
 $\theta _p = 17$
. The strictest feasible target (
 $\theta _p = 9$
) produces the lowest terminal wealth, and the least strict targets (
 $\theta _p = 19$
and
 $19.1$
) also perform poorly. Performance does not follow a clear monotonic pattern with respect to ESG strictness.
Performance and sustainability metrics
Table 6 reports the annualized return, annualized volatility, Sharpe ratio, and portfolio ESG score for each strategy, alongside the equally weighted and unconstrained benchmarks.
Performance and sustainability metrics for Portfolio #2 under S&P 500 Top 50

Table 6. Long description
A table with six columns and twelve rows. The columns are labeled Portfolio, Ann. return (%), Ann. volatility (%), Sharpe ratio, and Portfolio ESG. The rows are labeled with different portfolio strategies and their corresponding metrics. Row 1: 1/N (Benchmark), 14.22, 14.91, 0.892, 18.60. Row 2: Unconstrained, 11.09, 13.31, 0.790, 20.82. Row 3: θp = 19.1, 9.74, 13.79, 0.670, 19.10. Row 4: θp = 19.0, 9.80, 13.82, 0.680, 19.00. Row 5: θp = 18.0, 10.38, 14.10, 0.700, 18.00. Row 6: θp = 17.0, 10.58, 14.56, 0.690, 17.00. Row 7: θp = 16.0, 10.92, 15.01, 0.690, 16.00. Row 8: θp = 15.7, 10.99, 15.14, 0.690, 15.70. Row 9: θp = 14.9, 10.63, 15.46, 0.653, 14.90. Row 10: θp = 13.9, 10.23, 15.81, 0.620, 13.90. Row 11: θp = 12.9, 9.74, 16.50, 0.560, 12.90. Row 12: θp = 11.9, 9.44, 17.55, 0.510, 11.90. Row 13: θp = 11.0, 10.40, 19.97, 0.495, 10.00. Row 14: θp = 9.9, 10.51, 20.12, 0.500, 9.90. Row 15: θp = 9.0, 8.49, 26.50, 0.310, 9.00.
The equally weighted benchmark achieves the highest return (14.22%) and Sharpe ratio (0.892) among all strategies, with a relatively low volatility (14.91%).
Among ESG-constrained portfolios, the strictest feasible target (
 $\theta _p = 15.7$
) delivers the highest return and Sharpe ratio. Volatility declines monotonically from 26.50% at
 $\theta _p = 9.0$
to 13.31% for the unconstrained portfolio.
The unconstrained portfolio has the highest ESG score, capturing its inclusion of higher-ESG-risk assets.
In the European market, relaxing ESG constraints consistently improves performance across all risk-adjusted metrics. As the ESG target increases, diversification improves, volatility declines, and both returns and Sharpe ratios rise. The unconstrained minimum-variance portfolio is among the strongest-performing solutions, indicating that ESG restrictions primarily reduce diversification opportunities.
In the North American market, the relationship is more nuanced. Performance does not improve monotonically with ESG relaxation. Instead, the strongest risk–return trade-offs emerge at intermediate ESG targets, suggesting that moderate ESG restrictions can remove some undesirable exposures while preserving diversification benefits.
In both markets, the equally weighted benchmark outperforms every ESG-constrained minimum-variance portfolio as well as the unconstrained minimum-variance portfolio. This finding reinforces a recurring result in the portfolio optimization literature; minimizing variance does not necessarily translate into superior out-of-sample performance.
For a minimum-variance investor, ESG alignment therefore comes with a cost. Although the nature of that cost differs across regions, ESG screening does not improve upon naive diversification in either market.
5.4 Portfolio #3: Black–Litterman model
For the Bayesian model, we aim to address the parameter uncertainty in Portfolio #1 and #2 analysis. Most portfolio optimization methods require estimates of expected returns and covariance matrices, which are often uncertain and can lead to poor out-of-sample performance. The Black–Litterman model addresses this by combining market equilibrium returns with investor views, thereby reducing the impact of estimation error.
To incorporate sustainability considerations, we specify investor views using ESG information. Because lower scores indicate lower ESG risk, we assume that firms with lower ESG risk should earn higher expected returns. We therefore construct the view vector from standardized ESG scores. For each asset
 $i$
, we compute:
 \begin{equation} \tilde {\theta }_i = \frac {\theta _i - \bar {\theta }}{\sigma (\theta )} \end{equation}
where
 $\theta _i$
is the raw ESG score,
 $\bar {\theta }$
is the average ESG score across all assets, and
 $\sigma (\theta )$
is the standard deviation.
The standardized scores are used to form the Black–Litterman view vector, where assets with lower ESG risk receive more favorable expected-return assessments than assets with higher ESG risk.
The Black–Litterman model then combines this view with historical return estimates to produce posterior expected returns and a posterior covariance matrix. We then solve the following optimization problem for each target ESG value
 $\theta _p$
:
 \begin{equation} \mathbf{w}^* = \arg \max _{\mathbf{w}} \big \{ \mathbf{w}^\top \boldsymbol{\mu }_{BL} - \mathbf{w}^\top \boldsymbol{\Sigma }_{BL} \mathbf{w} \big \} \end{equation}
subject to the same constraints as in Portfolios #1 and #2.
5.4.1 European markets
For Portfolio #3 in the EU market, feasible solutions first appear at
 $\theta _p = 6.4$
and exist for all higher targets.
From
 $\theta _p = 6.4$
to
 $6.9$
, the portfolio allocates to ASML.AS and VNA.DE, with VNA.DE dominating at stricter targets (98% at
 $\theta _p = 6.4$
) and declining as the target rises. At
 $\theta _p = 7.0$
, Kering SA (KER.PA) enters, forming a three-asset portfolio with ASML.AS and VNA.DE. Between
 $\theta _p = 7.5$
and
 $10.2$
, ADS.DE enters, when VNA.DE continues to decline and KER.PA gradually increases. From
 $\theta _p = 10.3$
to
 $10.8$
, DB1.DE joins, and VNA.DE exits. At
 $\theta _p = 10.9$
, the portfolio stabilizes at a fixed four-asset allocation of ADS.DE, ASML.AS, Deutsche Börse AG (DB1.DE), and KER.PA, which persists through
 $\theta _p = 20.0$
and matches the unconstrained Black–Litterman portfolio.
The ESG target constraint
 ${\mathbf{w}}^\top \boldsymbol{\theta } \leq \theta _p$
drives the allocation. For
 $\theta _p \leq 6.3$
, no feasible solution exists. For
 $6.4 \leq \theta _p \leq 10.8$
, the constraint is binding, forcing the inclusion of low-ESG assets such as VNA.DE and KER.PA. At
 $\theta _p = 10.9$
and above, the ESG target constraint becomes non-binding, and only the UNPRI constraint remains active. The portfolio converges to the unconstrained Black–Litterman optimum.
Figure 8 displays the resulting wealth processes for the selected ESG targets.
Unlike Portfolio #1, where intermediate ESG targets generated the strongest performance, Portfolio #3 exhibits an almost monotonic relationship between ESG relaxation and out-of-sample performance.
As the ESG target increases, the optimizer gains access to a broader set of assets identified by the Black–Litterman model as attractive on a risk-adjusted basis.
The equally weighted benchmark achieves the highest terminal wealth among all strategies.
Table 7 reports the annualized return, annualized volatility, Sharpe ratio, and portfolio ESG score for each strategy.
Performance and sustainability metrics for Portfolio #3 under EU STOXX 50

Table 7. Long description
A table with five columns and twelve rows. The columns are labeled Portfolio, Ann. return (%), Ann. volatility (%), Sharpe ratio, and Portfolio ESG. The rows compare different portfolio strategies. Row 1: 1/N (Benchmark), 11.33, 15.75, 0.681, 16.56. Row 2: Unconstrained, 1.52, 24.12, 0.060, 11.35. Row 3: θ_p = 10.9, 2.52, 25.22, 0.100, 10.90. Row 4: θ_p = 10.8, 2.40, 25.21, 0.090, 10.80. Row 5: θ_p = 10.3, 1.81, 25.30, 0.071, 10.30. Row 6: θ_p = 10.2, 1.70, 25.32, 0.070, 10.20. Row 7: θ_p = 7.5, 1.50, 24.42, 0.060, 7.50. Row 8: θ_p = 7.4, 1.32, 24.68, 0.050, 7.40. Row 9: θ_p = 7.0, 0.16, 26.28, 0.006, 7.00. Row 10: θ_p = 6.9, 0.42, 26.75, 0.020, 6.90. Row 11: θ_p = 6.4, 4.97, 29.92, 0.170, 6.40.
Wealth process under Portfolio #3 by assuming an initial investment of $1000, using the EU STOXX 50 index for a given target ESG,
 $\theta _p$
. We include the equally weighted portfolio (black) and the unconstrained portfolio (gray) as benchmarks.

Performance improves monotonically with ESG relaxation in Portfolio #3. Returns and Sharpe ratios increase as the target is loosened, whereas volatility declines from the strictest target up to an intermediate level, and then stabilizes. The strictest target performs worst, concentrated in VNA.DE, which underperformed. Relaxing the target allows the portfolio to shed VNA.DE and gain exposure to KER.PA and ADS.DE, improving performance.
Interestingly, several ESG-constrained portfolios outperform the unconstrained Black–Litterman solution. This suggests that moderate ESG restrictions can improve portfolio construction by preventing excessive exposure to assets that subsequently underperform.
The equally weighted benchmark substantially outperforms all strategies, delivering the highest return and Sharpe ratio with the lowest volatility. Tighter constraints produce greener portfolios at the cost of lower returns and higher volatility.
5.4.2 North American market
For Portfolio #3 in the North American market, feasible solutions first appear at
 $\theta _p = 9.0$
and exist for all higher targets.
From
 $\theta _p = 9.0$
to
 $11.1$
, the portfolio allocates to NVDA and DHR, with NVDA’s weight increasing from approximately 2% to 62% as
 $\theta _p$
rises. Between
 $\theta _p = 11.2$
and
 $14.1$
, AMZN enters, ADBE appears briefly, and DHR gradually exits. At
 $\theta _p = 14.2$
, the portfolio simplifies to a fixed allocation of 51% AMZN and 49% NVDA, which remains constant through
 $\theta _p = 20.0$
and matches the unconstrained Black–Litterman portfolio.
Compared with Portfolio #1, the Black–Litterman framework produces substantially less concentrated allocations. Rather than converging to a single-stock portfolio, the Bayesian adjustment distributes capital across multiple assets.
Regarding the constraints, for
 $\theta _p \leq 14.1$
, the ESG target constraint is binding, and satisfying it automatically ensures the UNPRI constraint holds. For
 $\theta _p \geq 14.2$
, the ESG target constraint becomes non-binding, and the UNPRI constraint alone drives the portfolio composition, with the fixed AMZN–NVDA pair naturally satisfying the at-least-50% requirement.
We select six representative boundaries that capture the key transitions in portfolio composition:
 $\theta _p = 9.0$
(minimum feasible, NVDA-DHR pair),
 $\theta _p = 10.9$
(AMZN approaches entry),
 $\theta _p = 11.2$
(entry of AMZN and ADBE),
 $\theta _p = 14.2$
(exit of DHR, stabilization into fixed AMZN-NVDA pair),
 $\theta _p = 14.5$
(confirmation of fixed allocation), and
 $\theta _p = 20.0$
(upper bound).
Figure 9 displays the resulting wealth processes for the selected ESG targets.
Wealth process under Portfolio #3 by assuming an initial investment of $1000, using the S&P 500 Top 50 index for a given target ESG,
 $\theta _p$
. We include the equally weighted portfolio (black) and the unconstrained portfolio (gray) as benchmarks.

The unconstrained Black–Litterman portfolio and ESG-constrained portfolios with
 $\theta _p \geq 14.2$
achieve identical terminal wealth, as they all converge to the same fixed allocation of AMZN and NVDA. For
 $\theta _p = 14.2$
, the ESG target constraint becomes non-binding, and the portfolio matches the unconstrained optimum.
The superior performance at
 $\theta _p = 11.2$
suggests that moderate ESG constraints improve portfolio construction by balancing exposure to the strongest-performing assets with diversification benefits. The
 $\theta _p = 10.9$
portfolio ranks second, followed by
 $\theta _p = 14.2$
and
 $\theta _p = 14.5$
.
Performance declines for both stricter and more relaxed targets relative to
 $\theta _p = 11.2$
. The strictest feasible target delivers the lowest terminal wealth, reflecting its heavy concentration in DHR. The equally weighted benchmark outperforms only the strictest feasible target.
These results reveal a non-monotonic relationship between ESG strictness and performance in the Black–Litterman framework, with the best balance occurring at a moderate target (
 $\theta _p = 11.2$
).
Performance and sustainability metrics
Table 8 reports the annualized return, annualized volatility, Sharpe ratio, and portfolio ESG score for each strategy, alongside the equally weighted and unconstrained benchmarks.
Performance and sustainability metrics for Portfolio #3 under S&P 500 Top 50

Table 8. Long description
A table with six rows and five columns comparing performance and sustainability metrics for different portfolio strategies. The columns are labeled Ann. return (%), Ann. volatility (%), Sharpe ratio, and Portfolio ESG. The rows are labeled with different portfolio strategies: 1/N (Benchmark), Unconstrained, and various theta values. Row 1: 1/N (Benchmark), 14.22, 14.91, 0.890, 18.60. Row 2: Unconstrained, 37.41, 35.39, 0.898, 14.59. Row 3: theta = 20.0, 37.40, 35.39, 0.900, 14.59. Row 4: theta = 14.5, 38.69, 35.73, 0.920, 14.50. Row 5: theta = 11.2, 43.20, 37.01, 0.970, 14.20. Row 6: theta = 11.2, 45.90, 35.03, 1.078, 11.20. Row 7: theta = 10.9, 40.47, 32.79, 1.040, 10.90. Row 8: theta = 9.0, 9.12, 27.42, 0.320, 9.00.
The benchmark delivers the lowest risk-adjusted performance among all strategies except the strictest feasible target. The unconstrained portfolio and
 $\theta _p = 20.0$
achieve nearly identical results, as they share very similar fixed AMZN–NVDA allocation.
Risk-adjusted performance peaks at
 $\theta _p = 11.2$
and then declines for both stricter and more relaxed targets. The strictest feasible target (
 $\theta _p = 9.0$
) performs worst, when targets at the upper end (
 $\theta _p \geq 14.2$
) converge to the unconstrained level.
The Black–Litterman results reveal that the interaction between ESG constraints and portfolio performance is highly market dependent. In the EU sample, relaxing ESG constraints steadily improves performance, indicating that the assets identified by the Black–Litterman model as most attractive are not necessarily those with the lowest ESG risk. Consequently, stricter sustainability requirements impose a measurable opportunity cost.
In contrast, the North American market exhibits a non-monotonic relationship between ESG strictness and performance, with the strongest results achieved at intermediate ESG targets. This suggests that moderate ESG constraints can improve portfolio construction by preventing convergence to the unconstrained optimum while retaining exposure to the key return-generating assets.
Compared with Portfolio #1, the Black–Litterman framework produces more diversified allocations and smoother transitions across ESG targets, reflecting the role of Bayesian shrinkage in mitigating estimation error. These findings suggest that the benefits of ESG integration depend not only on the sustainability characteristics of the asset universe, but also on the portfolio construction methodology used to translate those characteristics into investment decisions.
5.5 Portfolio #4: Multiobjective portfolio construction
Portfolio #4 adopts a fundamentally different approach from the previous strategies. Rather than treating ESG as a constraint on portfolio construction, ESG performance becomes the primary optimization objective. The first stage minimizes the portfolio ESG score. The resulting subset of assets is then passed to a second-stage maximin optimization proposed by Young (Reference Young1998), which determines the final portfolio allocation.
Unlike Portfolios #1–#3, Portfolio #4 produces a single allocation rather than a family of portfolios indexed by
 $\theta _p$
. The first stage directly minimizes portfolio ESG risk and therefore does not depend on a target ESG threshold. The second stage then applies the maximin objective to the resulting ESG-screened asset universe. For comparison, we also consider an unconstrained version that omits the ESG minimization stage.
5.5.1 European market
In the European market, the ESG-minimization stage selects ISP.MI, VNA.DE, and SU.PA, which jointly achieve the lowest feasible portfolio ESG score.
The subsequent maximin optimization allocates capital across all three assets, producing a concentrated portfolio with an ESG score of 7.36. By contrast, the unconstrained maximin portfolio selects ADS.DE, AD.AS, and AI.PA.
With these optimal weights, we explore how an investor’s wealth would evolve if they initially invested $1000 at the beginning of the out-of-sample period as shown in Figure 10.
Wealth process under Portfolio #4 by assuming an initial investment of $1000 and using the EU STOXX 50. We include the equally weighted portfolio (black) and the unconstrained portfolio (gray) as benchmarks.

The ESG-constrained portfolio achieves the highest terminal wealth, outperforming both the equally weighted benchmark and the unconstrained alternative.
The unconstrained maximin portfolio performs substantially worse despite having access to the full investment universe. This finding suggests that the ESG-screening stage can improve the quality of the opportunity set rather than merely restricting it, using our investment universe.
Performance and sustainability metrics
Table 9 reports the annualized return, annualized volatility, Sharpe ratio, and portfolio ESG score for each strategy.
Performance and sustainability metrics for Portfolio #4 under EU STOXX 50

Table 9. Long description
A table comparing performance and sustainability metrics for different portfolios under EU STOXX 50. The table has four rows and four columns. The columns are labeled Ann. return (%), Ann. volatility (%), Sharpe ratio, and Portfolio ESG. The rows are labeled 1/N (Benchmark), Portfolio #4 (Constrained), and Portfolio #4 (Unconstrained). Row 1: 1/N (Benchmark), 11.33, 15.75, 0.681, 16.56. Row 2: Portfolio #4 (Constrained), 18.56, 21.23, 0.802, 7.36. Row 3: Portfolio #4 (Unconstrained), 3.85, 17.68, 0.214, 14.53.
The constrained version of Portfolio #4 substantially outperforms both the benchmark and the unconstrained version. It achieves the highest return and Sharpe ratio among all three strategies, while also delivering the lowest ESG score.
In the EU sample, the ESG-minimization stage appears to improve portfolio construction.
The unconstrained version, which applies the maximin objective directly to the full investment universe without ESG minimization, delivers the lowest return and Sharpe ratio, with a moderate ESG score.
The equally weighted benchmark achieves moderate performance with the lowest volatility, but lags behind the constrained portfolio on both return and risk-adjusted performance.
Wealth process under Portfolio #4 by assuming an initial investment of $1000 and using the S&P500 Top 50 index. We include the equally weighted portfolio (black) and the unconstrained portfolio (gray) as benchmarks.

5.5.2 North American market
In the North American market, the ESG-minimization stage selects CSCO and DHR, which jointly achieve the lowest feasible portfolio ESG score.
The unconstrained maximin portfolio instead selects AAPL and AMZN.
With these optimal weights, we explore how an investor’s wealth would evolve if they initially invested $1000 at the beginning of the out-of-sample period. Figure 11 displays the wealth processes for Portfolio #4 in the North American market.
The unconstrained version achieves the highest terminal wealth, substantially outperforming both the constrained portfolio and the equally weighted benchmark. The constrained portfolio delivers terminal wealth below the benchmark, ranking lowest among the three strategies. The equally weighted benchmark maintains stable performance throughout, ending between the two portfolios.
Table 10 reports the annualized return, annualized volatility, Sharpe ratio, and portfolio ESG score for each strategy.
Performance and sustainability metrics for Portfolio #4 under S&P 500 Top 50

Table 10. Long description
A table comparing performance and sustainability metrics for different portfolios under S&P 500 Top 50. The table has four rows and four columns. The columns are labeled Ann. return (percent), Ann. volatility (percent), Sharpe ratio, and Portfolio ESG. The rows are labeled 1/N (Benchmark), Portfolio #4 (Constrained), and Portfolio #4 (Unconstrained). Row 1: 1/N (Benchmark), 14.22, 14.91, 0.892, 18.60. Row 2: Portfolio #4 (Constrained), 11.09, 19.85, 0.530, 9.65. Row 3: Portfolio #4 (Unconstrained), 17.93, 25.98, 0.635, 15.84.
The ESG-constrained portfolio achieves the lowest portfolio ESG score and therefore the strongest sustainability profile.
However, the sustainability gain is accompanied by lower returns, higher volatility than the benchmark, and weaker risk-adjusted performance. In contrast, the unconstrained portfolio not only delivers the highest return but also assumes substantially greater risk.
Portfolio #4 provides a useful contrast to the previous strategies because sustainability is treated as the primary objective rather than a constraint. The results reveal striking differences across markets.
In the EU sample, the ESG-minimization stage improves both sustainability and financial performance. The assets selected on ESG grounds subsequently deliver superior risk-adjusted returns, allowing the constrained portfolio to outperform both the unconstrained maximin portfolio and the equally weighted benchmark. This suggests a strong alignment between sustainability characteristics and investment opportunities within the European market.
In the North American sample, the opposite pattern emerges. Although the ESG-minimization stage produces the greenest portfolio, it excludes assets that contribute materially to return generation. Hence, the constrained portfolio underperforms both the unconstrained portfolio and the benchmark. The results therefore indicate a clear sustainability-performance trade-off.
Taken together, the evidence suggests that sustainability-first portfolio construction can either enhance or impair performance depending on whether firms with the strongest sustainability characteristics also possess attractive investment fundamentals. The effectiveness of ESG integration therefore depends not only on the optimization methodology, but also on the underlying relationship between ESG risk and expected returns within the market under consideration.
5.6 Portfolio #5: Ensemble portfolio
For the ensemble portfolio, we average the weights across all feasible ESG targets for Portfolios #1–#3 and the constrained version of Portfolio #4. For comparison, we also construct an unconstrained ensemble by averaging the unconstrained versions of all four portfolios.
5.6.1 European markets
The constrained ensemble averages weights across all feasible ESG targets for Portfolios #1–#3 and the constrained version of Portfolio #4, resulting in a diversified portfolio spanning 16 assets. VNA.DE (29.4%), ASML.AS (15.9%), ADS.DE (15.5%), SU.PA (11.6%), and ISP.MI (11.1%) are the largest holdings, with the top five assets accounting for approximately 84% of the portfolio.
The unconstrained ensemble is more concentrated, spanning 13 assets with ADS.DE dominating at 48.7%, followed by AD.AS (15.3%) and DB1.DE (6.5%).
Figure 12 displays the wealth processes for the ensemble portfolios alongside the equally weighted benchmark.
The constrained ensemble outperforms the unconstrained ensemble, delivering higher terminal wealth. Averaging across different portfolio objectives and ESG regimes reduces exposure to extreme allocations and mitigates model-specific concentration risk.
The unconstrained ensemble’s heavy allocation to ADS.DE (48.7%) proved detrimental.
The equally weighted benchmark, however, outperforms both ensembles, highlighting the value of broad diversification across the full investment universe.
Performance and sustainability metrics
Table 11 reports the annualized return, annualized volatility, Sharpe ratio, and portfolio ESG score for each ensemble strategy alongside the equally weighted benchmark.
Performance and sustainability metrics for Portfolio #5 under EU STOXX 50

Table 11. Long description
A table comparing portfolio performance and sustainability metrics for different strategies under EU STOXX 50. The table has four rows and five columns. Column headers are Portfolio, Ann. return (%), Ann. volatility (%), Sharpe ratio, and Portfolio ESG. Row labels are 1/N (Benchmark), Ensemble, and Unconstrained ensemble. Row 1: 1/N (Benchmark), 11.33, 15.75, 0.681, 16.56. Row 2: Ensemble, 7.32, 19.44, 0.363, 9.00. Row 3: Unconstrained ensemble, 2.09, 19.90, 0.104, 13.18.
Wealth process under Portfolio #5 by assuming an initial investment of $1000 and using the EU STOXX 50 index.

The constrained ensemble outperforms the unconstrained ensemble on both return and risk-adjusted performance, while also achieving a substantially lower ESG score.
Relative to the unconstrained ensemble, the constrained ensemble achieves higher returns, a higher Sharpe ratio, and a lower ESG score. This suggests that combining ESG-constrained strategies can improve portfolio diversification while maintaining a stronger sustainability profile.
5.6.2 North American markets
For the North American market, the constrained ensemble averages weights across all feasible ESG targets for Portfolios #1–#3 and the constrained version of Portfolio #4, resulting in a broadly diversified portfolio spanning 20 assets. DHR (24.4%), NVDA (22.1%), WMT (8.6%), CSCO (7.9%), and AMZN (6.4%) emerge as the largest holdings, with the top five assets accounting for approximately 70% of the portfolio. The presence of DHR and NVDA as the dominant holdings reflects the influence of strict ESG targets (favoring DHR) and high-return potential (favoring NVDA) across the averaged strategies.
In contrast, the unconstrained ensemble exhibits extreme concentration. NVDA dominates at 37.3%, followed by AMZN at 23.3% and AAPL at 15.0%, with the top three assets comprising over 75% of the portfolio. The remaining weight is distributed across 16 additional assets, heavily skewed toward technology and consumer discretionary sectors. This concentration mirrors the individual unconstrained strategies, particularly Portfolios #1 (100% NVDA) and #4 (60% AAPL, 40% AMZN).
The contrast between the two ensembles illustrates how incorporating ESG constraints fundamentally alters portfolio composition. The constrained ensemble achieves greater diversification by including stricter ESG targets that force allocation to lower-ESG assets like DHR and CSCO, while also retaining exposure to high-return assets like NVDA. The unconstrained ensemble captures the full upside potential of high-growth technology stocks at the cost of extreme concentration.
Figure 13 displays the wealth processes for the ensemble portfolios alongside the equally weighted benchmark.
Wealth process under Portfolio #5 by assuming an initial investment of $1000 and using the S&P500 Top 50 index.

The unconstrained ensemble achieves the highest terminal wealth, substantially outperforming both the constrained ensemble and the benchmark. This performance reflects its concentrated exposure to NVDA, AMZN, and AAPL, which experienced extraordinary growth during the out-of-sample period.
The constrained ensemble also outperforms the benchmark, delivering an improvement over naive diversification. All three strategies follow similar trajectories in the early years but diverge sharply in the later years, coinciding with the period of rapid technology stock appreciation. The unconstrained ensemble pulls ahead dramatically, whereas the constrained ensemble maintains a steady lead over the benchmark.
Table 12 reports the annualized return, annualized volatility, Sharpe ratio, and portfolio ESG score for each ensemble strategy alongside the equally weighted benchmark.
Performance and sustainability metrics for Portfolio #5 under S&P 500 Top 50

Table 12. Long description
A table comparing portfolio performance and sustainability metrics. The table has four rows and four columns. The columns are labeled Ann. return (%), Ann. volatility (%), Sharpe ratio, and Portfolio ESG. The rows are labeled 1/N (Benchmark), Ensemble, and Unconstrained ensemble. Row 1: 1/N (Benchmark), 14.22, 14.91, 0.892, 18.60. Row 2: Ensemble, 21.40, 20.86, 0.929, 13.16. Row 3: Unconstrained ensemble, 32.77, 26.99, 1.050, 15.93.
Both ensembles outperform the equally weighted benchmark in terms of return and risk-adjusted performance. The unconstrained ensemble achieves the highest return and Sharpe ratio, reflecting its concentrated exposure to high-growth technology stocks.
Both ensembles achieve lower ESG scores than the benchmark. The constrained ensemble is the greenest, confirming that averaging across ESG targets successfully incorporates sustainability considerations. Notably, even the unconstrained ensemble outperforms the benchmark on sustainability, as its component strategies inherently favored low-ESG-risk technology stocks.
In the European market, the constrained ensemble outperforms the unconstrained ensemble while achieving a substantially lower ESG score. The improvement appears to arise primarily from diversification rather than from sustainability characteristics alone. By averaging across multiple ESG-constrained optimization frameworks, the ensemble reduces exposure to concentrated positions in a small number of assets and produces a more balanced allocation.
In the North American market, both ensemble portfolios outperform the equally weighted benchmark. The unconstrained ensemble achieves the strongest performance, largely due to its substantial exposure to a small group of high-performing technology stocks. Because several of these firms also possess relatively favorable ESG characteristics, imposing additional sustainability constraints provides less incremental benefit than in the European market.
The results suggest that the value of ESG integration within an ensemble framework depends on how sustainability characteristics interact with the underlying drivers of portfolio returns. In Europe, ESG constraints primarily contribute through improved diversification and reduced concentration risk. In North America, sustainability and return objectives are more closely aligned, causing ESG constraints to have a smaller effect on portfolio outcomes.
Our ensemble results should be interpreted as a demonstration of the potential benefits of combining diverse optimization methods; investors with specific ESG requirements can adapt the approach by restricting the averaging set to compliant strategies.
A practical advantage of the ensemble approach is robustness to ESG specification and model uncertainty. Individual optimization models often exhibit abrupt shifts in portfolio composition as ESG constraints change, leading to unstable allocations. By averaging across multiple optimization frameworks and ESG targets, the ensemble smooths these transitions and reduces sensitivity to any single specification.
For investors facing uncertainty regarding the appropriate ESG target, the ensemble provides a more stable allocation while retaining exposure to the key investment themes identified across the underlying strategies.
5.7 Regional drivers of performance
The performance differences between the EU and North American markets are primarily driven by the alignment between ESG characteristics and return opportunities and the differences in market composition.
Across the portfolio strategies considered, the strongest-performing assets in the North American sample exhibit relatively favorable ESG profiles. As a result, sustainability objectives and return maximization are often complementary, allowing ESG-constrained portfolios to maintain exposure to key return-generating assets. This is particularly evident in the recurring importance of firms such as NVDA, AMZN, and AAPL across multiple portfolio constructions.
In contrast, the EU results reveal a weaker alignment between sustainability and return opportunities. Several portfolio strategies achieve their strongest performance only after ESG constraints are relaxed, indicating that some attractive investment opportunities lie outside the strictest ESG thresholds. Consequently, investors in the EU market face a more pronounced trade-off between achieving low portfolio ESG scores and accessing the full opportunity set.
Also, the sectoral composition of each index differs materially. The North American sample is heavily influenced by large-cap technology firms that combine strong financial performance with relatively favorable ESG characteristics. The EU sample is more broadly distributed across sectors, resulting in greater variation between ESG profiles and financial performance. As a result, ESG constraints play a more active role in shaping portfolio outcomes in the EU than in North America.
Overall, the results suggest that the effectiveness of ESG integration depends less on the constraints themselves and more on the extent to which sustainability characteristics align with the dominant drivers of returns within the underlying market.
The findings are also consistent with the equilibrium moderl of Pástor et al. (Reference Pástor, Stambaugh and Taylor2021), in which inverstors’ preferences for sustainable assets raise the prices of the assets and thereby lower their expected returns. In the EU, tighter ESG constraints force the optimizer into low ESG risk assets. If strong sustainability preferences have already bid up the prices of these assets, their expected returns are lower, and holding them lowers portfolio returns relative to the unconstrained portfolio. This increases the performance cost of the constraint. In North America, the cost is smaller, which suggests that sustainability preferences are less fully reflected in prices and that low-risk assets are less richly valued.
Together, these factors explain why ESG-constrained strategies in North America can deliver both strong returns and sustainability alignment, whereas in the EU they often require a more explicit trade-off.
6. Conclusion
This study examined how a passive investor making a static portfolio allocation decision can integrate ESG considerations into portfolio construction. Using five optimization frameworks under a common set of ESG and UNPRI constraints across the European and North American markets, we isolate the effect of the portfolio construction methodology from the effect of the sustainability constraints themselves.
Per our results, ESG integration is neither inherently beneficial nor inherently costly. Rather, its effectiveness depends on how sustainability constraints interact with the optimization objective and the characteristics of the underlying market. ESG constraints can improve portfolio performance when they reduce harmful concentration or preserve exposure to strong return-generating assets, but they can also reduce performance when they exclude those assets. Consequently, the question is not whether investors should integrate ESG considerations, but how they should incorporate them into the portfolio construction process.
This mechanism also explains the regional differences observed in our analysis. In the North American market, many of the strongest-performing assets also exhibit relatively favorable ESG profiles, allowing sustainability objectives and financial performance to reinforce one another. In contrast, the European market presents a stronger sustainability-return trade-off because several high-performing assets lie outside the strictest ESG thresholds. These findings are broadly consistent with the equilibrium framework of Pástor et al. (Reference Pástor, Stambaugh and Taylor2021), which suggests that the pricing of ESG risk depends on market maturity. As sustainable investing becomes more deeply embedded in financial markets, the relationship between ESG characteristics and expected returns may evolve, leading to different outcomes across regions and over time.
Our comparison of five optimization frameworks further demonstrates that portfolio construction matters as much as the sustainability constraint itself. The same ESG target can produce markedly different allocations, diversification patterns, and out-of-sample performance depending on the optimization framework. Among the approaches considered, the proposed ensemble methodology provides a particularly robust framework by combining information across multiple optimization methods, reducing dependence on any single model or ESG specification while maintaining competitive performance.
This study adopts a static buy-and-hold framework in which the investment universe and ESG information remain fixed throughout the investment horizon. Although this design isolates the effect of the optimization methods, it does not capture dynamic portfolio rebalancing or changes in firms’ sustainability characteristics over time. Future research could extend this work by incorporating time-varying ESG information, dynamic rebalancing strategies, optimized ensemble weights, and robustness analyses using alternative ESG data providers, estimation windows, and market environments. Also, controlling for standard asset-pricing factors (size, value, momentum) would further clarify whether ESG-related performance persists beyond known return drivers.
Acknowledgements
The authors wish to thank the anonymous referees for their careful reading and constructive comments, which helped improve the quality of this paper. This paper is dedicated to the memory of Tony Wirjanto, who died after a brief illness while this paper was under review. He was a brilliant researcher and a generous professor, and it was a great privilege to work with him on this project. He is deeply missed.
Data availability statement
The data and code that support the findings of this study are available from the corresponding author, RDD, upon reasonable request.
Competing interests
The authors declare no competing interests.
Ethical standards
The research meets all ethical guidelines, including adherence to the legal requirements of the study country.


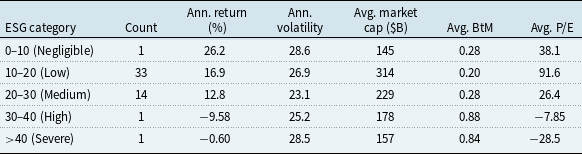
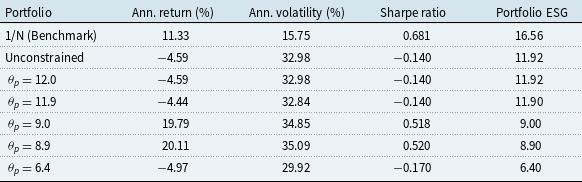

 θp

 θp

 θp

 θp
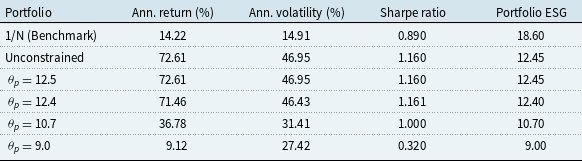

 θp
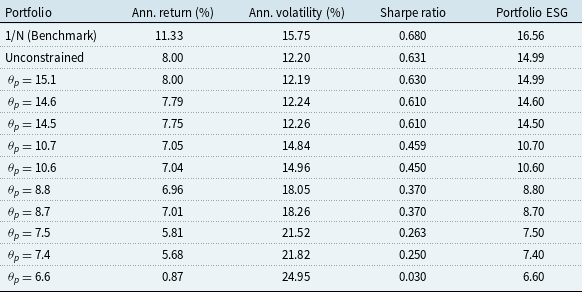

 θp
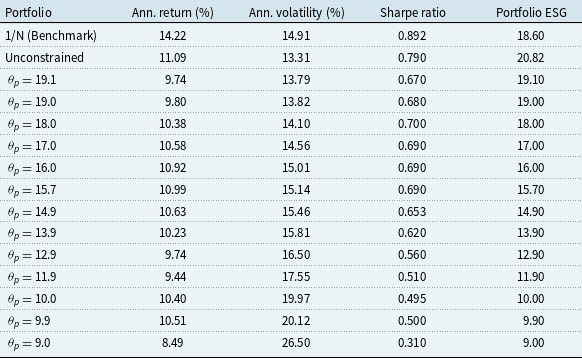
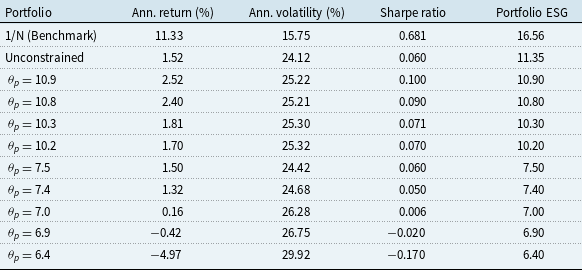

 θp

 θp
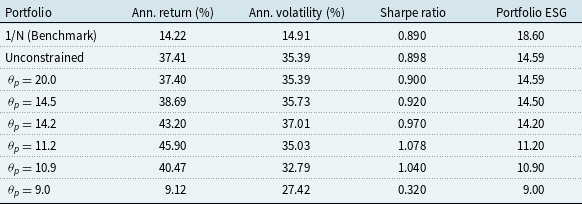









 Open access

