Introduction
Strategic workforce planning underpins high-quality healthcare. In the UK, the combination of a growing and ageing population, advances in medical technology and evolving patient expectations have placed unprecedented strain on the National Health Service (NHS).1 Despite increasing demands, the UK has historically maintained fewer doctors per capita than comparable nations.Reference Anandaciva2 This shortfall was compounded by the coronavirus disease 2019 (Covid-19) pandemic, as widespread service disruption drove NHS waiting lists to record levels. As of April 2025, Otolaryngology holds the second-longest waiting list of any hospital specialty, with over 638,000 outstanding appointments and procedures.3 These challenges underscore the importance of workforce planning to support post-pandemic recovery, address service inequities and ensure the NHS can meet current and future healthcare needs.
Globally, human resources are central to healthcare delivery.Reference McIsaac, Buchan, Abu-Agla, Kawar and Campbell4, Reference Kruk, Gage, Arsenault, Jordan, Leslie and Roder-DeWan5 Greater workforce density is linked to improved health outcomes, particularly in surgical specialties.Reference Meara, Leather, Hagander, Alkire, Alonso and Ameh6 For instance, a 10 per cent increase in ENT workforce correlated with a 1.46 per cent reduction in the mortality-to-incidence ratio (MIR) for laryngeal cancer and a 1.34 per cent reduction for pharyngeal cancer (p < 0.001).Reference Stanford‐Moore, Cahill, Raj, Irakoze, Alkire and Bhutta7 Globally, the density of ENT consultants averages 2.19 per 100,000 population, but ranges from 0 to 61.7, further driving worldwide healthcare inequality.Reference Petrucci, Okerosi, Patterson, Hobday, Salano and Waterworth8
The UK ENT workforce predominantly comprises consultants, associates, resident doctors, locally employed doctors and other members of the multidisciplinary team. Concerns regarding the mismatch between ENT workforce supply and growing population demands have persisted for years.Reference Wilmot, Davis and Carrie9 An inadequate specialist workforce contributes to services delays, reduced healthcare access and poorer outcomes.Reference Kruk, Gage, Arsenault, Jordan, Leslie and Roder-DeWan5 However, the true scale of the problem is difficult to quantify in the absence of a national workforce repository. Moreover, future planning must not only address current shortfalls, but anticipated future demands. This challenge extends beyond tracking population growth. For instance, an ageing population is likely to increase the prevalence of presbyacusis, while a migration influx may raise demand for paediatric ENT services.Reference Lewis, Burns, Cortina-Borja, Heilmann, Macfarlane and Nath10–Reference Roth, Hanebuth and Probst12 Effective planning must account for geographical population distributions, training capacity and evolving working patterns, including less-than-full-time (LTFT) roles and flexible training pathways, necessitating an adjustment of training, recruitment and retention strategies accordingly.13
This report examines the state of the UK ENT workforce as of April 2025 across England, Scotland, Wales and Northern Ireland. Workforce numbers are mapped against population statistics to analyse geographic and demographic patterns and identify priorities for future research and workforce planning.
Methods
Telephone interviews were conducted with identified clinicians at each hospital site and collated into a standardised spreadsheet. Data were by stratified by Health Education England Postgraduate Deaneries geographical regions across the UK. All UK NHS trusts contributed data, irrespective of teaching hospital status or the presence of postgraduate trainees.
Data were collated regarding the number of consultants, associates (previously referred to as associate specialists), locally employed doctors (LEDs), residents with national training numbers (NTNs), fellows, general practice (GP) trainees, core trainees, foundation year doctors (FY1 and FY2), physicians assistants (PAs) and advanced nurse practitioners (ANPs). For the purposes of this study, the terminology “second-on-call resident” is used to replace the outdated “middle grade” nomenclature, and “first-on-call resident” replaces the previous terminology of senior house officer (SHO). Gender and working patterns (full time [FT] or less-than-full-time [LTFT]) were documented for all grades.
For consultants, additional details included specialist register status, unfilled and locum consultant positions, age and subspecialty interest. Regional leads encouraged consultants to self-declare a single primary subspecialty interest. For reporting purposes, tertiary-level paediatric specialists were classified as “paediatrics”, skull base surgeons as either “otology” or “rhinology” and consultants with both benign and malignant practices and “head and neck”, including those undertaking thyroid work. Consultants who did not select a subspecialty were recorded as generalists. All second-on-call resident doctors with NTNs were invited to complete an online questionnaire distributed via Google Forms, which captured data on anticipated subspecialty intentions.
Responses were collated in Microsoft Excel and, where possible, corroborated with publicly available information from NHS trust websites. In cases of incomplete data, individual departments were contacted directly by the lead researcher to obtain missing details.
The workforce was geographically mapped; consultant numbers, subspecialty distribution and resident numbers were analysed in relation to regional population statistics. This facilitated calculation of workforce density, assessment of distribution patterns and identification of regional outliers. Formal ethical approval was not sought, as no patient-level data were collected. All participating centres provided information voluntarily.
Results
Across the UK, all 135 NHS trusts providing ENT services across 17 deaneries responded to the survey, yielding complete data regarding total numbers of consultants. Information on consultant ages were missing from two trusts (1.49 per cent) and resident numbers from one trust (0.75 per cent).
Consultants
A total of 1207 consultants were recorded (excluding associates) with a male-to-female ratio of 3.83:1 (Table 1); 89.48 per cent were on the specialist register. Substantive consultants accounted for 89.40 per cent (n = 1079), of whom 12.42 per cent work LTFT. Locums comprised 10.60 per cent (n = 128) of the workforce, with 135 associates also working at consultant level. Notably, 15.34 per cent of consultants were over 60, highlighting a substantial proportion approaching retirement.
Composition and demographics of the consultant workforce

* Percentages for estimated consultant age calculated from a denominator of 1181 consultants; data from two hospital trusts were unavailable.
CCT = Certificate of Completion of Training; FT = full-time; LTFT = less-than-full-time;
Regional analysis of consultant workforce
Across the UK, there was an average of 1.77 ENT consultants per 100,000 population, ranging from 1.28 in the East of England to 2.67 in London and Thames Valley (Figure 1). Northern regions averaged 8 per cent more consultants per capita than southern regions (1.84 v 1.70). Inland regions, boosted by London and Thames Valley’s high consultant density, reported 22 per cent more consultants than the coastal average of 1.67.
Geographical Distribution of ENT Consultants per 100,000 Population in the UK.

Consultant subspecialty interests
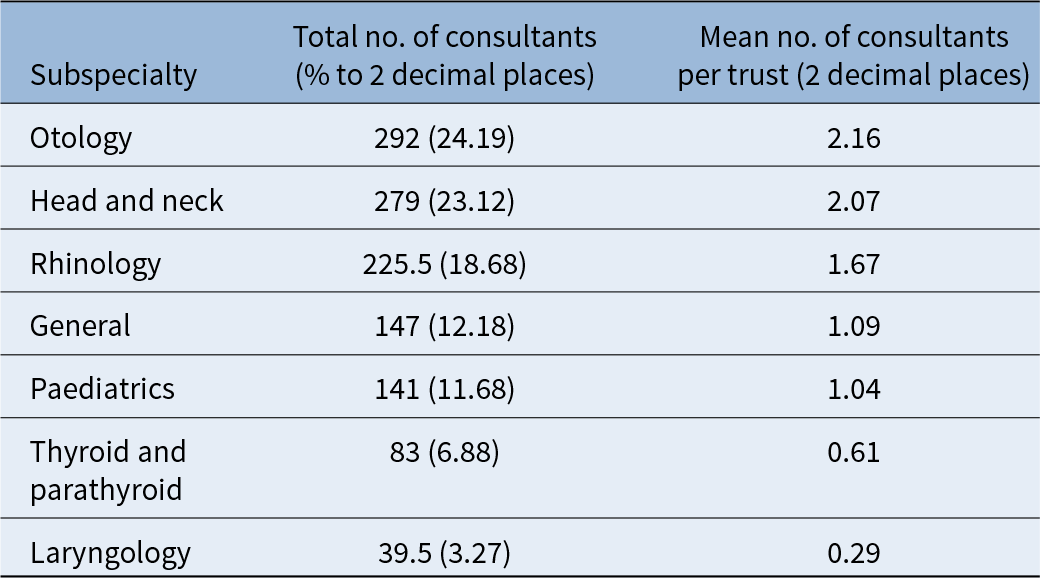
Otology was the most reported subspecialty (24.19 per cent), followed by head and neck surgery (23.12 per cent) and rhinology (18.68 per cent) (Table 2). Marked regional variation was observed (Fig. 2). London and Thames Valley had the highest consultant density for all subspecialties except head and neck, led by the Northeast. Otology ranged from 0.28 per 100,000 in the Northwest to 0.63 in London and Thames Valley, representing a more than two-fold difference. Rhinology varied threefold (0.17 in East Midlands vs 0.54 in London and Thames Valley), and Head and Neck ranged from 0.43 (Southwest) to 0.74 (Northeast). Paediatric ENT showed the greatest disparity; rates in the Northeast (2.11) and London and Thames Valley (2.10) were over six times higher than that of the East of England (0.33).
Distribution of consultant workforce by subspecialty and mean number per trust

Geographical Distribution of ENT Consultant Subspecialty Workforce per 100,000 Population in the UK.

Overall, the Northeast ranked highly for head and neck and paediatric ENT provision but was mid-range for other subspecialties. Wales had high otology provision (0.60), yet was among the lowest for rhinology (0.25). There was little north–south divide, apart from a modest northern advantage in head and neck.
Second-on-call resident doctors
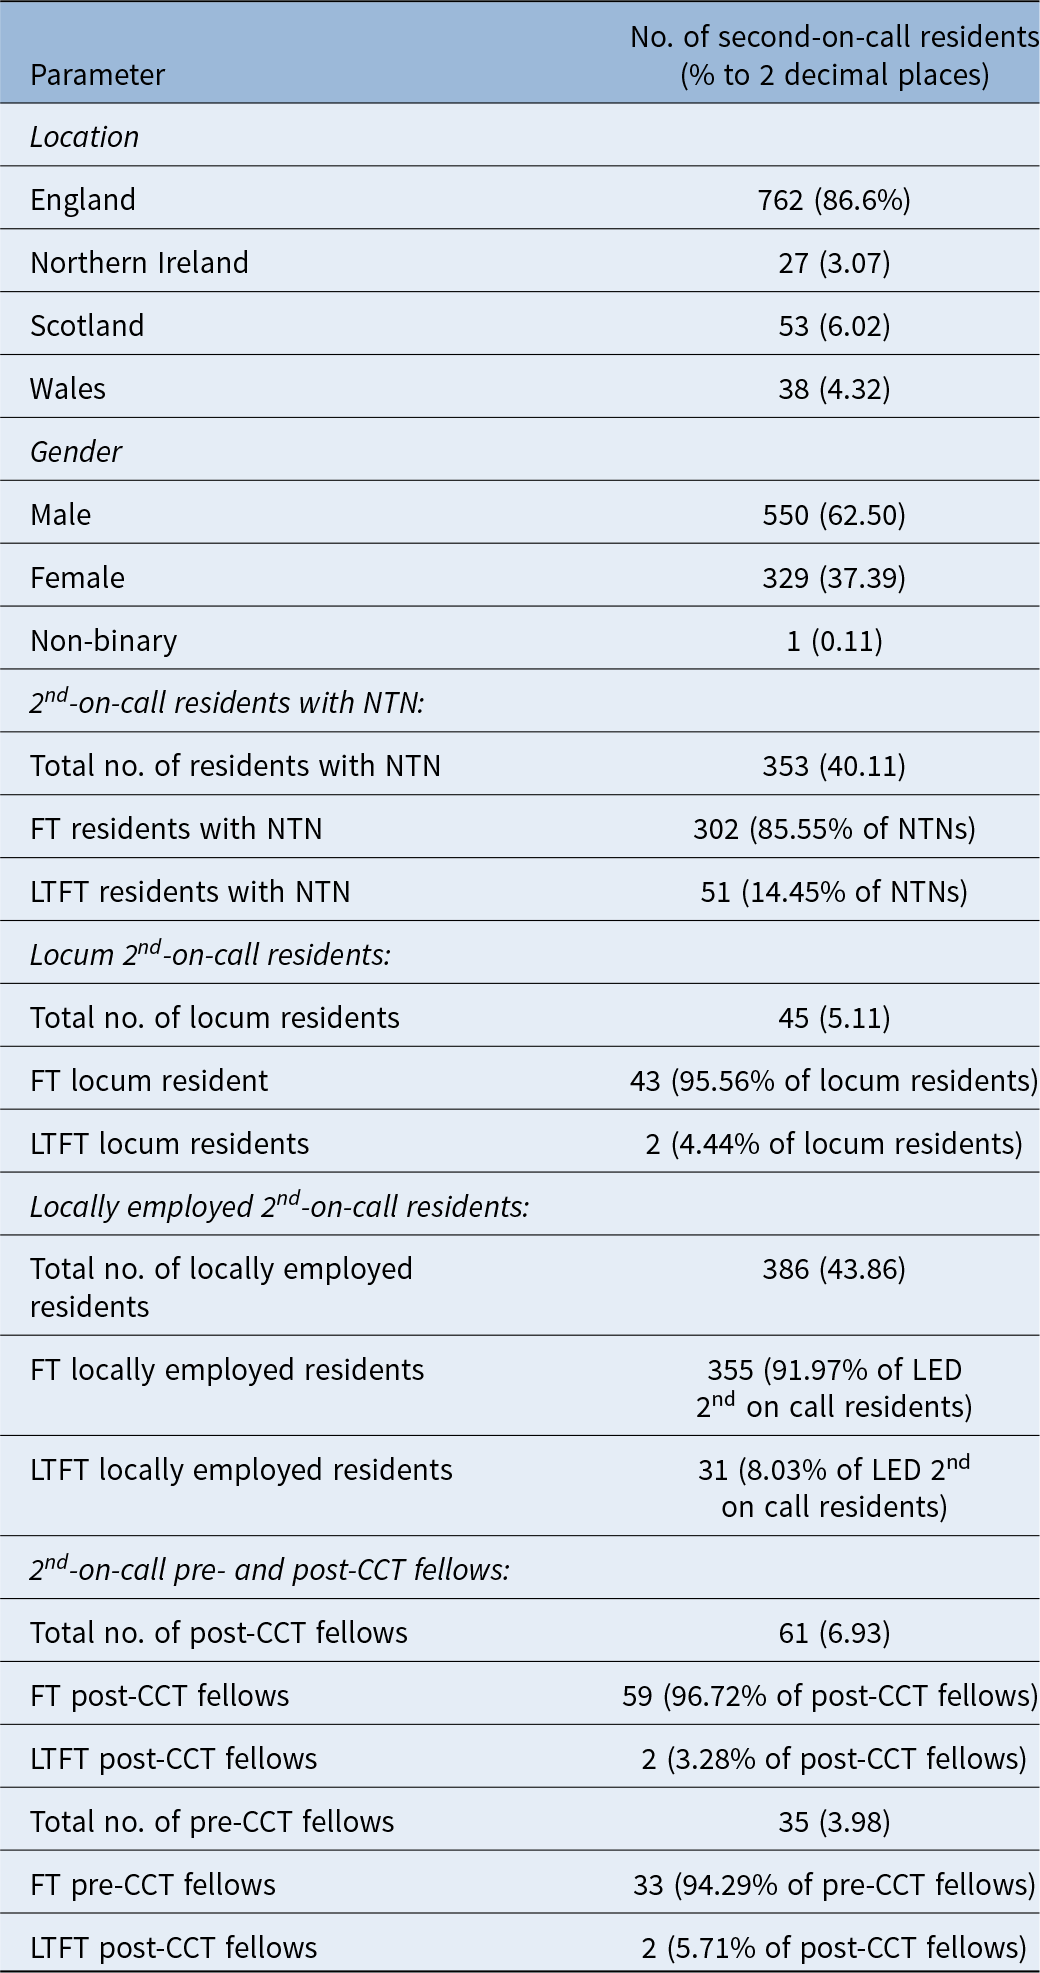
Across the UK, 134 NHS trusts employed 880 second on-call resident doctors, with a mean of 6.57 per department (Table 3). Three trusts had no middle grade residents, and 30 vacancies were reported. The male-to-female ratio was 1.67:1, with 90 per cent (n = 792) working FT and 10 per cent (n = 88) LTFT. Of second on-call doctors, 40.11 per cent held NTNs, 5.11 per cent were locums and 43.86 per cent were LEDs. Fellows comprised 10.91 per cent, of whom 63.54 per cent were post-Certificate of Completion of Training (CCT) fellows.
Composition and demographics of the second-on-call resident workforce

CCT = Certificate of Completion of Training; FT = full-time; LED = locally employed doctor; LTFT = less-than-full-time; NTNs = national training numbers.
Regional analysis of second-on-call resident doctor workforce
Second-on-call resident densities ranged from 0.83 per 100,000 in the East of England to 2.17 in London and Thames Valley (2.6-fold difference) (Figure 3). The Northwest, Northern Ireland and Yorkshire exceeded the national mean of 1.29 per 100,000, while the Southwest, Scotland and East Midlands fell below it. Geographically, the North averaged 10 per cent more middle grades than the South, and inland regions averaged 27 per cent more than coastal areas.
Geographical Distribution of Second On-Call Resident ENT Doctors per 100,000 Population in the UK.

Intended subspecialty interests of second-on-call resident doctors
We received 147 responses from second-on-call NTNs (registrars) regarding their anticipated subspecialty interests, representing a 46.68 per cent response rate. Head and Neck Surgery (25.85 per cent) and Rhinology (25.85 per cent) were the most popular, whilst General ENT (8.16 per cent) and Laryngology (4.76 per cent) were the least favoured. Comparison with consultant subspecialty interests showed similar overall distributions (Figure 4). Differences in subspecialty interests were not significantly different between NTNs and consultants (χ2(5) = 3.40, p = 0.64).
Comparison of Intended Subspeciality Interests of Second-On-Call Residents with NTNs and Consultant Subspecialty Interests.

First-on-call resident doctors
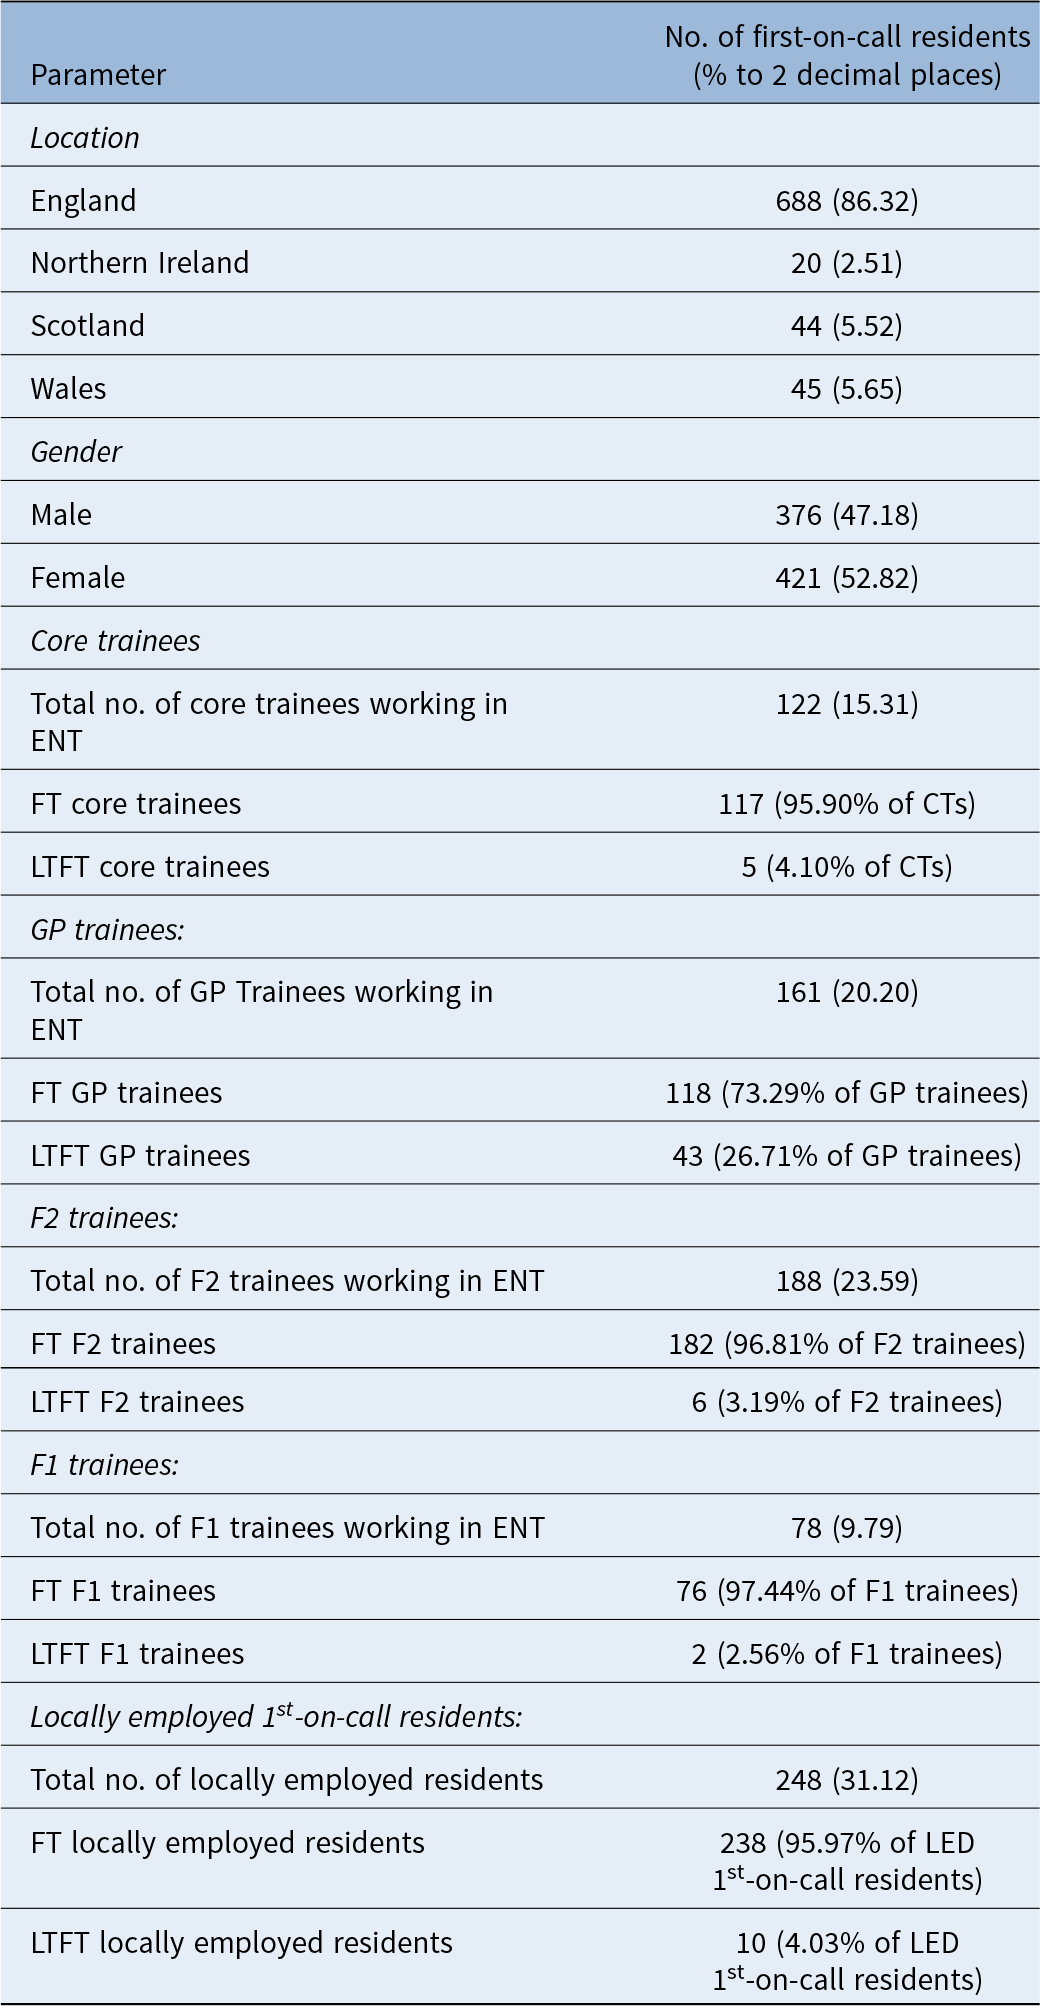
Across the UK, 797 first-on-call resident doctors covered 134 NHS trusts. Departments averaged 5.95 doctors, with nine trusts reporting none despite providing consultant-led ENT services. Women comprised a greater proportion of the workforce (M:F 0.89:1). Most (91.72per cent; n = 731) worked full time, with 30 reported vacancies nationally. Most first-on-call-residents were in training posts (68.88per cent; n = 549).
Regional analysis of first-on-call resident doctor workforce
Across 12 deaneries, the mean first-on-call density was 1.17 per 100,000 population (Table 4). Scotland had the lowest (0.81) and London and Thames Valley the highest (1.58) at nearly double Scotland’s rate (Fig. 5). Wales (1.42) and the West Midlands (1.41) were also high, while the East of England (0.90), Southwest (0.93) and Northeast (1.00) only achieved 57-59 per cent of the first-on-call density afforded in London and Thames Valley. Inland regions averaged 27 per cent more first-on-call residents than coastal regions, whilst the South averaged 14 per cent more than the North.
Geographical Distribution of First On-Call Resident ENT Doctors per 100,000 Population in the UK.

Composition and demographics of the first-on-call resident workforce

F1 = foundation year 1 doctor; F2 = foundation year 2 doctor; FT = full-time; GP = general practice; LED = locally employed doctor; LTFT = less-than-full-time.
Advanced nurse practitioners and physician assistants
Data from 126 trusts (93.33 per cent response rate) identified 199 practitioners (mean 1.58 per responding trust), although 51 trusts had none. The workforce was predominantly female (87.43 per cent). Reported roles included independent microsuction and emergency clinics, tracheostomy care, specialist clinic support, ward rounds, emergency triage and theatre assistance, spanning inpatient, outpatient and emergency settings.
Discussion
The UK population is projected to exceed 70 million by mid-2029.14 Although this national ENT workforce census demonstrates an expansion in consultant numbers since previous surveys, it reaffirms persistent issues of under-resourcing, regional disparity and workforce imbalance. Wilmot et al. reported 771 consultants across the UK in 2018,Reference Wilmot, Davis and Carrie9 whereas our more complete and contemporaneous dataset records 1207 consultants, representing a 56 per cent increase in absolute numbers over six years. Similarly, Nieto et al. identified 818 consultants in England in 2022, compared with 1019 in our present dataset.Reference Nieto, Lee, Hall and McDermott15 These differences may reflect genuine growth in consultant numbers or differences in data collection methodology. We identified around 50 unfilled consultant posts, mirroring vacancies previously reported.Reference Wilmot, Davis and Carrie9
Despite this expansion, our per-capita density of 1.77 ENT consultants per 100,000 remains below the Royal College of Surgeons’ 2011 benchmark of 2 per 100,000.16 Our density aligns more closely with high-middle-income nations like Australia (1.8), but with high-income European comparators like France (4.2) and Germany (7.7).Reference Petrucci, Okerosi, Patterson, Hobday, Salano and Waterworth8, Reference Wilmot, Davis and Carrie9, 17 Globally, the average ENT clinician density is 2.19 per 100,000, but the European mean of 5.70 more than doubles this, highlighting the UK’s relative under-provision of ENT services.Reference Petrucci, Okerosi, Patterson, Hobday, Salano and Waterworth8 Meeting the Royal College of Surgeons (RCS) benchmark would require an additional 157 consultants, bringing the total to 1364. Whilst this represents only a modest absolute increase, it must be coupled with strategic geographic redistribution, account for projected population change and be matched by expansions in theatre and clinic capacity.
Gender distribution
Gender disparity remains a striking and unchanged feature across all three datasets.Reference Wilmot, Davis and Carrie9, Reference Nieto, Lee, Hall and McDermott15 Our census found a modest improvement, with women comprising 20 per cent of consultants and 34.67 per cent of the overall workforce. This remains below the international median of 40 per cent female ENT clinicians, suggesting pipeline improvements have yet to translate into proportional representation of women in senior consultant roles.Reference Petrucci, Okerosi, Patterson, Hobday, Salano and Waterworth8
Regional variation
Across the UK, London and Thames Valley consistently reported the highest staffing levels across all grades, whilst the East of England the Southwest ranked among the lowest. This disparity suggests consultant growth has not translated into a more equitable geographic distribution. Our dataset provides the first granular mapping of the ENT subspecialty workforce, revealing marked disparities most notably in Paediatric ENT. Similar patterns of regional imbalance are evident globally.Reference Stolovitzky and Alvarado18–Reference Vickery, Weterings and Cabrera-Muffly21 The persistence of regional inequities in the distribution of consultants and residents alike has clear service implications, highlighting the need for targeted redistribution.22 Addressing these gaps may require targeted recruitment incentives for underserved areas, networked service models, regular outreach clinics and expansion of training posts in these regions.22, 23
Workforce retention
The age profile of our consultant workforce raises significant concern: 15.3 per cent of consultants are over 60 years, and a further 12.4 per cent are over 55 years, meaning nearly one third (n = 331) will be approaching retirement age within the next five years. This mirrors the Royal College of Physicians’ 2023 workforce report, which warns 64 per cent of surgeons aged 55–64 plan to retire within four years.24 With the average retirement age for UK consultants estimated between 59.6 yearsReference Smith, Goldacre and Lambert25 and 62.8 years,24 such attrition will demand a sustained output of CCT holders at levels unlikely to be achieved without expanding current training capacity. Urgent action is required to avert a workforce shortage, including measures to create rewarding and supportive working environments to support the retention of this highly skilled cohort.
Burnout and deteriorating working conditions have been cited as major drivers of early retirement across surgery, with the Royal College of Surgeons’ 2023 census highlighting inadequate staffing and support as common themes.Reference Balendran, Bath, Awopetu and Kreckler26, 27 This challenge extends beyond those nearing retirement, affecting recruitment and retention across the entire workforce. General Medical Council (GMC) data indicate that post-pandemic attrition rates have risen by 20 per cent compared with pre-2019,13 and the most recent National Training Survey reported record levels of trainee and trainer burnout at 52 per cent.28 Flexible working arrangements are increasingly important in retaining staff. In our study, 12.4 per cent of substantive consultants and 14.4 per cent of NTNs worked LTFT, aligning with other surgical specialties.Reference Cathcart, Mayne, Hull, Jones and Miller29 Supporting such arrangements is crucial, particularly for early- and mid-career consultants balancing professional and personal commitments.30
Another key finding consistent with previous reports is the continued reliance on non-training grade doctors, particularly LEDs and associates.Reference Nieto, Lee, Hall and McDermott15 In our dataset, LEDs comprised 43.9 per cent of second-on-call doctors, with similar patterns at first-on-call level. This reflects broader NHS dependence on non-training doctors, 45 per cent of whom leave within three years of appointment.13 Improving professional development opportunities, reducing barriers to Certificate of Eligibility for Specialist Registration (CESR) application and integrating LED voices into departmental decision-making could improve retention.
National workforce strategy and implications for ENT
Our census supports the growing consensus that, although ENT consultant numbers are increasing, they are not doing so fast enough to meet demand, and the expansion is not equitably distributed. The NHS Long Term Workforce Plan (2023) aims to expand the medical workforce by 60,000–74,000 doctors by 2037, with parallel increases in nurses and allied health professionals.31 Central to this is increasing domestic training capacity, starting with medical school intake. In 2018, the government announced a commitment to double medical school places to 15,000 by 203131; however, this has not been matched by a proportional rise in postgraduate training posts.32 As a result, the British Medical Association (BMA) reports that around 20,000 applicants were unable to secure specialty training this year.33 Conversely, overcorrection also poses risk, as evidenced by the experience in Neurosurgery. A 2020 workforce report commissioned by the Society of British Neurological Surgeons identified over 50 more trainees than consultant posts in 2020, with the gap projected to reach 100 by 2029.Reference Whitehouse, Jayasekera and Nelson34
It takes many years to train specialists, and ENT must also compete with other disciplines for finite resources, including theatre capacity, outpatient clinic space and allied health support. In the short term, international recruitment will remain essential; in 2022, over half of new GMC registrants were international medical graduates.13 Ethical recruitment should be paired with streamlined entry pathways, structured induction and settlement support for overseas ENT surgeons.35 Parallel investment in ANPs, PAs and extended-role allied health professionals can help expand capacity.Reference Bhutta, Bu, de Muñoz, Garg and Kong36
Accurate, up-to-date workforce intelligence is essential. Our findings indicate higher consultant numbers than previous estimates, reflecting the limitations of data gathered solely through administrative or Freedom of Information routes.Reference Wilmot, Davis and Carrie9, Reference Nieto, Lee, Hall and McDermott15 A national ENT workforce registry, updated regularly, would allow for real-time tracking of consultant and resident numbers and vacancies, while ensuring the equitable distribution of services across the UK. This would support dynamic workforce modelling, enabling planners to respond proactively to demographic shifts, training bottlenecks or unexpected service demands.
Strengths and limitations
This study provides the most comprehensive assessment of the UK ENT workforce to date, covering all staff grades and offering granular, population-mapped regional data. Strengths include direct engagement with frontline clinicians to ensure accuracy, mapping subspecialties to regions and consideration of anticipated retirement trends.
Limitations include potential misclassification of subspecialty interests due to the need for self-declaration into a single category, and the possibility that regional density figures do not fully account for quaternary service provision in metropolitan centres. Data on vacancies were reported in absolute terms rather than whole-time equivalents, and no breakdown of less-than-full-time working was available. Age was grouped into categories to preserve anonymity and may not directly indicate retirement timelines.
Conclusion
This national census provides the most comprehensive and contemporaneous assessment of the UK ENT workforce, spanning all four nations and all staffing grades. Consultant numbers have grown by 56 per cent since 2018, yet our per-capita density remains below the Royal College of Surgeons’ benchmark and far behind many high-income European comparators. Persistent geographic and subspecialty imbalances mean that numerical growth has not translated into equitable service provision.
These results echo previous findings to reveal three consistent themes: an expanding consultant pool that still struggles to meet service demands, a static gender imbalance and ongoing reliance on non-resident doctors to plug workforce gaps. Nearly one-third of consultants will reach retirement age within five years, and retaining senior doctors and supporting non-training grades is vital to stem attrition. Our findings highlight the urgent need for a multifaceted strategy: expand training numbers, incentivise underserved areas, optimise multidisciplinary teams and ensure adequate theatre and clinic capacity to support this expansion.
ENT workforce challenges mirror wider NHS pressures of rising patient demands, finite resources, uneven distribution and slow training pipelines. Meeting future demand will require integrated national planning, underpinned by accurate data from a dedicated national ENT registry. Sustained investment, coordinated policy and engagement from professional bodies are essential to build resistance. Without decisive action, inequities, delays and unmet needs will persist; with it, equitable high-quality care is within reach. The future is clear: plan or perish.
Acknowledgement
We express our sincere gratitude to ENT UK for their invaluable support and to the ENT Workforce Planning Group for their significant contributions. In particular, we thank Sofia Anastasiadou, Christian Grimes, Ellie Crossley, Aoife Waters, Amy Campbell, Trio Shenton, Victoria Evans, Alison Liu, Miljyot Sangha, Emily Moore, Shivani Parihar, Michael Chu, Rosanna Wright, Vikash Dhodhia, Shyam Gokani, Anya Selwyn, Matthew Flynn and Lauren Bolton for their dedication and input.
Funding statement
The author(s) received no financial support for the research, authorship, and/or publication of this article.
Competing interests
The author/s declare/s no conflict of interest.