Implications
Whilst altering the plane of nutrition (PN) during the rearing phase altered BW of ewe replacements at joining (19 months) by 16%, there was no effect on ovulation rate regardless of ewe genotype (ovulation rates varying from 1.65 to 2.70). Changing the PN during the summer grazing season (ewe replacements aged 12 months) had little effect on the level of compensatory growth; during a 152-day grazing period compensatory growth accounted for only 49% of the difference in BW at the end of the previous winter. Pre-joining BW can be predicted with high precision from linear measurements (LMs) of body size at younger ages.
Introduction
The cost of rearing ewe replacements is influenced by the PN offered during their first winter and subsequent summer. Studies on the effects of the nutritional regime offered to replacement ewes in range-based production systems in the United States yielded somewhat conflicting results; Esplin et al. (Reference Esplin, Madsen and Philips1940) reported that, relative to replacements reared on the range, those wintered under feedlot conditions were 6.8 and 1 kg heavier at the end of their first winter and the end of the subsequent summer, respectively, and produced 20% more lambs at 2 years. Bradford et al. (Reference Bradford, Weir and Torell1961) reported a smaller degree of compensation for growth restriction during the period from weaning to ~16 months of age and found no evidence for any benefit in subsequent reproductive performance. In a UK hill environment, Purser and Roberts (Reference Purser and Roberts1964) reported that increasing average daily gain (ADG) of Scottish Blackface replacements between 6 and 12 months of age increased BW at first joining but had only a minor effect on subsequent reproductive performance. The development of robust equations, using LMs, to predict the evolution of ewe BW would be of practical benefit to producers in the implementation of breeding programmes in which BW is a component of the breeding objective.
There is a paucity of data on the long-term effects of altering the PN during the rearing phase on the performance of ewes managed in grass-based systems of prime lamb production. The primary objective of this study was to evaluate the effects of PN offered during different stages of the rearing phase, and the interaction between these effects, on BW and body size at joining (19 months of age), and on reproductive potential (ovulation rate). A second objective was to evaluate the importance of interactions between PN and ewe genotype, where these differed in mature size and prolificacy potential. Finally, we wished to evaluate the efficacy of prediction equations for BW at first joining based on linear body measurements taken at different stages during the rearing phase.
Material and methods
All animal procedures used in this study were conducted under experimental licence from the Irish Department of Health and Children (Dublin) in accordance with the Cruelty to Animals Act 1876 and the European Communities (Amendment of Cruelty to Animals Act 1876) Regulations 2002 and 2005.
Experimental design
A total of 287 ewe replacements (8 months old), consisting of four genotypes, were allocated to the study in late November, in 3 consecutive years. Each cohort of replacements (92 to 101 per year) was joined with rams, in mid-October, when ~19 months of age. The ewe replacements were allocated to four grazing treatments in a 2×2 factorial design consisting of two allowances of herbage (0.75 and 1.75 kg DM/head daily) offered during their first winter (winter_1) by two PNs during the following grazing season (summer_2) (achieved by set stocking to maintain sward height at 4 or 6 cm). In years 1, 2 and 3 the winter_1 grazing season was from 22 November to 29 March, 21 November to 31 March and 27 November to 6 April, respectively; summer_2 grazing season was from 29 March to 30 August, 31 March to 1 September and 6 April to 1 September, respectively. In years 1, 2 and 3 rams were joined with the ewes on 19 October, 21 October and 23 October, respectively. The four genotypes were Belclare (Bel) (n=80, mean initial BW 46.4 (SD 5.2) kg), Bel×Scottish Blackface (Bel×SBF) (n=74, mean initial BW 36.6 (SD 4.1) kg), Charmoise×SBF (C×SBF) (n=57, mean initial BW 31.3 (SD 3.4) kg) and Bel×SBF ewe that were heterozygous for either FecG H or FecX G mutations (BelMG×SBF) (n=76, mean initial BW 36.8 (SD 4.0) kg). FecG H and FecX G are mutations (in GDF9 and BMP15 genes, respectively) that cause a large increase in ovulation rate (Hanrahan et al., Reference Hanrahan and O’Malley2004). The animals were randomly allocated to four groups each year after stratification by BW within genotype. These four groups were then allocated at random to one of the four treatments. The Bel×SBF genotype was represented in all years, C×SBF was represented in year 1 only while the Bel and BelMG×SBF genotypes were represented in years 2 and 3.
Animals and management
The ewe lambs for the study were assembled at Athenry in mid-September each year and grazed, as one flock, on predominantly perennial ryegrass (Lolium perenne) swards until the study was initiated. The Bel animals were born and reared at this research station whereas the other genotypes were born and reared to age 5 months on the Teagasc Hill Farm at Leenane, Co., Galway (Hanrahan and O’Malley, Reference Hanrahan and Keady1999). The ewe lambs were treated, immediately before the study, with ivermectin (Oramec; Merial Animal Health, Harlow, Essex, England) for gastrointestinal parasites and nitroxynil (Trodax; Merial Animal Health, Harlow, Essex, England) for liver fluke. All animals were vaccinated against pasteurella pneumonia and clostridal diseases (using Heptavac-P; MSD Animal Health, Buckinghamshire, England) at the start of the study and again 4 weeks later.
During the 3 consecutive years four paddocks (each 1.3 ha) of permanent pasture (predominantly perennial ryegrass (L. perenne)) were closed during September (sheep were removed) and received fertiliser nitrogen (34 kg/ha) to produce herbage for deferred (extended) grazing during the following winter_1 period. The allowance of deferred-grazed herbage was based on DM yield determined to ground level. Before grazing, a longitudinal fence was placed in each paddock to divide it into two equal sections. The winter_1 grazing treatments were randomly allocated to these divisions initially; subsequently the treatment groups were rotated weekly between divisions to minimize any potential effects due to variation within a paddock. All animals on a treatment were grazed together and herbage was allocated daily. The allocated herbage area had temporary electrified fencing placed in front of, and at the back of, each daily block; consequently, the animals did not have access to previously grazed areas.
During summer_2 the ewe replacements were set stocked so as to maintain sward height at either 4 or 6 cm. Animals were treated with cyromazine (Vetrazin Spray-on; Novartis Animal Health, Camberley, Surrey, England) for the prevention of fly strike. From the end of the summer_2 grazing period until joining all animals were managed as one flock on predominantly perennial ryegrass swards. Oestrous cycles were synchronised, using proprietary progestogen-impregnated sponges (J and M Veterinary Services Ltd, Dublin, Ireland).
Measurements
Pre-grazing sward height was recorded twice weekly during winter_1, at 80 positions located randomly across the area to be grazed until the next measurement day, using a rising plate metre (Ashgrove Pastoral Products, Hamilton, New Zealand). Pre-grazing herbage mass was estimated once weekly, before grazing, within the area to be grazed within the next 7 days by cutting to ground level as described by Keady and Hanrahan (Reference Keady and Hanrahan2012). Harvested herbage was weighed and a representative bulked sample was used to determine oven DM concentration (100°C for 20 h) after which samples were milled and analysed for CP, ADF, NDF and ash. Herbage CP concentrations were determined using the Kjeldahl method (Tecator Kjeltec Auto 2400/2460 Analyzer/Sampler System, Foss). The concentrations of NDF and ADF were determined using a Fibertec analyser (Fibertec FT122; Foss, Hillerod, Denmark) based on the method of Van Soest (1976). Ash concentration was determined following combustion in a muffle furnace at 550°C for ~10 h. A representative sample of the fresh herbage was frozen (–20°C) for the predication of metabolizable energy (ME) using NIRS and the equations of Givens et al. (Reference Givens, Everington and Adamson1990).
Herbage mass post-grazing was determined twice weekly during winter_1, immediately after removal of animals from the allocated pasture, by cutting to ground level as described by Keady and Hanrahan (Reference Keady and Hanrahan2012); the sample was washed to remove soil contamination and dried at 100°C for 48 h. A representative dried sample was retained for the determination of ash concentration. Herbage organic matter intake per head was estimated twice weekly from the difference in herbage organic matter mass between pre- and post-grazing divided by the number of ewes per treatment. Herbage utilization was calculated as herbage consumed (pre-grazing yield minus post-grazing yield) as a proportion of pre-grazing herbage mass. During the summer_2 grazing period sward height was recorded twice weekly, at 50 positions located randomly across the area being grazed, using a rising plate metre (Ashgrove Pastoral Products, Hamilton, New Zealand). If the sward height within the grazing area was below target then the sward height of the pasture outside the lateral fence was also measured at 50 positions located randomly across the area, thus enabling a determination of the additional area required to be added to the grazing area.
Ewe BW and body condition score (BCS) (Russel et al., Reference Russel, Doney and Gunn1969) were recorded on 2 consecutive days immediately before the start of winter_1 grazing (age=7 months), at the end of winter_1 grazing (start of summer_2 grazing, age=12 months) and at the end of summer_2 grazing (age=17 months) and once immediately before joining (19 months). On 2 consecutive days at the start of the winter_1 grazing, at the end of winter_1 grazing (start of summer_2 grazing) and the end of summer_2 grazing the following body measurements were recorded: withers height, using a measuring stick, as the highest point over the scapulae vertical to the ground; body length, using a tape (Rondo, Hauptner-Instrumente GmbH, Wallisellen, Switzerland), as the distance from withers to the end of the pin bones; chest girth, using a tape, as the smallest circumference immediately behind the front legs; and cannon bone circumference, using a tape at the narrowest point of the cannon bone. This set of LMs will be referred to later as body size. Ovaries were examined by laparoscopy at a mean of 10 and 29 days post sponge removal to determine ovulation rate by counting the number of corpora lutea.
Statistical analyses
Animal measurements that were repeated on consecutive days (BW, BCS, LMs) were averaged before statistical analyses. All data analyses were executed by fitting linear models using Proc GLM or Proc MIXED of SAS (2011). The model for herbage intake had fixed effects for herbage allowance and date, with the herbage allowance by date interaction used as the error term. Because not all genetic groups were represented in each annual cohort the basic linear model used in all cases had a fixed effect that represented the combination of year of birth, genetic group and treatment. For traits measured at the end of winter_1, treatment represented the two levels of nutrition imposed during the winter_1, whereas four nutrition treatments were represented for traits measured at the end of summer_2. Orthogonal contrasts were used to partition the single-degree-of-freedom components that provided tests of the effects of treatment, genetic group and their interactions. Thus, for example, treatment differences at the end of summer_2 grazing were partitioned into effects due to levels of winter_1 and summer_2 nutrition and their interaction. The differences among genetic groups were primarily evaluated by calculating the contrast between Bel×SBF, which was represented in all cohorts, and each of the other genetic groups. The effects of genetic group are presented as these differences along with the least squares mean for the Bel×SBF group. The interaction between genetic group and treatment was partitioned based on the following set of orthogonal contrasts among genetic groups:
-
(i) Bel×SBF v. C×SBF
-
(ii) Bel v. mean of Bel×SBF and BelMG×SBF
-
(iii) Bel×SBF v. BelMG×SBF
Orthogonal contrasts were also used to partition the variation due to interactions between year of birth and treatment, and all components of the three-way interactions involving treatment, year of birth and genetic group. The set of linear body measurements were analysed using the MANOVA option of Proc GLM and the same set of contrasts as indicated above were evaluated. Models for BW and BCS included initial BW and BCS, respectively, as covariates and the models for MANOVA had initial LMs as covariates; in all cases covariates were expressed as deviations from the mean of their year-of-birth by genetic-group cohort.
The utility of body measurements at 7, 12 and 17 months of age as predictors of BW at first joining (19 months of age) were evaluated using a 3-fold validation protocol. For this purpose the animals were randomly divided, within each genotype-by-year-of-birth-by-treatment subclass, into three sub-populations. Each sub-population was used in turn to validate the prediction equation for BW at joining generated using the remaining 2/3 of the observations (the calibration data set). Body measurement variables were excluded from the prediction models if their additional contribution to the explanatory power of the model involving all of the LMs was not significant (P>0.05). The repeatability of measurements on consecutive days was estimated using models that had individual animal as a random effect in a mixed model fitted using Proc MIXED. Path coefficients (i.e. standardised partial regression coefficients) were used to evaluate the contribution of the individual body measurements, exclusive of any association operating through the other measurements, to the prediction of BW at joining.
Results
The mean concentrations of DM, CP, ADF, NDF, ash and ME for the herbage grazed during winter_1 were 145 (SD 32.3) g/kg, 204 (SD 17.9) g/kg DM, 237 (SD 23.7) g/kg DM, 537 (SD 25.8) g/kg DM and 124 (SD 26.9) g/kg DM, respectively; ME concentration was 10.0 (SD 0.72) MJ/kg DM. Increasing the herbage allowance offered during winter_1 increased the intake of OM (P<0.001) from 0.31 to 0.61 (SEM 0.037) kg/day and reduced the utilization of OM (P<0.001) from 48.6 to 39.2 (SEM 3.13) %. The mean sward height for paddocks assigned to low and high PNs during summer_2 was 4.05 (SD 1.147) and 6.36 (SD 1.048) cm, respectively.
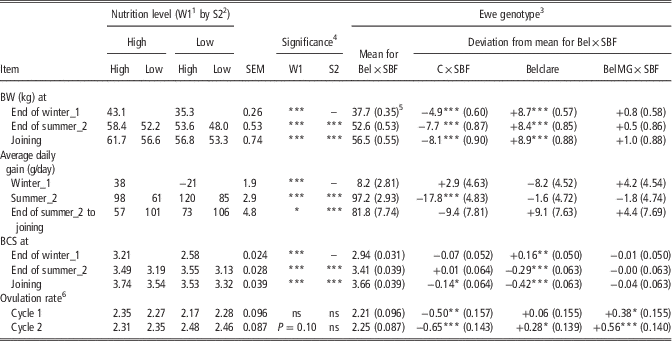
The effects of PN offered during winter_1 and summer_2, and of ewe genotype, on BW, BCS, ADG and ovulation rate are presented in Table 1. There was no significant interaction (P>0.05) between PN offered during the winter_1 and that offered during summer_2 for any variable. Increasing the PN during winter_1 increased BW, BCS and ADG (P<0.001) at the end of winter_1 grazing. Both the high PN during winter_1 and the high PN during summer_2 increased BW, BCS and ADG at the end of summer_2 (P<0.001), and BW and BCS at joining (P<0.001). The ADG between the end of the summer_2 grazing and joining was reduced by high PN in winter_1 (P<0.05) and high PN in summer_2 (P<0.001). Plane of nutrition offered during winter_1 and summer_2 did not affect (P>0.05) ovulation rate.
Effect of plane of nutrition during winter_1 (W1) and summer_2 (S2) and ewe genotype on ewe BW, body condition score and ovulation rate

BCS=body condition score.
1 Late November to late March (12 months old).
2 Late March to late August (17 months old).
3 C×SBF=Charmoise×Scottish Blackface; Bel×SBF=Belclare×SBF; BelMG×SBF=Belclare×SBF that were heterozygous carriers of either FecG H or FecX G mutations.
4 There were no W1×S2 interactions (P>0.05).
5 Standard error.
6 Cycle 1=synchronised oestrus just before joining (19 months old); cycle 2=oestrus immediately following joining.
Relative to the Bel×SBF ewes, C×SBF ewes were significantly lighter (P<0.001) while Bel ewes were significantly heavier (P<0.001) at each weighing time point. Relative to the Bel×SBF, the C×SBF ewes had a lower BCS at joining (P<0.05); the BCS of Bel animals was higher (P<0.01) at the end of the winter_1 but lower (P>0.001) at the end of summer_2 and at joining compared to Bel×SBF. There was no significant difference (P>0.05) between Bel×SBF and BelMG×SBF for BCS or BW at any time point. The C×SBF ewes had a significantly lower ovulation at first (P<0.01) and second (P<0.001) measurements, respectively, than Bel×SBF. Relative to Bel×SBF ewes, Bel ewes had a higher ovulation rate (P<0.05) at cycle 2 whereas BelMG×SBF ewes had a higher ovulation rate at both cycle 1 (P<0.05) and cycle 2 (P<0.001). There was no evidence for any interactions between ewe genotype and treatment for ovulation rate.
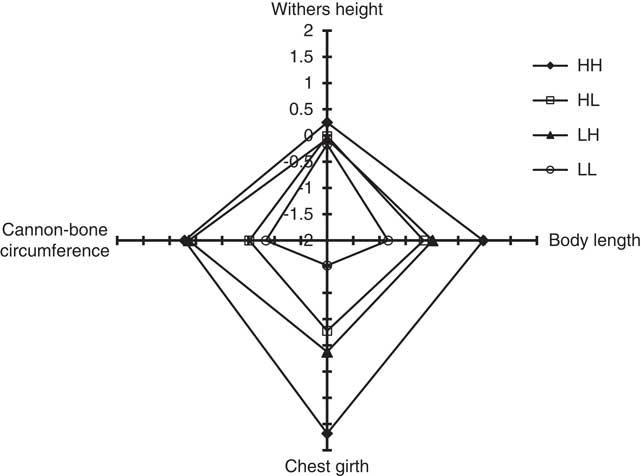
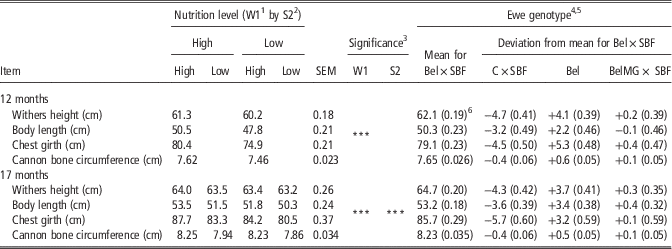
The effects of the PN offered during winter_1 and summer_2, and of ewe genotype, on body size are presented in Table 2. Multivariate analysis of the LMs showed that both winter_1 and summer_2 nutrition significantly affected body size (P<0.001), and that there was no interaction between the effects of winter_1 and summer_2 nutrition for body size at 17 months (P=0.24). The only significant higher-order interaction revealed by these analyses involved the difference between Bel×SBF and C×SBF and the effect of winter_1 treatment on body size at 12 months (P<0.05) and for the same genetic group difference and the interaction between the effects of winter_1 and summer_2 nutritional regimes for body size at 17 months (P<0.01). Increasing the PN during winter_1 increased body size, as indicated by the increases in withers height, body length, chest girth and circumference of the cannon bone at 12 (P<0.001) and 17 (P<0.001) months of age. Body size at 17 months was also increased (P<0.001) by a high PN during summer_2. A summary of the effects of the PN on the individual body measurements at 17 months is presented in Figure 1; these data show that the major contributor to differences in body size was chest girth, followed by length and circumference of the cannon bone. Plane of nutrition offered during the summer_2 was the major source of treatment differences in circumference of the cannon bone. Meanwhile body length and chest girth were equally affected by the PN offered during the winter_1 and summer_2 treatment periods. Effects of PN on withers height were minor. The body size of Bel×SBF and C×SBF differed significantly (P<0.001) at 12 and 17 months of age. Likewise the difference between Bel and the mean of Bel×SBF and BelMG×SBF was significant at both age time points (P<0.001). The differences between Bel×SBF and BelMG×SBF were not significant (P>0.05) at any time.
Summary of the effect of plane of nutrition offered during winter_1 and summer_2 on body measurements of ewes at 17 months; all variables are expressed in SD units. HH, HL, LH, LL: the first letter in each pair signifies level of nutrition (H=high, L=low) during winter_1 (late November to late March) and the second letter signifies level of nutrition (H=high, L=low) during summer_2 (late March to late August).

Effect of plane of nutrition offered to replacement ewes during winter_1 (W1) and summer_2 (S2), and ewe genotype on linear body measurements

1 Late November to late March (12 months old).
2 Late March to late August (17 months old).
3 From multivariate ANOVA.
4 C×SBF=Charmoise×Scottish Blackface; Bel×SBF=Belclare×SBF; BelMG×SBF=Belclare×SBF that were heterozygous carriers of either FecG H or FecX G mutations
5 Multivariate contrasts - at 12 months: Bel×SBF v. C×SBF (P<0.001); Bel×SBF v. Bel (P<0.001); Bel×SBF v. BelMG×SBF (P=0.01); at 17 months: Bel×SBF v. C×SBF (P<0.001); Bel×SBF v. Bel (P<0.001); Bel×SBF v. BelMG×SBF (P=0.22).
6 Standard error.
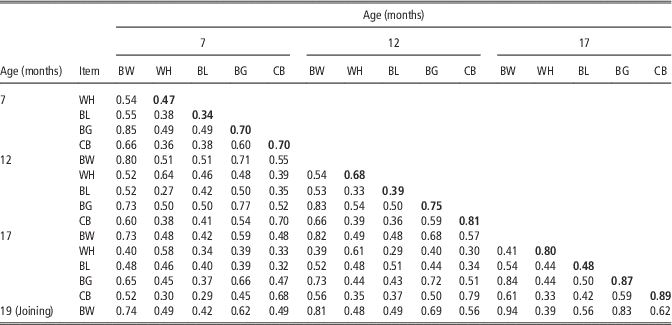
Correlations between the individual body measurements and BW at 7, 12 and 17 months of age, and at joining are presented in Table 3. All of the correlations were positive and highly significant (P<0.001). Inspection of these values shows that all BW measurements were highly inter-correlated (⩾0.8, except for those involving BW at 7 and BW at 17 months or at joining). All of the correlations involving chest girth and BW were of the order of 0.7 or greater with the exception of those involving chest girth at 7 months and BW at later ages, which were of the order of 0.6. The correlations involving measurement of the same trait at consecutive age time points were greatest for BW followed by those for chest girth and circumference of the cannon bone; those for body length were the lowest. The repeatability of LMs on consecutive days is presented in Table 3 for measurements at 7, 12 and 17 months. Repeatability was poorest for measurements at 7 months, but increased with age. Repeatability values were lowest for body length followed by withers height. Chest girth and the circumference of the cannon bone were the most repeatable measures at all time points.
Correlation coefficientsFootnote 1 among ewe BW and linear body measurements, and the repeatabilityFootnote 2 of body measurements at 7, 12 and 17 months of age

WH=withers height; BL=body length; BG=chest girth; CB=cannon bone.
1 All correlations are significant (P<0.001).
2 Shown in bold typeface; all were significant (P<0.001).
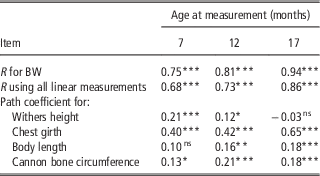
Information on the utility of LMs, and BW, at 7, 12 and 17 months of age as predictors of BW at first joining (19 months of age) is presented in Table 4. At any given age prediction using BW plus the set of LMs was not significantly better than using BW alone. When BW was excluded from consideration prediction based on the set of four LMs delivered over 80% of the predictive power of BW at all time points. The contribution of the individual body measurements to the prediction of BW at joining is represented by the path coefficients shown in Table 4. Chest girth was more important than any other measurement and its explanatory power increased with age at measurement. The explanatory power of height at withers declined to nil at 17 months of age whereas that of body length and the circumference of the cannon bone increased somewhat as age at measurement increased.
Overall summary of the utility of ewe body measurements and BW at 7, 12 and 17 months of age as predictors of BW at first joining (19 months of age)

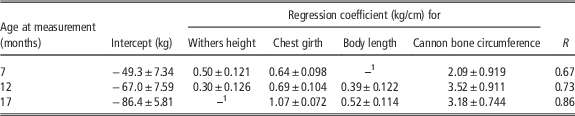
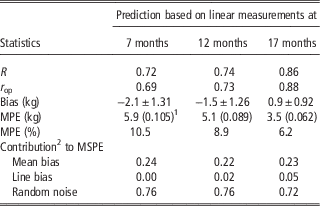
Prediction equations for BW at joining are presented in Table 5 for each age at measurement. The results from the cross-validation analysis of these equations are summarized in Table 6. The average bias in predicted values declined with age at measurement and this was reflected in mean prediction error relative to the observed mean, which declined from 0.105 for the predictions based on measurements at 7 months of age to 0.062 for predictions based on measurements at 17 months. The bias in the prediction using measurements at 17 months is the equivalent of 1.6% of the actual mean BW. The results indicate that only minor improvements were observed in accuracy and precision of predictions when measurements at 12 months of age are compared with those recorded 6 months earlier but a considerable improvement in the prediction was observed when measurements at 17 months of age were used.
Prediction equations for ewe BW (kg) at joining (19 months) based on linear body measurements (cm)

1 Non-significant variables were excluded from the final equations.
Summary statistics from the cross-validation of prediction equations based on linear body measurements of ewes at 7, 12 and 17 months of age

R=multiple correlation coefficient for calibration; r op=correlation between observed and predicted live weights in the validation data set; Bias=mean (actual BW – predicted BW); MPE=mean prediction error; MSPE=mean-square prediction error.
1 Relative to the mean.
2 See Rook et al. (Reference Rook, Dhanoa and Gill1990) for definitions.
Discussion
Results from a previous study on winter nutrition of ewe replacements led to the conclusion (Keady and Hanrahan, Reference Keady and Hanrahan2010) that increasing the allowance of deferred-grazed herbage offered to ewe replacements during their first winter increased BW at around 12 months of age and that compensatory growth during the subsequent grazing season was not sufficient to remove these benefits in BW gain. The herbage offered in the present study had similar CP, ash, ADF and NDF concentrations to those reported by Keady and Hanrahan (Reference Keady and Hanrahan2009a, Reference Keady and Hanrahan2009b, Reference Keady and Hanrahan2012).
Effects of plane of nutrition
Winter_1 nutrition
The utilization rate reported in the current study is similar to those reported for sheep by Keady and Hanrahan (Reference Keady and Hanrahan2009a, Reference Keady and Hanrahan2009b, Reference Keady and Hanrahan2010) but lower than that reported by Keady and Hanrahan (Reference Keady and Hanrahan2012). The low utilization rate in the current study is probably due to the small area allocated daily (reflecting the high herbage mass), the low feed value of the herbage (high-fibre and low-ME concentration), and the prevailing weather conditions (characterized by high rainfall and low evapotranspiration) experienced during the winter months in western Ireland. Herbage utilization rate declined as herbage allowance increased such that only 30% of the additional 1 kg DM offered was utilized. However, forage OM intake increased by 97% due to the increased herbage allowance, thus increasing ADG by 59 g/day. Consequently, ewe replacements offered the high PN were 22% heavier at the end of winter_1 grazing.
Summer_2 nutrition
The significantly greater ADG during summer_2 recorded for ewes that had received the low PN during winter_1 is indicative of compensatory growth. Compensatory growth, after a period of underfeeding, has previously been reported in beef cattle and sheep (Steen, Reference Steen1986; Ryan, Reference Ryan1990; Keady and Hanrahan, Reference Keady and Hanrahan2010). The re-alimentation index (Wilson and Osborn, Reference Wilson and Osbourn1960) was 0.38, showing that the animals offered the higher PN during winter_1 still maintained 62% of their benefit in BW gain after a 152-day summer_2 grazing season.
Whilst the PN offered during the re-alimentation period influenced BW gain, it had little effect on compensatory growth as evidenced by the absence of any interaction between the effects of winter_1 and summer_2 PN. Animals that received the high PN during both winter_1 and summer_2 still maintained 49% of their end-of-winter_1 BW advantage at the end of summer_2. This is consistent with the finding (King et al., Reference King, Watson and Young1959) that over 50% of the advantage from a high plane over low PN, between October and January, was still evident after a 4-month period of high plane feeding for both groups. Purser and Roberts (Reference Purser and Roberts1964) found that hill-ewe replacements wintered off the hill retained 41% of the resulting BW advantage after 6 months common grazing on hill pasture. Similarly, Bradford et al. (Reference Bradford, Weir and Torell1961) reported that 36% of the BW advantage conferred by a high PN, compared with range conditions, between 6 and 14 months was still evident at the end of 4 months grazing on relatively low quality range pasture. Whilst previous authors (reviewed by Ryan (Reference Ryan1990)) have indicated that the degree of compensatory growth is influenced by the degree and duration of restriction, and by the PN during, and duration of, the re-alimentation period, the current results show that ewe replacements in conventional grazing-management systems do not have the opportunity to achieve full compensation. Thus, whilst summer_2 PN significantly affected ADG (61% higher for high plane treatment in the case of animals on the high PN during winter_1) there was no impact on compensatory growth. Furthermore, there was no evidence of an interaction between the winter_1 and summer_2 treatments for ADG during compensatory growth. Bradford et al. (Reference Bradford, Weir and Torell1961) reported that 50% of the increase in BW due to a high PN, from weaning to 16 months of age, was still present 2 years later.
Body size
The effects of winter_1 nutrition on body size at 12 months were still evident at joining. Whilst PN offered during summer_2 was the major source of treatment differences in the circumference of the cannon bone, body length and chest girth were equally affected by the PN offered during the winter_1 and summer_2. The minor effects of nutritional regime on height at withers is consistent with the relatively early maturing character of the long bones (Pálsson and Vergés, Reference Pálsson and Vergés1952). Similarly, Bradford et al. (Reference Bradford, Weir and Torell1961) reported that increasing the PN between weaning and 16 months of age had no effect on withers height but increased chest girth, chest depth and chest width when measured at 17 months. However, Bradford et al. (Reference Bradford, Weir and Torell1961) reported that differences in body size due to the increased PN had disappeared by 28 months. Gunn (Reference Gunn1972) reported that the effects on body size resulting from altering PN between 3 and 6 months of age had disappeared by 19 months of age whereas the effects of altering PN between 6 and 12 months were still evident at 54 months of age.
Pre-joining period
The impact of previous PN on ADG during this period was greater from treatments offered during summer_2. Furthermore the smallest effect due to a previous low PN was exhibited by those animals that had a low PN in winter_1 followed by a high plane during summer_2 – indicating that as the period of re-alimentation progresses the level of compensatory ADG declines. Whilst ADG during the pre-joining period was significantly affected by previous treatment the effect equated to only an additional 0.4 and 1.6 kg for animals offered the low PN during winter_1 and summer_2, respectively.
Ovulation rate
Despite the fact that PN offered during the rearing phases altered BW and BCS at joining by 16% (8.4 kg) and 13% (0.42 units), respectively, without effecting ovulation rate may be partly attributable to the influence of dynamic changes in BCS on ovulation rate. Thus, Gunn (Reference Gunn1983) observed that ewes with condition scores of 2.64 and 3.10 before a 4-week pre-mating period, during which they gained 0.28 and 0.05 BCS units, respectively, had ovulation rates of 2.21 and 2.23 at mating. Furthermore, Hanrahan (Reference Hanrahan1990) reported that a 1 unit change in BCS resulted in an increase of 0.1 in litter size, which would translate into a difference of 0.15 for ovulation rate at a mean litter size of 1.6, using the equation of Hanrahan (Reference Hanrahan1982). Thus, a change of 0.4 in BCS would be expected to result in a relatively small change (<0.06) in ovulation rate.
Effects of ewe genotype
Body weight at joining differed among genotypes by up to 35% compared with differences of 19%, 14% and 15% reported by Hanrahan (Reference Hanrahan1994), Annett et al. (Reference Annett, Carson, Dawson, Irwin and Kilpatrick2011) and Hanrahan and Keady (Reference Hanrahan, Gregan, Mulsant, Mullen, Davis, Powell and Galloway2014), respectively. The difference in BW between Bel×SBF and C×SBF is similar to that reported by Hanrahan and Keady (Reference Hanrahan, Gregan, Mulsant, Mullen, Davis, Powell and Galloway2014). The mature BW of Belclare ewes is ~78 kg, being ~10 kg greater than that of Bel×SBF ewes (Hanrahan, unpublished). The difference in BW between ewe genotypes was reflected in the differences in linear body measurements.
The Belclare breed was developed from a range of genetic resources (Hanrahan Reference Hanrahan1997) and has a litter size of about 2.2 under typical management conditions, and Belclare-cross ewes have been shown to have a higher prolificacy than a wide selection of other crossbred types (Hanrahan, Reference Hanrahan1994; Hanrahan and Keady, Reference Hanrahan, Gregan, Mulsant, Mullen, Davis, Powell and Galloway2014). The range in ovulation rate among the genotypes in the present study was 1.65 to 2.70. When expressed relative to the Bel×SBF group the lower ovulation rate (−0.58) of the C×SBF ewes recorded in the current study is consistent with the reduction in litter size (−0.36) reported previously (Hanrahan and Keady, Reference Hanrahan, Gregan, Mulsant, Mullen, Davis, Powell and Galloway2014).
Hanrahan et al. (Reference Hanrahan and O’Malley2004) reported that heterozygous carriers of the FecG H and FecX G mutations exhibit an increasing ovulation rate of the order of 0.7 and 1.1, respectively, over non carriers. The majority of the BelMG×SBF ewes in the present study were heterozygous for the FecG H so the expected increase in ovulation rate relative to Bel×SBF was of the order of 0.8, which is somewhat greater than the effect (+0.56) observed at cycle 2 in the present study. The smaller difference observed may be partly due to the fact that the present data refer to 19-month-old ewes as Hanrahan et al. (Reference Hanrahan and O’Malley2004) noted that the effect on ovulation rate was smaller in ewe lambs than in adult animals.
Body size
The observed increase in body size with age was influenced by both PN and ewe genotype, and the change differed depending on the measurement involved and age at measurement. All body measurements were positively inter-correlated; the strongest correlation at each measurement time point was that between chest girth and cannon bone circumference. Furthermore, the strongest correlation between the same body measurements at different ages was for the circumference of the cannon bone, followed by chest girth. Previous authors have used body measurements to predict BW of cattle (Heinrichs et al., Reference Heinrichs, Rogers and Cooper1992) and sheep (Cam et al., Reference Cam, Olfaz and Soydan2010). In the current study chest girth exhibited the highest correlation with BW at each time of measurement. Similarly, Heinrichs et al. (Reference Heinrichs, Rogers and Cooper1992), using Holstein heifers, and Cam et al. (Reference Cam, Olfaz and Soydan2010), using sheep, reported that chest girth was the body measurement most highly correlated with BW. The present results are consistent with these studies in that chest girth was the most important factor in equations for the prediction of BW using body measurements at 7, 12 or 17 months of age, followed by circumference of the cannon bone. The prediction equation based on body measurements at 17 months of age had the highest precision and was most accurate, over-predicting BW by 0.9 kg compared with 2.1 and 1.5 kg for equations based on measurements at 7 and 12 months, respectively. For the three equations, similar proportions of the mean-squared prediction error were attributed to bias and random noise.
It is concluded that whilst altering the PN during the rearing phase changed BW by 16% this had no effect on ovulation rate. There was no significant interaction between the PN offered during the winter_1 and summer_2, or between PN and ewe genotype for BW at joining or ovulation rate. Use of body LMs taken at either 7, 12 or 17 months of age can predict BW at joining with satisfactory precision. Definitive conclusions on the effects of PN offered during the rearing phase must await information on the effects of these treatments on ewe performance over their lifetime.
Acknowledgement
The authors acknowledge the technical assistance of N McNamara, T Lally, A Curley and L O'Malley, and thank the farm staff at Athenry for care of the experimental animals.