1 Introduction
Flow over an open rectangular cavity has been a fundamental research topic for decades because of its ubiquitous nature in many engineering settings, including landing gear wells, gaps between plates and aircraft weapon bays (Cattafesta et al. Reference Cattafesta, Song, Williams, Rowley and Alvi2008; Lawson & Barakos Reference Lawson and Barakos2011). In open-cavity flow, a shear layer emanates from the leading edge of the cavity and spans the length of the cavity. The perturbations in the shear layer are amplified through the Kelvin–Helmholtz instability, which introduce large vortical structures that impinge on the aft wall of the cavity creating intense pressure fluctuations and acoustic waves. These waves propagate upstream and induce new disturbances in the shear layer from the leading edge, which forms an acoustic feedback process that can lead to self-sustained oscillations.
The properties of these oscillations can be affected by various parameters including cavity geometry as well as the hydrodynamic and acoustic characteristics of the incoming flow (Rockwell & Naudascher Reference Rockwell and Naudascher1978; Rowley, Colonius & Basu Reference Rowley, Colonius and Basu2002; Lawson & Barakos Reference Lawson and Barakos2011; Sun et al.
Reference Sun, Nair, Taira, Cattafesta, Brès and Ukeiley2014). The early work of Rossiter (Reference Rossiter1964) predicts the two-dimensional (2-D) shear-layer oscillation frequency through a semi-empirical formula based on the free stream Mach number,
 $M_{\infty }$
. Heller & Bliss (Reference Heller and Bliss1975) later modified the formula to better match the experimental measurements. This modified formula is used as reference in the present work. The mode associated with the resonance is referred to as the Rossiter mode and its frequency
 $f_{n}$
can be predicted in terms of the Strouhal number as
 $$\begin{eqnarray}St_{L}=\frac{f_{n}L}{u_{\infty }}=\frac{n-\unicode[STIX]{x1D6FC}}{1/\unicode[STIX]{x1D705}+M_{\infty }/\sqrt{1+(\unicode[STIX]{x1D6FE}-1)M_{\infty }^{2}/2}},\end{eqnarray}$$
where
 $L$
is the length of cavity, empirical constant
 $\unicode[STIX]{x1D705}$
(
 $=0.57$
) is the average convective speed of disturbance in shear layer,
 $\unicode[STIX]{x1D6FC}$
(
 $=0.25$
) (Rossiter Reference Rossiter1964) corresponds to phase delay,
 $\unicode[STIX]{x1D6FE}$
(
 $=1.4$
) is specific heat ratio and
 $n=1,2,\ldots$
leads to the
 $n$
th Rossiter mode. We also define a Strouhal number based on the cavity depth (
 $St_{D}=f_{n}D/u_{\infty }$
) to quantify the frequencies of 3-D modes of open-cavity flows.
The oscillations associated with open-cavity flows are generally undesirable, because they may damage the cavity contents due to the unsteady aerodynamic forces and intense pressure fluctuations. During the past few decades, researchers have developed techniques to suppress the oscillations through various passive and active flow control strategies. A comprehensive review on active control of high Reynolds number cavity flow for a wide range of Mach numbers is given by Cattafesta et al. (Reference Cattafesta, Song, Williams, Rowley and Alvi2008). Both open- and closed-loop control techniques have demonstrated the ability to significantly reduce the pressure fluctuations and noise emission (Samimy et al. Reference Samimy, Kim, Kastner, Adamovich and Utkin2007; Cattafesta et al. Reference Cattafesta, Song, Williams, Rowley and Alvi2008; Lusk, Cattafesta & Ukeiley Reference Lusk, Cattafesta and Ukeiley2012; Zhang et al. Reference Zhang, Sun, Arora, Cattafesta, Taira and Ukeiley2015). However, there has not been a clear control strategy that can be universally applied to open-cavity flows in the most general manner. As the baseline flow changes with different cavity geometry and operating conditions, the current control approaches for suppressing aerodynamic fluctuations have to be tailored for each operating condition and cavity configuration. Although flow control has been applied in some high-speed flows (Cattafesta et al. Reference Cattafesta, Song, Williams, Rowley and Alvi2008; Cattafesta & Sheplak Reference Cattafesta and Sheplak2011), both effective and efficient control of transonic and supersonic cavity flows remains challenging due to a lack of actuator control authority at these flow conditions. Due to the large energy input required for high-speed cavity flows, the control authority is typically insufficient. Moreover, current actuators are characterized by a fixed gain–bandwidth product (Cattafesta & Sheplak Reference Cattafesta and Sheplak2011), which motivates the present study that can shed light on the proper choice of actuation parameters based on intrinsic flow instabilities.
As observed in several studies on cavity flows (Maull & East Reference Maull and East1963; Ahuja & Mendoza Reference Ahuja and Mendoza1995; Arunajatesan et al. Reference Arunajatesan, Barone, Wagner, Casper and Beresh2014; Beresh et al. Reference Beresh, Wagner, Pruett, Henfling and Spillers2015; Beresh, Wagner & Casper Reference Beresh, Wagner and Casper2016; Sun et al. Reference Sun, Zhang, Taira, Cattafesta, George and Ukeiley2016b ), three-dimensionality can affect the dominant oscillation characteristics. Although the three-dimensionality discussed in these experiments and simulations mostly relates to the significance of spanwise end effects on the flow, such end effects can modify spanwise instabilities in the flow. This suggests a potential to control cavity flow with 3-D perturbations. To understand the characteristics of the three-dimensionality in open-cavity flow, 3-D simulations can capture the unsteadiness and structures of steady saturated flow but cannot reveal the instability characteristics directly. However, with the development of numerical techniques, numerical instability analysis of cavity flows has attracted increasing attention during the last decade. In particular, linear stability analysis provides deep insights into the instability mechanisms, as well as physics-based guidelines for effective 3-D control strategies in terms of spatial and temporal parameters needed in flow control designs. Hence, in this paper, the influence of compressibility on characteristics of 2-D and 3-D global instabilities of spanwise-periodic open-cavity flows are examined thoroughly based on linear stability theory.
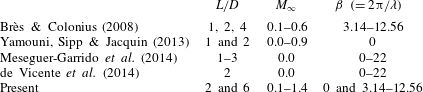
A summary of biglobal stability analysis of laminar open-cavity flows studied in past literature and the present work. Mach number 0 represents incompressible flow.

To analyse the 3-D instabilities of such cavity flows, we utilize biglobal stability theory to identify the properties of the 3-D instabilities associated with a given 2-D base state. The computational cost associated with this analysis is much less compared to the case in which the base state and perturbations are both considered three-dimensional. Hence, it is a widely used technique to specifically examine the spanwise instabilities of 2-D inhomogeneous flows (Theofilis Reference Theofilis2003). In table 1, we summarize past biglobal stability analyses of open-cavity flows. Theofilis & Colonius (Reference Theofilis and Colonius2004) presented the framework of the biglobal stability analysis for compressible open-cavity flows with aspect ratio
 $L/D=2$
and
 $M_{\infty }=0.325$
. Following their work, several researchers reported on instability studies of open-cavity flows using linear instability analysis. Brès & Colonius (Reference Brès and Colonius2008) characterized the onset of 2-D subsonic (
 $0.1\leqslant M_{\infty }\leqslant 0.6$
) cavity flow instabilities at low Reynolds numbers. They also performed 3-D linear simulations on compressible open-cavity flow with
 $L/D=2$
and 4 and identified the spanwise wavelength of the most unstable/least stable modes via examination of the most amplified disturbances with respect to the steady base flow. They found that the 3-D modes have an order-of-magnitude lower frequency than those of the 2-D resonant modes in the cavity, with the wavelength of the most unstable mode being
 $\unicode[STIX]{x1D706}/D\approx 1$
. Yamouni et al. (Reference Yamouni, Sipp and Jacquin2013) performed global stability analysis to investigate the interaction between the feedback aeroacoustic mechanism and acoustic resonance in the flow over a cavity with
 $L/D=1$
. Moreover, de Vicente et al. (Reference de Vicente, Basley, Meseguer-Garrido, Soria and Theofilis2014) conducted global stability analysis on incompressible open-cavity flows and observed that 3-D instability modes can split into different branches depending on their spanwise wavelengths. They also compared their numerical results to experiments and reported that their numerical results resembled the fully saturated nonlinear flow features seen in experiments. Considering lateral wall effects on the 3-D structures present in finite-span cavity flows, Liu, Gómez & Theofilis (Reference Liu, Gómez and Theofilis2016) performed triglobal instability analysis to unravel the transition of steady laminar flow over a three-dimensional cavity for incompressible flow. All of these studies provide insights into the characteristics of spanwise instabilities associated with open-cavity flows. Nonetheless, there is still a gap in the literature with respect to instabilities of open-cavity flow in the transonic regime. Moreover, the instabilities of flows over the cavities with large
 $L/D=6$
, which are particularly relevant in aircraft bays, have been rarely studied. Furthermore, 3-D flow control strategies applied to realistic compressible open-cavity flows (Lusk et al.
Reference Lusk, Cattafesta and Ukeiley2012; George et al.
Reference George, Ukeiley, Cattafesta and Taira2015; Zhang et al.
Reference Zhang, Sun, Arora, Cattafesta, Taira and Ukeiley2015) are functions of spanwise wavelength and Mach number, for which the present work can offer insights.
One of the objectives of this paper is to perform 2-D direct numerical simulation (DNS) of flows over rectangular cavities with
 $L/D=2$
and 6 to characterize the effects of free stream Mach number
 $M_{\infty }$
, Reynolds number
 $Re_{\unicode[STIX]{x1D703}}$
and aspect ratio
 $L/D$
on the 2-D flow instabilities. Furthermore, the stable/unstable steady states obtained from 2-D simulations serve as base states in the biglobal stability analysis to reveal characteristics of 2-D (
 $\unicode[STIX]{x1D706}/D=\infty$
) and 3-D (
 $\unicode[STIX]{x1D706}/D=0.5{-}2.0$
) eigenmodes associated with the flows. In the linear stability analysis component of this study, 2-D and 3-D global eigenmodes are identified for
 $M_{\infty }=0.3{-}1.4$
and
 $L/D=2$
, 6. These global eigenmodes are also compared to the flow fields from the 2-D and 3-D nonlinear simulations. We will show that most of the linear stability predictions of flow properties are in a good agreement to those captured from the nonlinear flows, which could serve a foundation for parameter choice in flow control designs.
In what follows, the computational approach and numerical validation are presented in § 2. In § 3, the characteristics of the 2-D instabilities in open-cavity flows are investigated via DNS. With the stable/unstable steady states obtained from 2-D DNS, 2-D eigenmodes captured via biglobal stability analysis are discussed and compared to the flow characteristics revealed in the nonlinear simulations in § 4.1. Furthermore, 3-D eigenmodes with specified spanwise wavelengths are examined in § 4.2, in which the instabilities of 3-D modes show significant dependence on Mach number and spanwise wavelength. A comparison of the results from the DNS and biglobal stability analysis is provided in § 4.2. Finally, concluding remarks are offered in § 5.
2 Computational approach
2.1 Direct numerical simulation set-up and validation
Two-dimensional DNS of compressible flows over a rectangular cavity are performed using a high-fidelity compressible flow solver CharLES (Khalighi et al.
Reference Khalighi, Ham, Moin, Lele, Schlinker, Reba and Simonich2011a
,Reference Khalighi, Nichols, Ham, Lele and Moin
b
; Brès et al.
Reference Brès, Ham, Nichols and Lele2017) to solve the full compressible Navier–Stokes equations. A second-order finite-volume method and the third-order Runge–Kutta temporal scheme are implemented. The Harten–Lax–van Leer contact (HLLC) scheme is used to capture the shocks formed in supersonic flow (Toro Reference Toro2009). The variables including the spatial coordinate
 $x_{i}$
, time
 $t$
, density
 $\unicode[STIX]{x1D70C}$
, velocity
 $u_{i}$
, energy
 $e$
, pressure
 $P$
, temperature
 $T$
, are non-dimensionalized as
 $$\begin{eqnarray}\displaystyle & \displaystyle x_{i}=\frac{{x_{i}}^{d}}{D^{d}},\quad t=\frac{t^{d}a_{\infty }^{d}}{D^{d}},\quad \unicode[STIX]{x1D70C}=\frac{\unicode[STIX]{x1D70C}^{d}}{\unicode[STIX]{x1D70C}_{\infty }^{d}},\quad u_{i}=\frac{{u_{i}}^{d}}{a_{\infty }^{d}},\quad e=\frac{e^{d}}{\unicode[STIX]{x1D70C}_{\infty }^{d}(a_{\infty }^{d})^{2}},\quad P=\frac{P^{d}}{\unicode[STIX]{x1D6FE}P_{\infty }^{d}},\quad T=\frac{T^{d}}{T_{\infty }^{d}}, & \displaystyle \nonumber\\ \displaystyle & & \displaystyle\end{eqnarray}$$
where variables with superscript
 $d$
refer to the dimensional quantities and those with the subscript
 $\infty$
denote the free stream values. The
 $x$
-,
 $y$
- and
 $z$
-directions represent the streamwise, wall-normal and spanwise directions, respectively. A structured mesh with non-uniform spacing in both
 $x$
- and
 $y$
-directions is used for the simulations. Cavity flows are specified by
 $L/D$
, where
 $L$
and
 $D$
represent the length and depth of the cavity, respectively, initial boundary layer momentum thickness
 $\unicode[STIX]{x1D703}_{0}$
at the leading edge of the cavity and free stream Mach number
 $M_{\infty }\equiv u_{\infty }^{d}/a_{\infty }^{d}$
. The free stream sonic speed is denoted by
 $a_{\infty }^{d}$
. The Reynolds number based on the initial momentum boundary layer thickness
 $\unicode[STIX]{x1D703}_{0}$
and the Prandtl number are respectively defined as
 $$\begin{eqnarray}\displaystyle & \displaystyle Re_{\unicode[STIX]{x1D703}}\equiv \frac{\unicode[STIX]{x1D70C}_{\infty }u_{\infty }\unicode[STIX]{x1D703}_{0}}{\unicode[STIX]{x1D707}_{\infty }}\quad \text{and}\quad Pr\equiv \frac{c_{p}\unicode[STIX]{x1D707}_{\infty }}{k}, & \displaystyle\end{eqnarray}$$
where
 $\unicode[STIX]{x1D707}_{\infty }$
is the dynamic viscosity,
 $c_{p}$
is the specific heat and
 $k$
is the thermal conductivity.
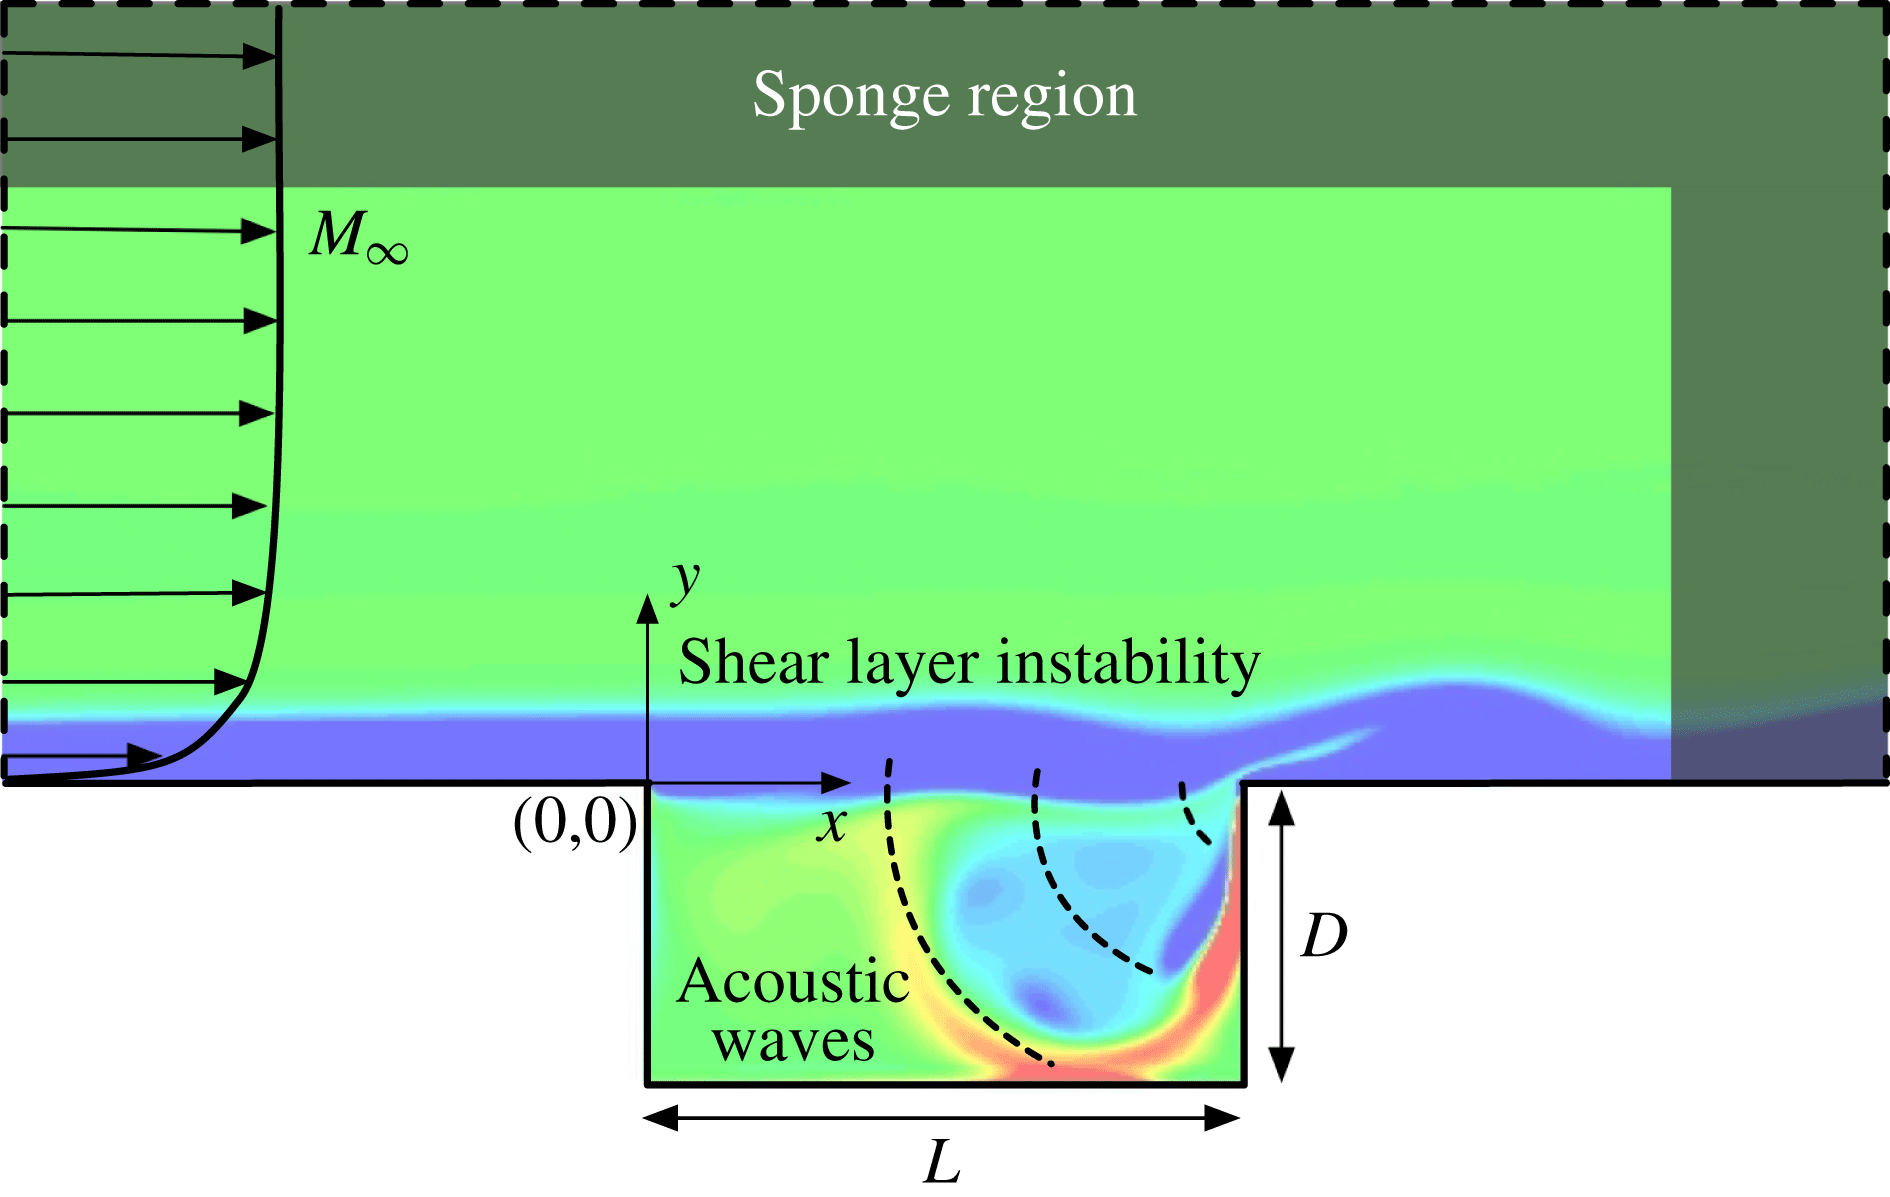
Computational set-up for open-cavity flow (not to scale).

In the present investigation, we consider two-dimensional cavities with
 $L/D=2$
and 6. The former geometry serves as the basis for comparison with those reported in the literature, while the latter is representative of a prototypical cavity application on aircraft. As illustrated in figure 1, the origin is placed at the leading edge of the cavity. The initial momentum boundary layer thickness
 $\unicode[STIX]{x1D703}_{0}$
is prescribed at the leading edge, and the distance between the upstream wall boundary and the leading edge is adjusted accordingly for the chosen
 $Re_{\unicode[STIX]{x1D703}}$
. The outflow boundary is placed
 $7D$
from the trailing edge of the cavity. The normal distance from the cavity surface to the top boundary of the computational domain is maintained at
 $9D$
. The size of computational domain follows the work of Colonius, Basu & Rowley (Reference Colonius, Basu and Rowley1999), in which they studied the effects of the computational domain on the flows and identified the appropriate size of the domain. No-slip and adiabatic boundary conditions are specified at the upstream and downstream floors as well as the walls of the cavity. To damp out exiting acoustic waves and wake structures, sponge zones (Freund Reference Freund1997) are applied to the outlet and top boundaries spanning a length of
 $2D$
from computational boundaries. The computational domain for three-dimensional DNS extends the two-dimensional set-up with spanwise periodicity for a width-to-depth ratio of
 $W/D=2$
(which is suitable for
 $\unicode[STIX]{x1D706}/D\leqslant 2$
) with 64 grid points spaced uniformly in the spanwise direction.
The effect of Mach number is analysed from the subsonic regime to the transonic regime with Reynolds number
 $Re_{\unicode[STIX]{x1D703}}$
from 5 to 144 for flows over cavities with
 $L/D=2$
and 6. To initialize the flow field, an incompressible Blasius boundary layer profile is imposed over the entire computational domain above the floor, while the flow inside the cavity is set to be quiescent. Consistent with the chosen Reynolds number range of this study, the incompressible Blasius boundary layer profile is utilized as the variation in boundary layer thickness for the range of Mach numbers from
 $0$
to
 $1.4$
is less than
 $10\,\%$
(White Reference White1991). As the Blasius profile is characterized by the momentum boundary layer thickness, we fix the ratio of the cavity depth to the initial momentum thickness
 $D/\unicode[STIX]{x1D703}_{0}=26.4$
for all the cases considered in the present study.
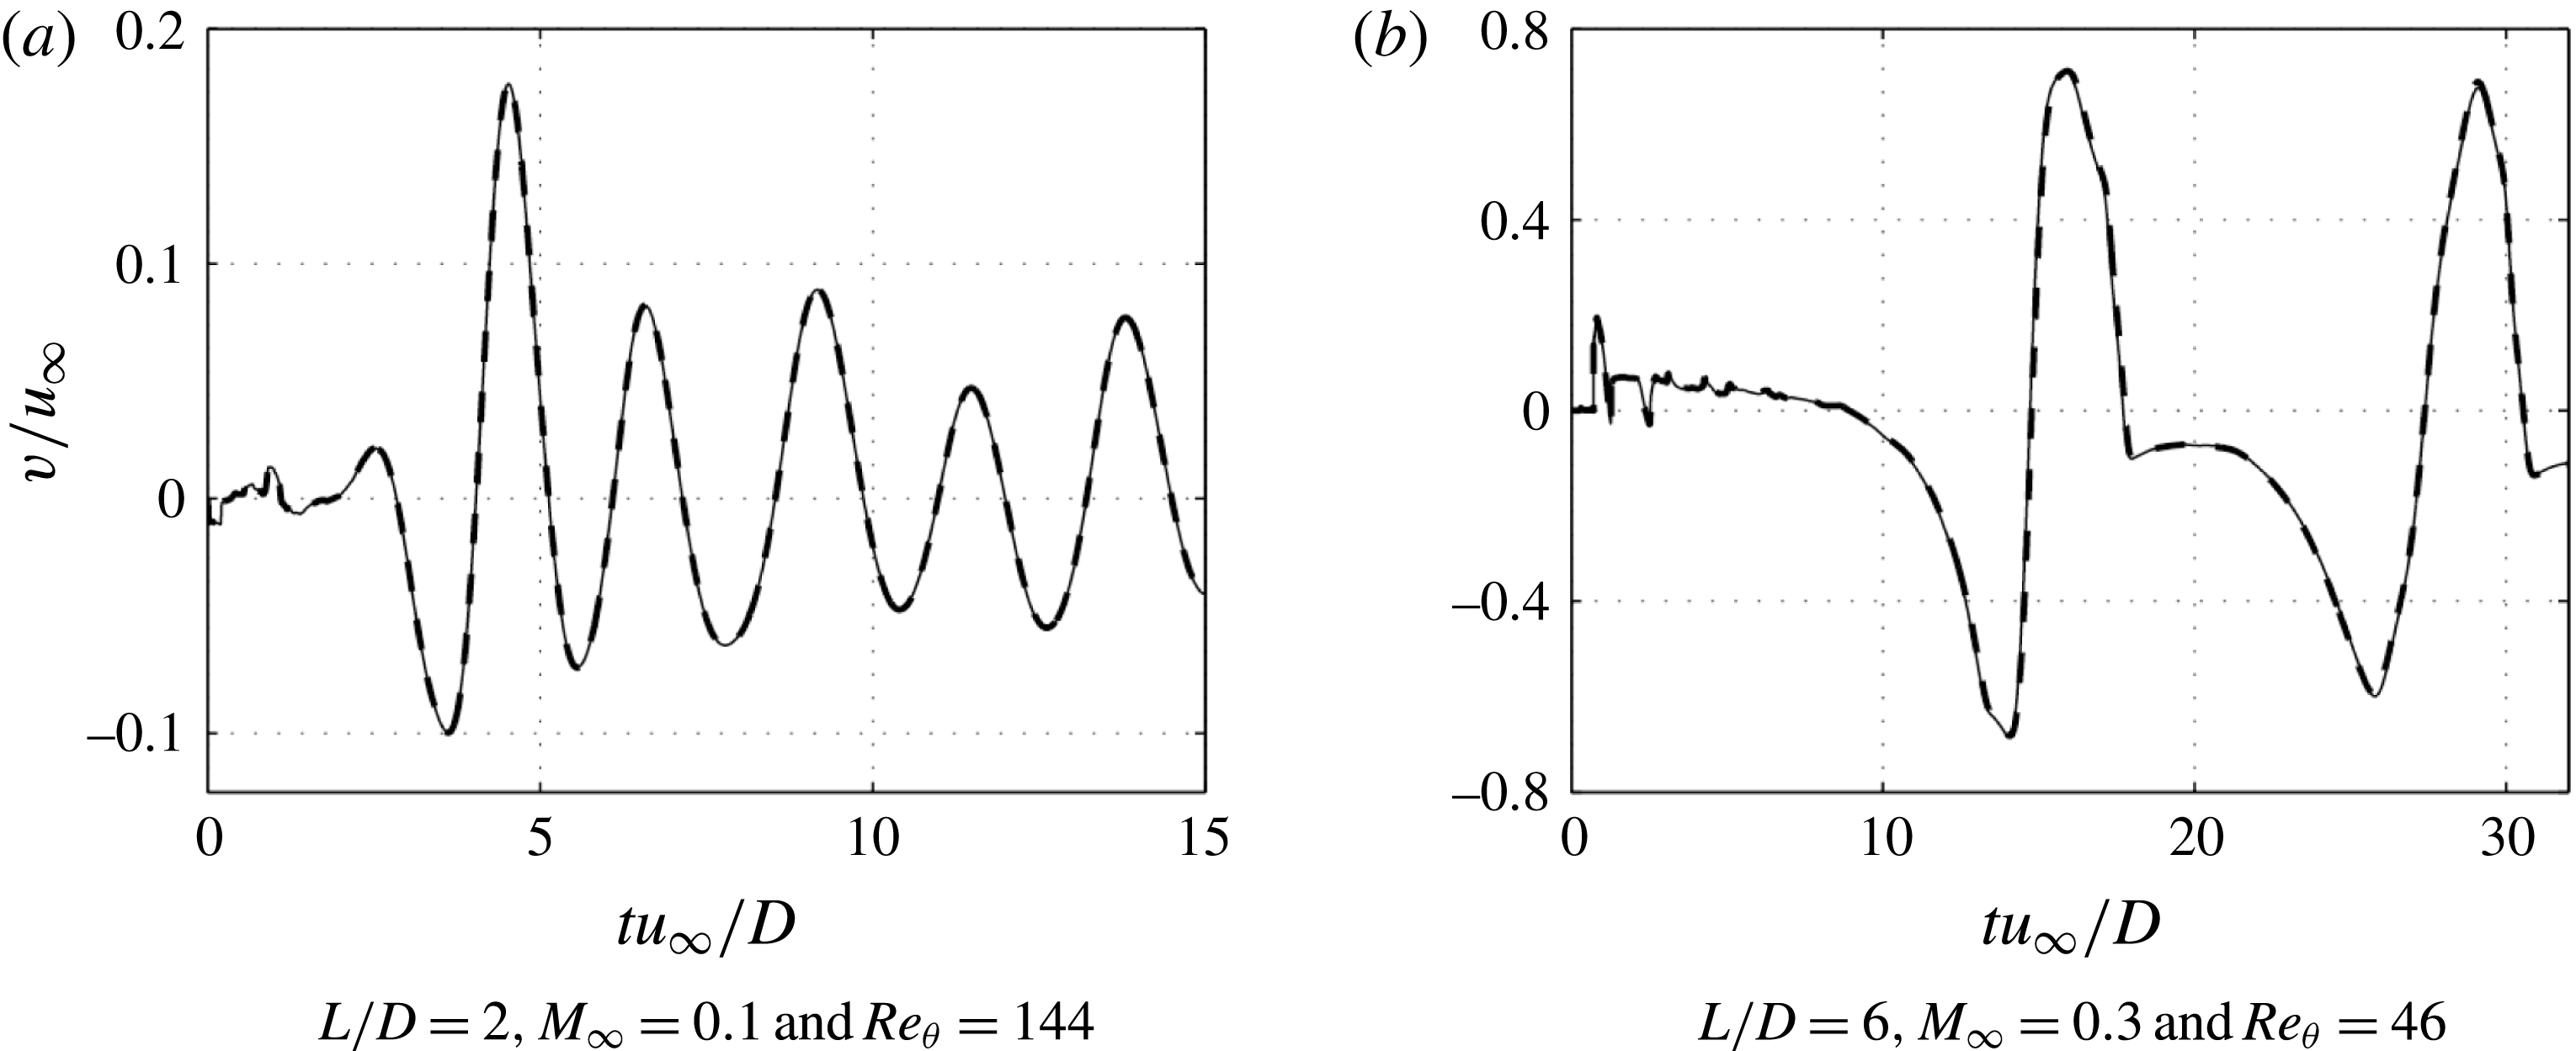
A grid convergence study for both rectangular cavity geometries (
 $L/D=$
2 and 6) is performed. Presented in figure 2 are two grid convergence comparisons performed with
 $Re_{\unicode[STIX]{x1D703}}=144$
and
 $M_{\infty }=0.1$
for
 $L/D=2$
and
 $Re_{\unicode[STIX]{x1D703}}=46$
and
 $M_{\infty }=0.3$
for
 $L/D=6$
. The baseline computation is conducted on a structured mesh with approximately half a million grid points. A finer mesh with one million grid points is also performed for comparison. The
 $v$
-velocity history at the midpoint location (
 $x=L/2$
,
 $y=0$
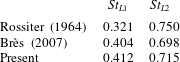
) over the cavity is shown in figure 2. The baseline mesh of half a million grid points is shown to be sufficient to achieve numerical convergence. Moreover, the frequencies of the oscillations in the flow for
 $L/D=2$
,
 $Re_{\unicode[STIX]{x1D703}}=56.8$
and
 $M_{\infty }=0.6$
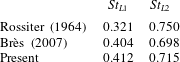
are compared to the prediction from Rossiter’s semi-empirical formula and the work by Brès (Reference Brès2007) in table 2, exhibiting good agreement.
Comparison of the
 $v$
-velocity at the midpoint (
 $x=L/2$
,
 $y=0$
) of the cavity. The solid line shows the baseline case with half a million grid points and the dashed line represents the refined case with 1.1 million grid points.

Comparison of Rossiter modes I and II frequencies for open-cavity flow with
 $L/D=2$
,
 $Re_{\unicode[STIX]{x1D703}}=56.8$
and
 $M_{\infty }=0.6$
.
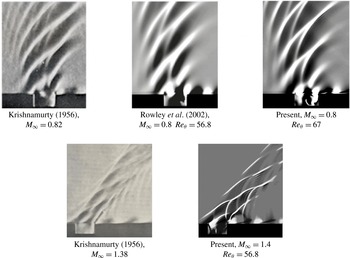
Furthermore, instantaneous density gradient flow fields at
 $M_{\infty }=0.8$
and 1.4 are compared to the experimental schlieren images by Krishnamurty (Reference Krishnamurty1956) and numerical results by Rowley et al. (Reference Rowley, Colonius and Basu2002) in figure 3. In the experiments conducted by Krishnamurty (Reference Krishnamurty1956), the cavity width is almost
 $40$
times the depth (
 $W/D\approx 40$
). Hence, the results from this experimental study can be regarded as approximately two-dimensional. As shown in figure 3, the present results exhibit good agreement with the experiments and previous simulation results. For
 $M_{\infty }=0.8$
, the acoustic waves generated at the trailing edge of cavity propagate upstream, and for the
 $M_{\infty }=1.4$
case, the acoustic wave structures are aligned in an oblique manner. Further analysis of the open-cavity flow features are provided in § 3.
Comparison of schlieren images by Krishnamurty (Reference Krishnamurty1956), DNS by Rowley et al. (Reference Rowley, Colonius and Basu2002) (reproduced with permission from Cambridge University Press) and the present work (
 $\unicode[STIX]{x2202}\unicode[STIX]{x1D70C}/\unicode[STIX]{x2202}x$
) at
 $M_{\infty }=0.8$
and 1.4.

2.2 Biglobal stability analysis set-up and validation
Biglobal stability analysis is performed with respect to the base flow obtained from the 2-D nonlinear simulation to uncover the compressible spanwise-periodic global instabilities. The state vector
 $\boldsymbol{q}=[\unicode[STIX]{x1D70C},\unicode[STIX]{x1D70C}u,\unicode[STIX]{x1D70C}v,\unicode[STIX]{x1D70C}w,e]^{\text{T}}$
is decomposed into base state
 $\bar{\boldsymbol{q}}(x,y)$
and perturbations
 $\boldsymbol{q}^{\prime }(x,y,z,t)$
as
 $$\begin{eqnarray}\boldsymbol{q}(x,y,z,t)=\bar{\boldsymbol{q}}(x,y)+\boldsymbol{q}^{\prime }(x,y,z,t).\end{eqnarray}$$
The steady solution (base state)
 $\bar{\boldsymbol{q}}$
satisfies the Navier–Stokes equations and
 $\boldsymbol{q}^{\prime }$
is small in its magnitude compared to the base state (
 $|\boldsymbol{q}^{\prime }|\ll |\bar{\boldsymbol{q}}|$
). In the present work, the base state
 $\bar{\boldsymbol{q}}$
, obtained from the 2-D DNS, is either a time-invariant stable state or an unstable steady state calculated by the selective frequency damping method (Åkervik et al.
Reference Åkervik, Brandt, Henningson, Hœpffner, Marxen and Schlatter2006). By substituting (2.3) into the Navier–Stokes equations and the equation of state, the governing equations are linearized by retaining only the linear terms of
 $\boldsymbol{q}^{\prime }$
which yields the following set of linear equations for
 $\boldsymbol{q}^{\prime }$
 $$\begin{eqnarray}\left.\begin{array}{@{}l@{}}\displaystyle \frac{\unicode[STIX]{x2202}\unicode[STIX]{x1D70C}^{\prime }}{\unicode[STIX]{x2202}t}+\frac{\unicode[STIX]{x2202}}{\unicode[STIX]{x2202}x_{j}}(\unicode[STIX]{x1D70C}^{\prime }\bar{u}_{j}+\bar{\unicode[STIX]{x1D70C}}u_{j}^{\prime })=0,\\ \displaystyle \frac{\unicode[STIX]{x2202}}{\unicode[STIX]{x2202}t}(\unicode[STIX]{x1D70C}^{\prime }\bar{u}_{i}+\bar{\unicode[STIX]{x1D70C}}u_{i}^{\prime })+\frac{\unicode[STIX]{x2202}}{\unicode[STIX]{x2202}x_{j}}(\bar{\unicode[STIX]{x1D70C}}\bar{u}_{i}u_{j}^{\prime }+\bar{\unicode[STIX]{x1D70C}}u_{i}^{\prime }\bar{u}_{j}+\unicode[STIX]{x1D70C}^{\prime }\bar{u}_{i}\bar{u}_{j}+P^{\prime }\unicode[STIX]{x1D6FF}_{ij})\\ \displaystyle \quad =\frac{1}{Re}\frac{\unicode[STIX]{x2202}}{\unicode[STIX]{x2202}x_{j}}\left(\frac{\unicode[STIX]{x2202}u_{i}^{\prime }}{\unicode[STIX]{x2202}x_{j}}+\frac{\unicode[STIX]{x2202}u_{j}^{\prime }}{\unicode[STIX]{x2202}x_{i}}-\frac{2}{3}\frac{\unicode[STIX]{x2202}u_{k}^{\prime }}{\unicode[STIX]{x2202}x_{k}}\unicode[STIX]{x1D6FF}_{ij}\right),\\ \displaystyle \frac{\unicode[STIX]{x2202}e^{\prime }}{\unicode[STIX]{x2202}t}+\frac{\unicode[STIX]{x2202}}{\unicode[STIX]{x2202}x_{j}}\left[(\bar{e}+\bar{P})u_{j}^{\prime }+(e^{\prime }+P^{\prime })\bar{u}_{j}\right]\\ \displaystyle \quad =\frac{1}{Re}\frac{\unicode[STIX]{x2202}}{\unicode[STIX]{x2202}x_{j}}\left[\bar{u}_{i}\left(\frac{\unicode[STIX]{x2202}u_{i}^{\prime }}{\unicode[STIX]{x2202}x_{j}}+\frac{\unicode[STIX]{x2202}u_{j}^{\prime }}{\unicode[STIX]{x2202}x_{i}}-\frac{2}{3}\frac{\unicode[STIX]{x2202}u_{k}^{\prime }}{\unicode[STIX]{x2202}x_{k}}\unicode[STIX]{x1D6FF}_{ij}\right)+u_{i}^{\prime }\left(\frac{\unicode[STIX]{x2202}\bar{u}_{i}}{\unicode[STIX]{x2202}x_{j}}+\frac{\unicode[STIX]{x2202}\bar{u}_{j}}{\unicode[STIX]{x2202}x_{i}}-\frac{2}{3}\frac{\unicode[STIX]{x2202}\bar{u}_{k}}{\unicode[STIX]{x2202}x_{k}}\unicode[STIX]{x1D6FF}_{ij}\right)\right]\\ \displaystyle \qquad +\,\frac{1}{Re}\frac{1}{Pr}\frac{\unicode[STIX]{x2202}^{2}T^{\prime }}{\unicode[STIX]{x2202}x_{k}\unicode[STIX]{x2202}x_{k}}\end{array}\right\}\end{eqnarray}$$
along with the linearized equation of state
 $$\begin{eqnarray}P^{\prime }=R(\unicode[STIX]{x1D70C}^{\prime }\bar{T}+\bar{\unicode[STIX]{x1D70C}}T^{\prime }),\end{eqnarray}$$
where
 $R$
is the gas constant.
The above linear governing equations permit modal perturbations of the form
 $$\begin{eqnarray}\boldsymbol{q}^{\prime }(x,y,z,t)=\hat{\boldsymbol{q}}(x,y)\text{e}^{\text{i}(\unicode[STIX]{x1D6FD}z-\unicode[STIX]{x1D714}t)}+\text{complex conjugate}.\end{eqnarray}$$
Upon substitution of this modal expression into the linearized Navier–Stokes equations (2.4), we can transform the instability analysis from solving an initial value problem to an eigenvalue problem of
 $$\begin{eqnarray}{\mathcal{A}}(\bar{\boldsymbol{q}};\unicode[STIX]{x1D6FD})\hat{\boldsymbol{q}}=\unicode[STIX]{x1D714}\hat{\boldsymbol{q}}.\end{eqnarray}$$
Temporal instability is examined by inserting a real wavenumber
 $\unicode[STIX]{x1D6FD}$
with its corresponding wavelength
 $\unicode[STIX]{x1D706}/D=2\unicode[STIX]{x03C0}/\unicode[STIX]{x1D6FD}$
. The corresponding eigenmodes consist of eigenvectors
 $\hat{\boldsymbol{q}}(x,y)=\hat{\boldsymbol{q}}_{r}(x,y)+\text{i}\hat{\boldsymbol{q}}_{i}(x,y)$
and their complex eigenvalues
 $\unicode[STIX]{x1D714}=\unicode[STIX]{x1D714}_{r}+\text{i}\unicode[STIX]{x1D714}_{i}$
, where
 $\hat{\boldsymbol{q}}_{r}$
and
 $\hat{\boldsymbol{q}}_{i}$
represent real and imaginary components of eigenvectors;
 $\unicode[STIX]{x1D714}_{r}$
and
 $\unicode[STIX]{x1D714}_{i}$
are the modal frequency and growth (
 $\unicode[STIX]{x1D714}_{i}>0$
) or decay (
 $\unicode[STIX]{x1D714}_{i}<0$
) rate, respectively. While solving for the eigenmodes, the linear operator
 ${\mathcal{A}}\in \mathbb{C}^{5n\times 5n}$
and eigenvector
 $\hat{\boldsymbol{q}}\in \mathbb{C}^{5n}$
for
 $n=O(10^{6})$
grid points, can become extremely large. For this large-scale eigenvalue problem, the ARPACK library (Sorensen et al. Reference Sorensen, Lehoucq, Yang and Maschhoff1996–2008), with an implicitly restarted Arnoldi method, is used in the current study to solve for the eigenmodes. The present approach is based on a matrix-free computation. Since the linear governing equations for the perturbation variables are explicit in their forms, we use the regular mode (not shift-and-invert transformation) in ARPACK and only provide the matrix vector products
 $A(\bar{q};\unicode[STIX]{x1D6FD})\hat{q}$
repeatedly to the solver, which avoids requesting large memory space to store matrix entries while solving the eigenvalue problem. All the eigenmodes reported in this paper are converged with
 $\Vert \unicode[STIX]{x1D714}\hat{q}-A\hat{q}\Vert \leqslant O(10^{-10})$
. Along the cavity walls, velocity perturbations and the wall-normal gradient of pressure perturbation are set to zero. According to the governing equations, the boundary condition for density perturbation is not required because the momentum perturbation flux is zero due to zero velocity along the wall. For the inlet, density and velocity perturbations, as well as the pressure gradient, are prescribed to be zero. For the outflow and far field boundaries, gradients of density, velocity and pressure are prescribed as zero. Moreover, an adiabatic condition is assumed for all boundaries. The base state is interpolated on a coarse mesh for the eigenvalue problem (Bergamo et al.
Reference Bergamo, Gennaro, Theofilis and Medeiros2015). An investigation of domain size was conducted to assure the convergence of eigenspectrum. A grid resolution study was performed to ensure accurate stability results. Additional details on the computational procedures can be found in Sun et al. (Reference Sun, Taira, Cattafesta and Ukeiley2016a
).
The validation of global instability analysis is performed on the flow at
 $M_{\infty }=0.3$
and
 $Re_{\unicode[STIX]{x1D703}}=56.8$
with
 $L/D=2$
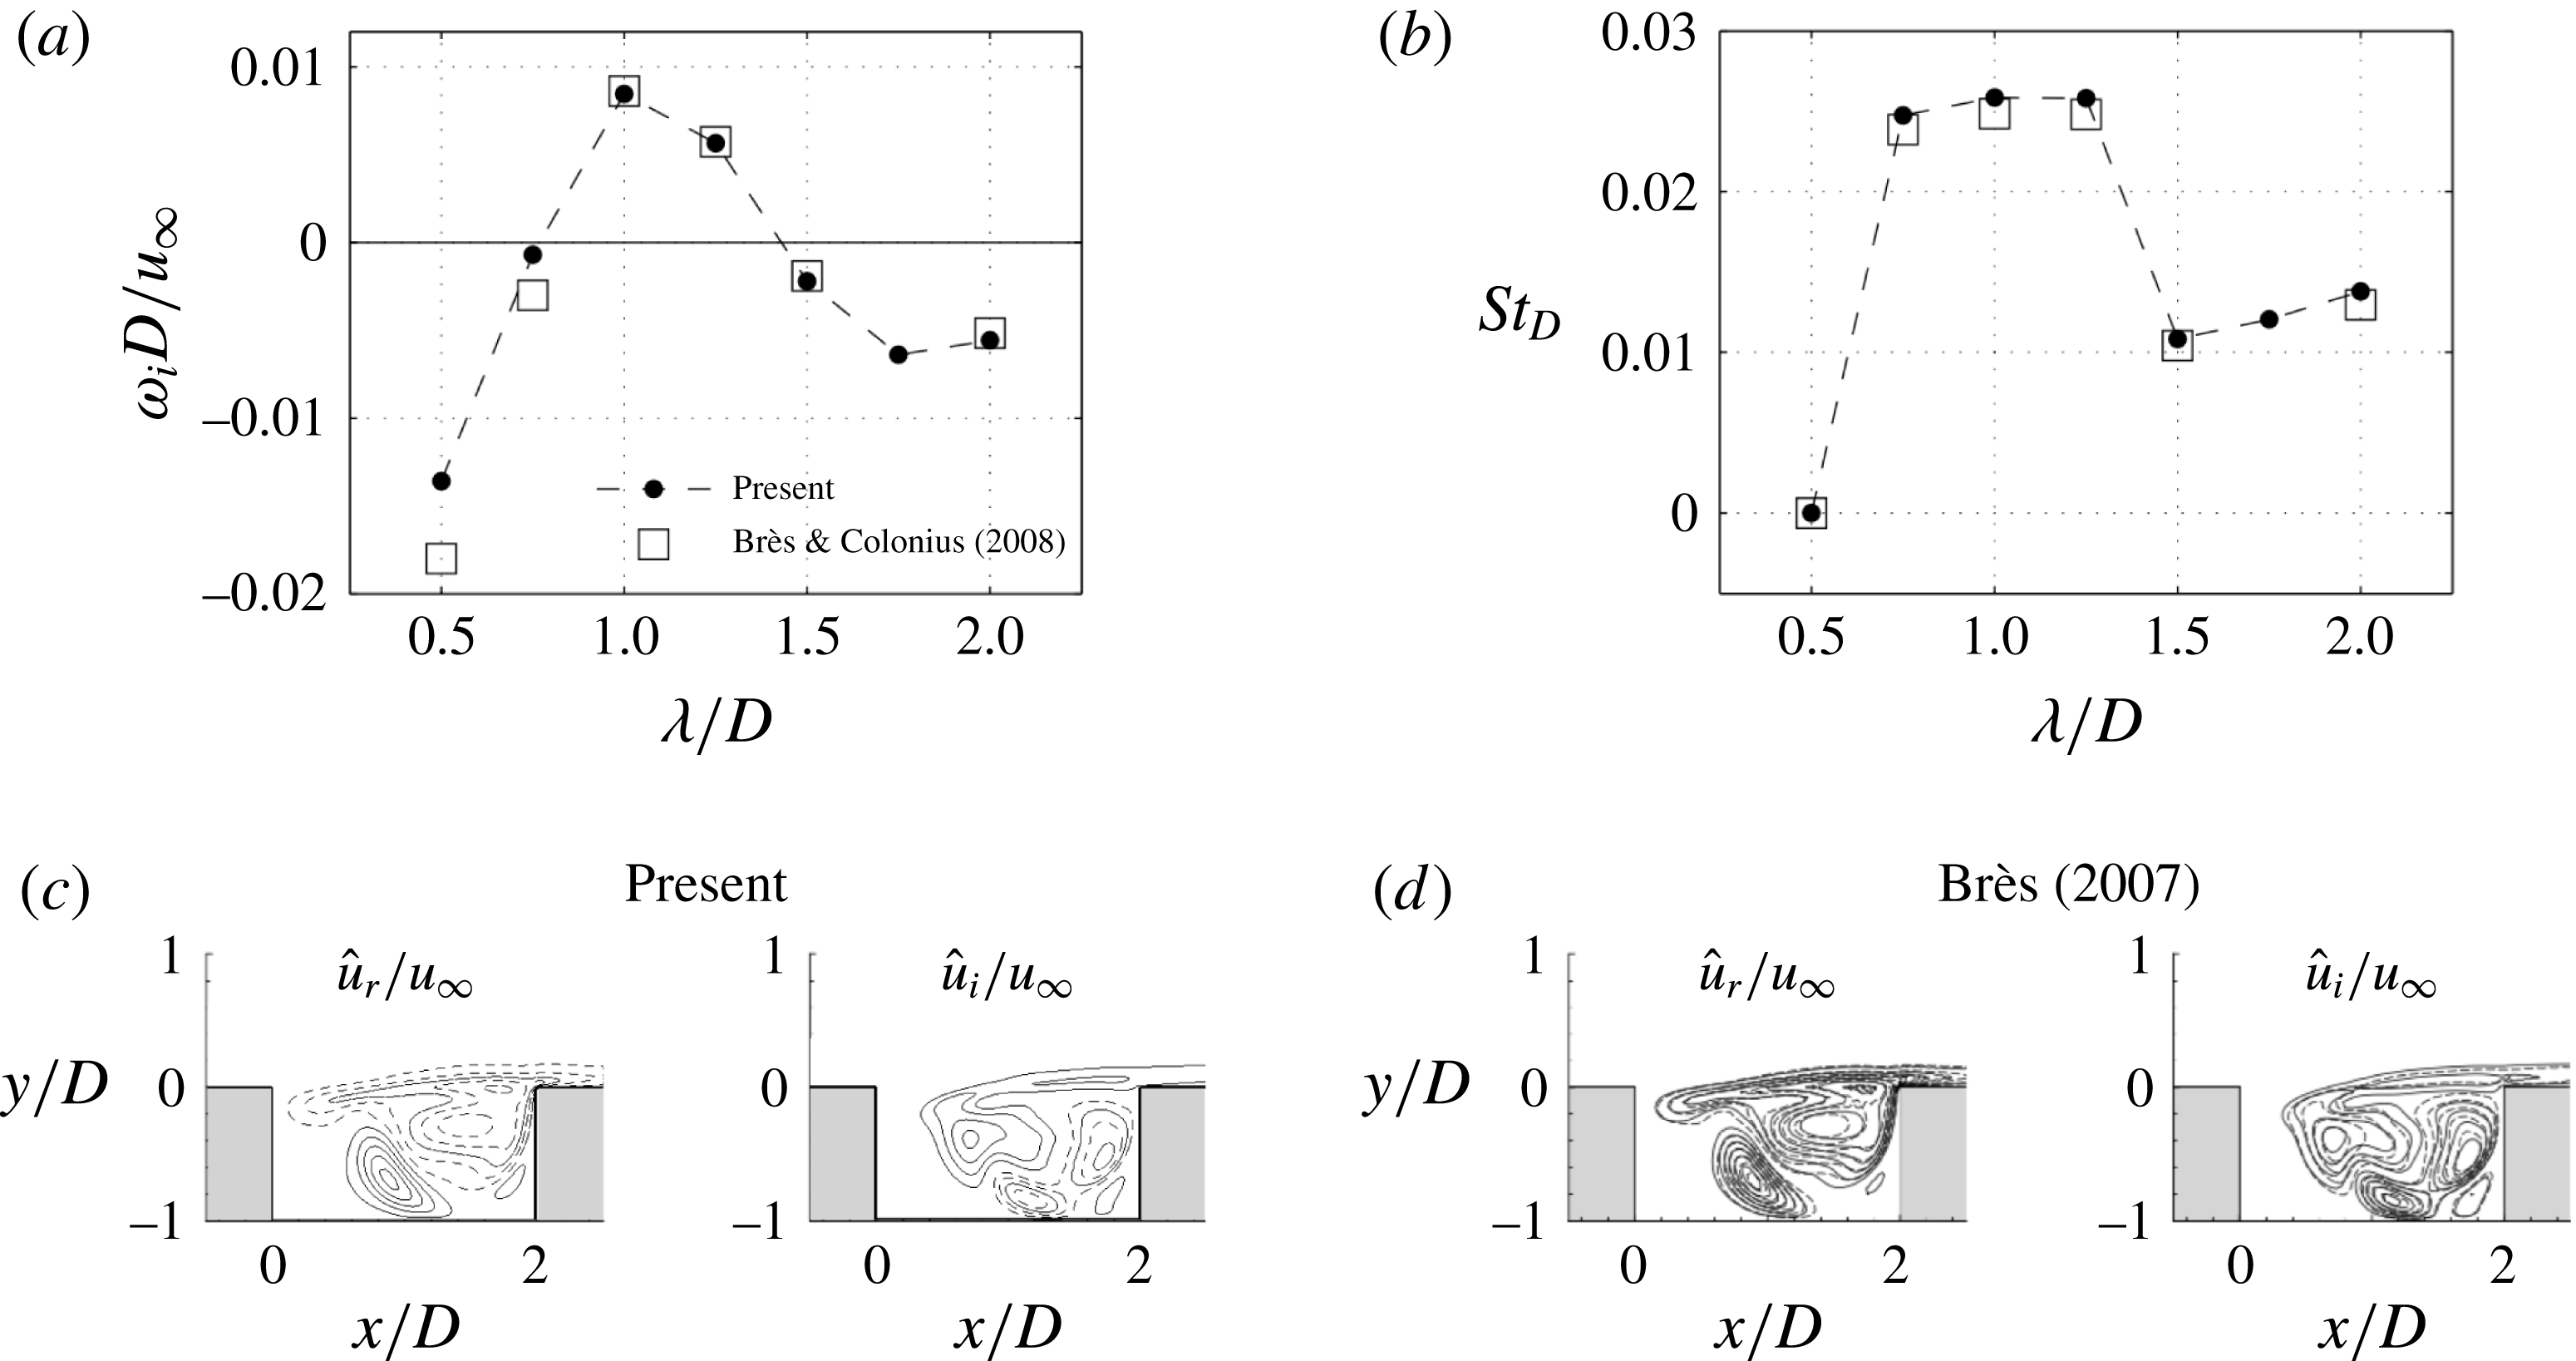
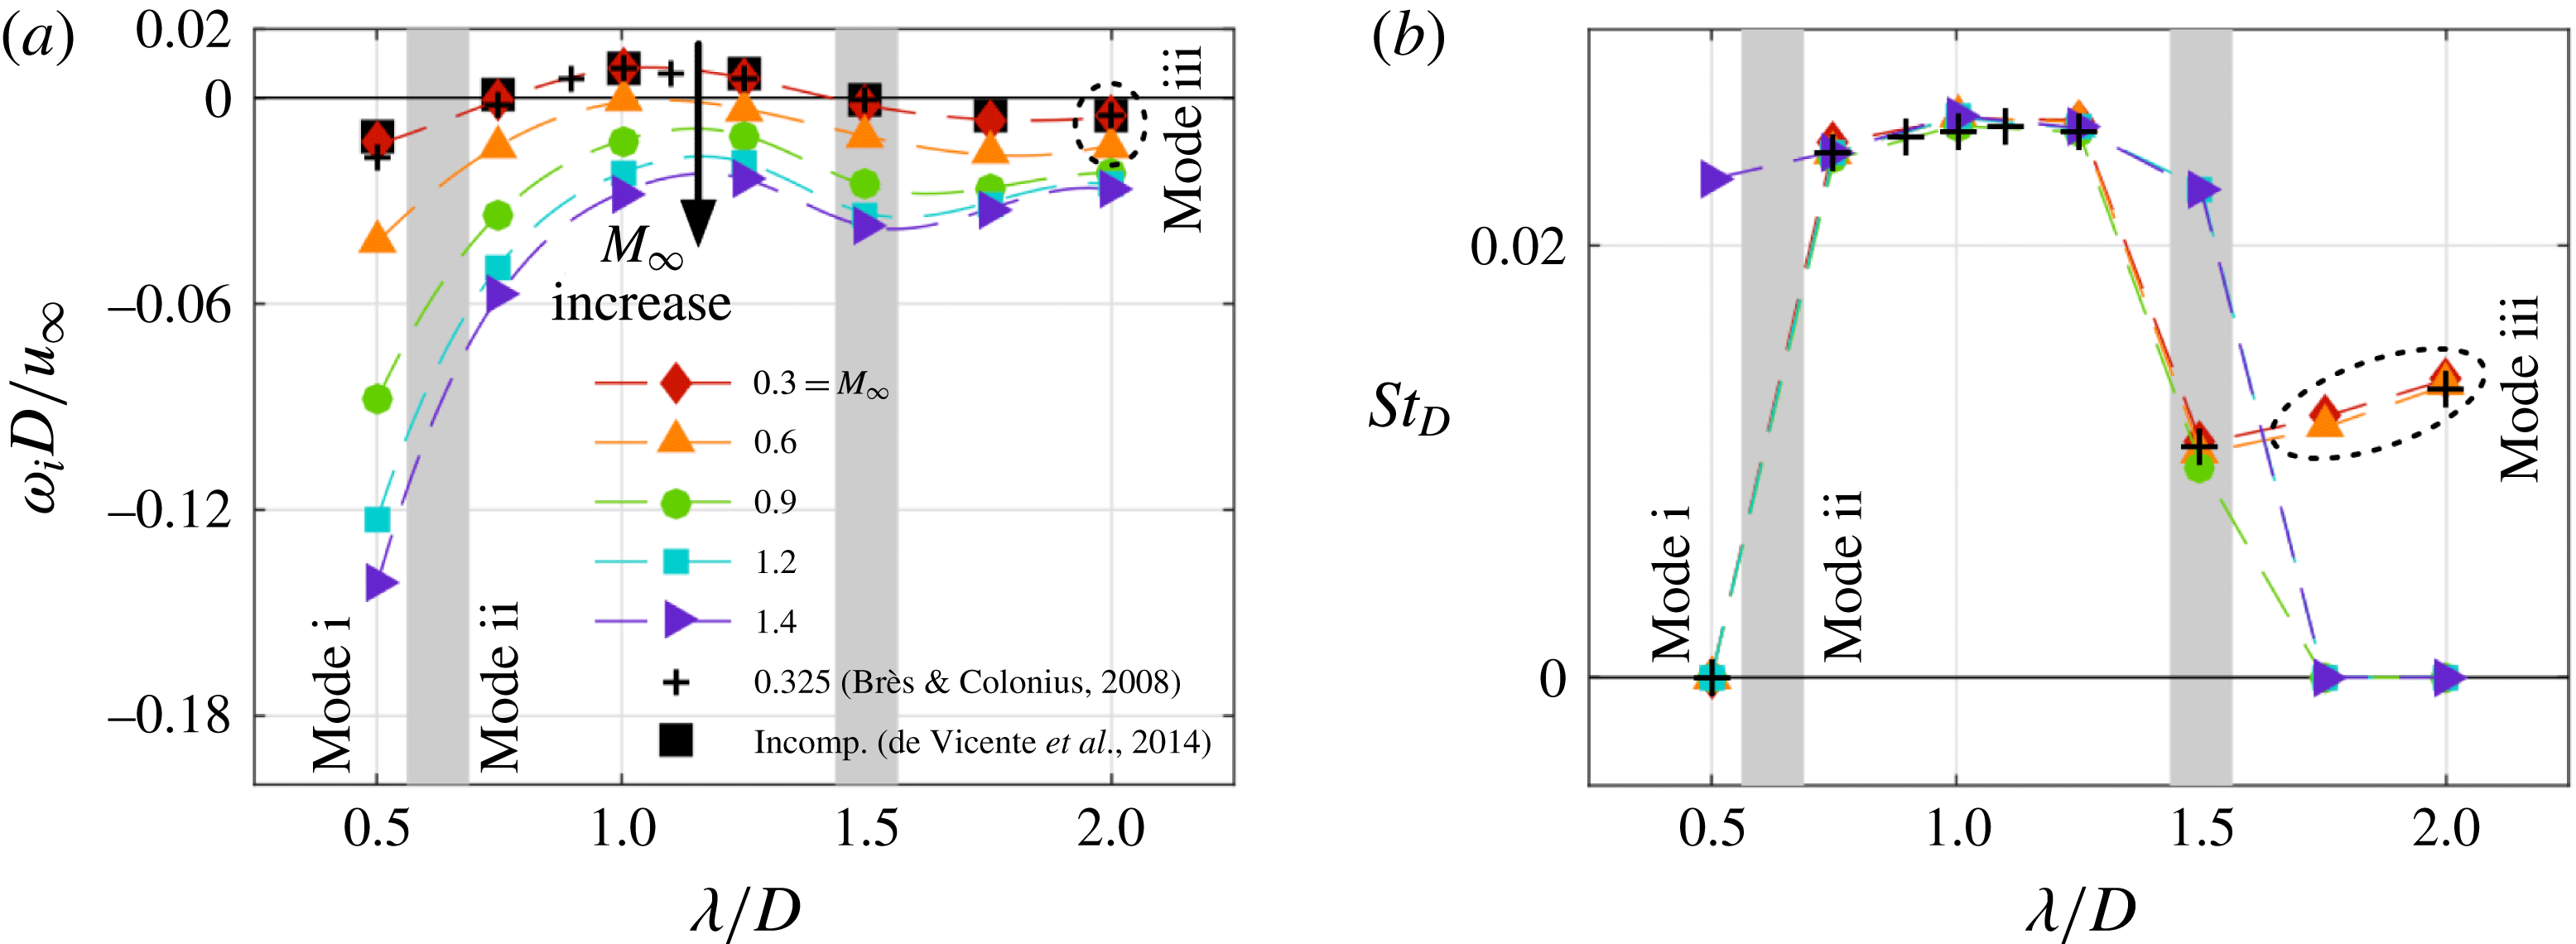
. As shown in figure 4, the dominant 3-D modes from this study are compared to the results from Brès & Colonius (Reference Brès and Colonius2008), in which they resolved the dominant 3-D modes by solving an initial value problem based on the linearized Navier–Stokes equations. The growth/decay rate, frequency and eigenvector of the dominant eigenmode obtained from present instability study agree well with those from Brès & Colonius (Reference Brès and Colonius2008).
Comparison of dominant 3-D modes properties ((a) growth/decay rate
 $\unicode[STIX]{x1D714}_{i}D/u_{\infty }$
and (b) frequency
 $St_{D}$
) between the present biglobal analysis and linear simulation by Brès & Colonius (Reference Brès and Colonius2008) at
 $Re_{\unicode[STIX]{x1D703}}=56.8$
. Eigenvectors of the most unstable mode with
 $\unicode[STIX]{x1D706}/D=1.0$
are in good agreement with those in Brès (Reference Brès2007), contour levels of real and imaginary components of streamwise velocity
 $\hat{u} _{r}/u_{\infty }$
and
 $\hat{u} _{i}/u_{\infty }\in [-0.058,0.058]$
are used. (c) Present:
 $M_{\infty }=0.3$
; (d) Brès (Reference Brès2007):
 $M_{\infty }=0.325$
(reproduced with permission from the author).

3 Two-dimensional direct numerical simulation and analysis
We focus on examining the effects of
 $L/D$
, Mach number, and Reynolds number on 2-D flow oscillation mechanisms in this section. These parameters are known to significantly influence cavity flows (Krishnamurty Reference Krishnamurty1956; Rowley et al.
Reference Rowley, Colonius and Basu2002; Brès & Colonius Reference Brès and Colonius2008; Lawson & Barakos Reference Lawson and Barakos2011). In general, flows over open cavities have been broadly classified into stable, shear-layer and wake-mode dominated flows. For a stable case, the flow reaches a time-invariant steady state. With the shear-layer (Rossiter) mode, disturbances convecting downstream are amplified in the shear layer. The wake mode is rarely observed in experiments but is captured in simulations at low Reynolds number when the cavity length is relatively large compared to the momentum boundary layer thickness at the leading edge (Rowley et al.
Reference Rowley, Colonius and Basu2002; Sun et al.
Reference Sun, Taira, Cattafesta and Ukeiley2016a
). It was also observed by Gharib & Roshko (Reference Gharib and Roshko1987) and Zhang & Naguib (Reference Zhang and Naguib2011) for incompressible axisymmetric cavity flow in their experiments. The primary feature of the wake mode is the shedding of large vortices leading to the interaction between the vortex and the trailing edge, causing violent fluctuations in the cavity.
Here, we discuss the flow characteristics, instabilities, and behaviour of the Rossiter mode by performing 2-D DNS. The simulations were conducted over a sufficiently long convective time (with a minimum of 150 convective units
 $D/u_{\infty }$
) for the flow to reach a steady state. Such flow in this study is categorized as stable (asymptotically stable) if the flow is devoid of any oscillation and otherwise unstable. A number of cases that span the range of Mach numbers from
 $M_{\infty }=0.1$
to 1.4 and Reynolds number (
 $Re_{\unicode[STIX]{x1D703}}$
) up to 144 with
 $L/D=2$
and 6 are analysed in detail. For
 $L/D=2$
, the parameters of
 $M_{\infty }$
and
 $Re_{\unicode[STIX]{x1D703}}$
are chosen to greatly expand upon the subsonic stability analysis performed by Brès & Colonius (Reference Brès and Colonius2008). We extend their analysis to the transonic Mach number regime and determine unstable steady states of oscillatory cavity flows in preparation for the biglobal stability analysis in § 4. Flow over a long cavity with
 $L/D=6$
is also examined in detail as this configuration is representative of long cavities used in aircraft.
3.1 Flow field characteristics
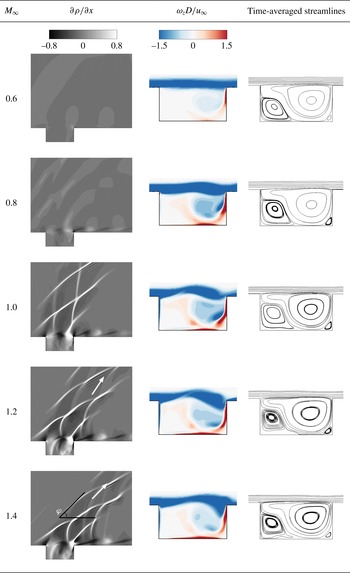
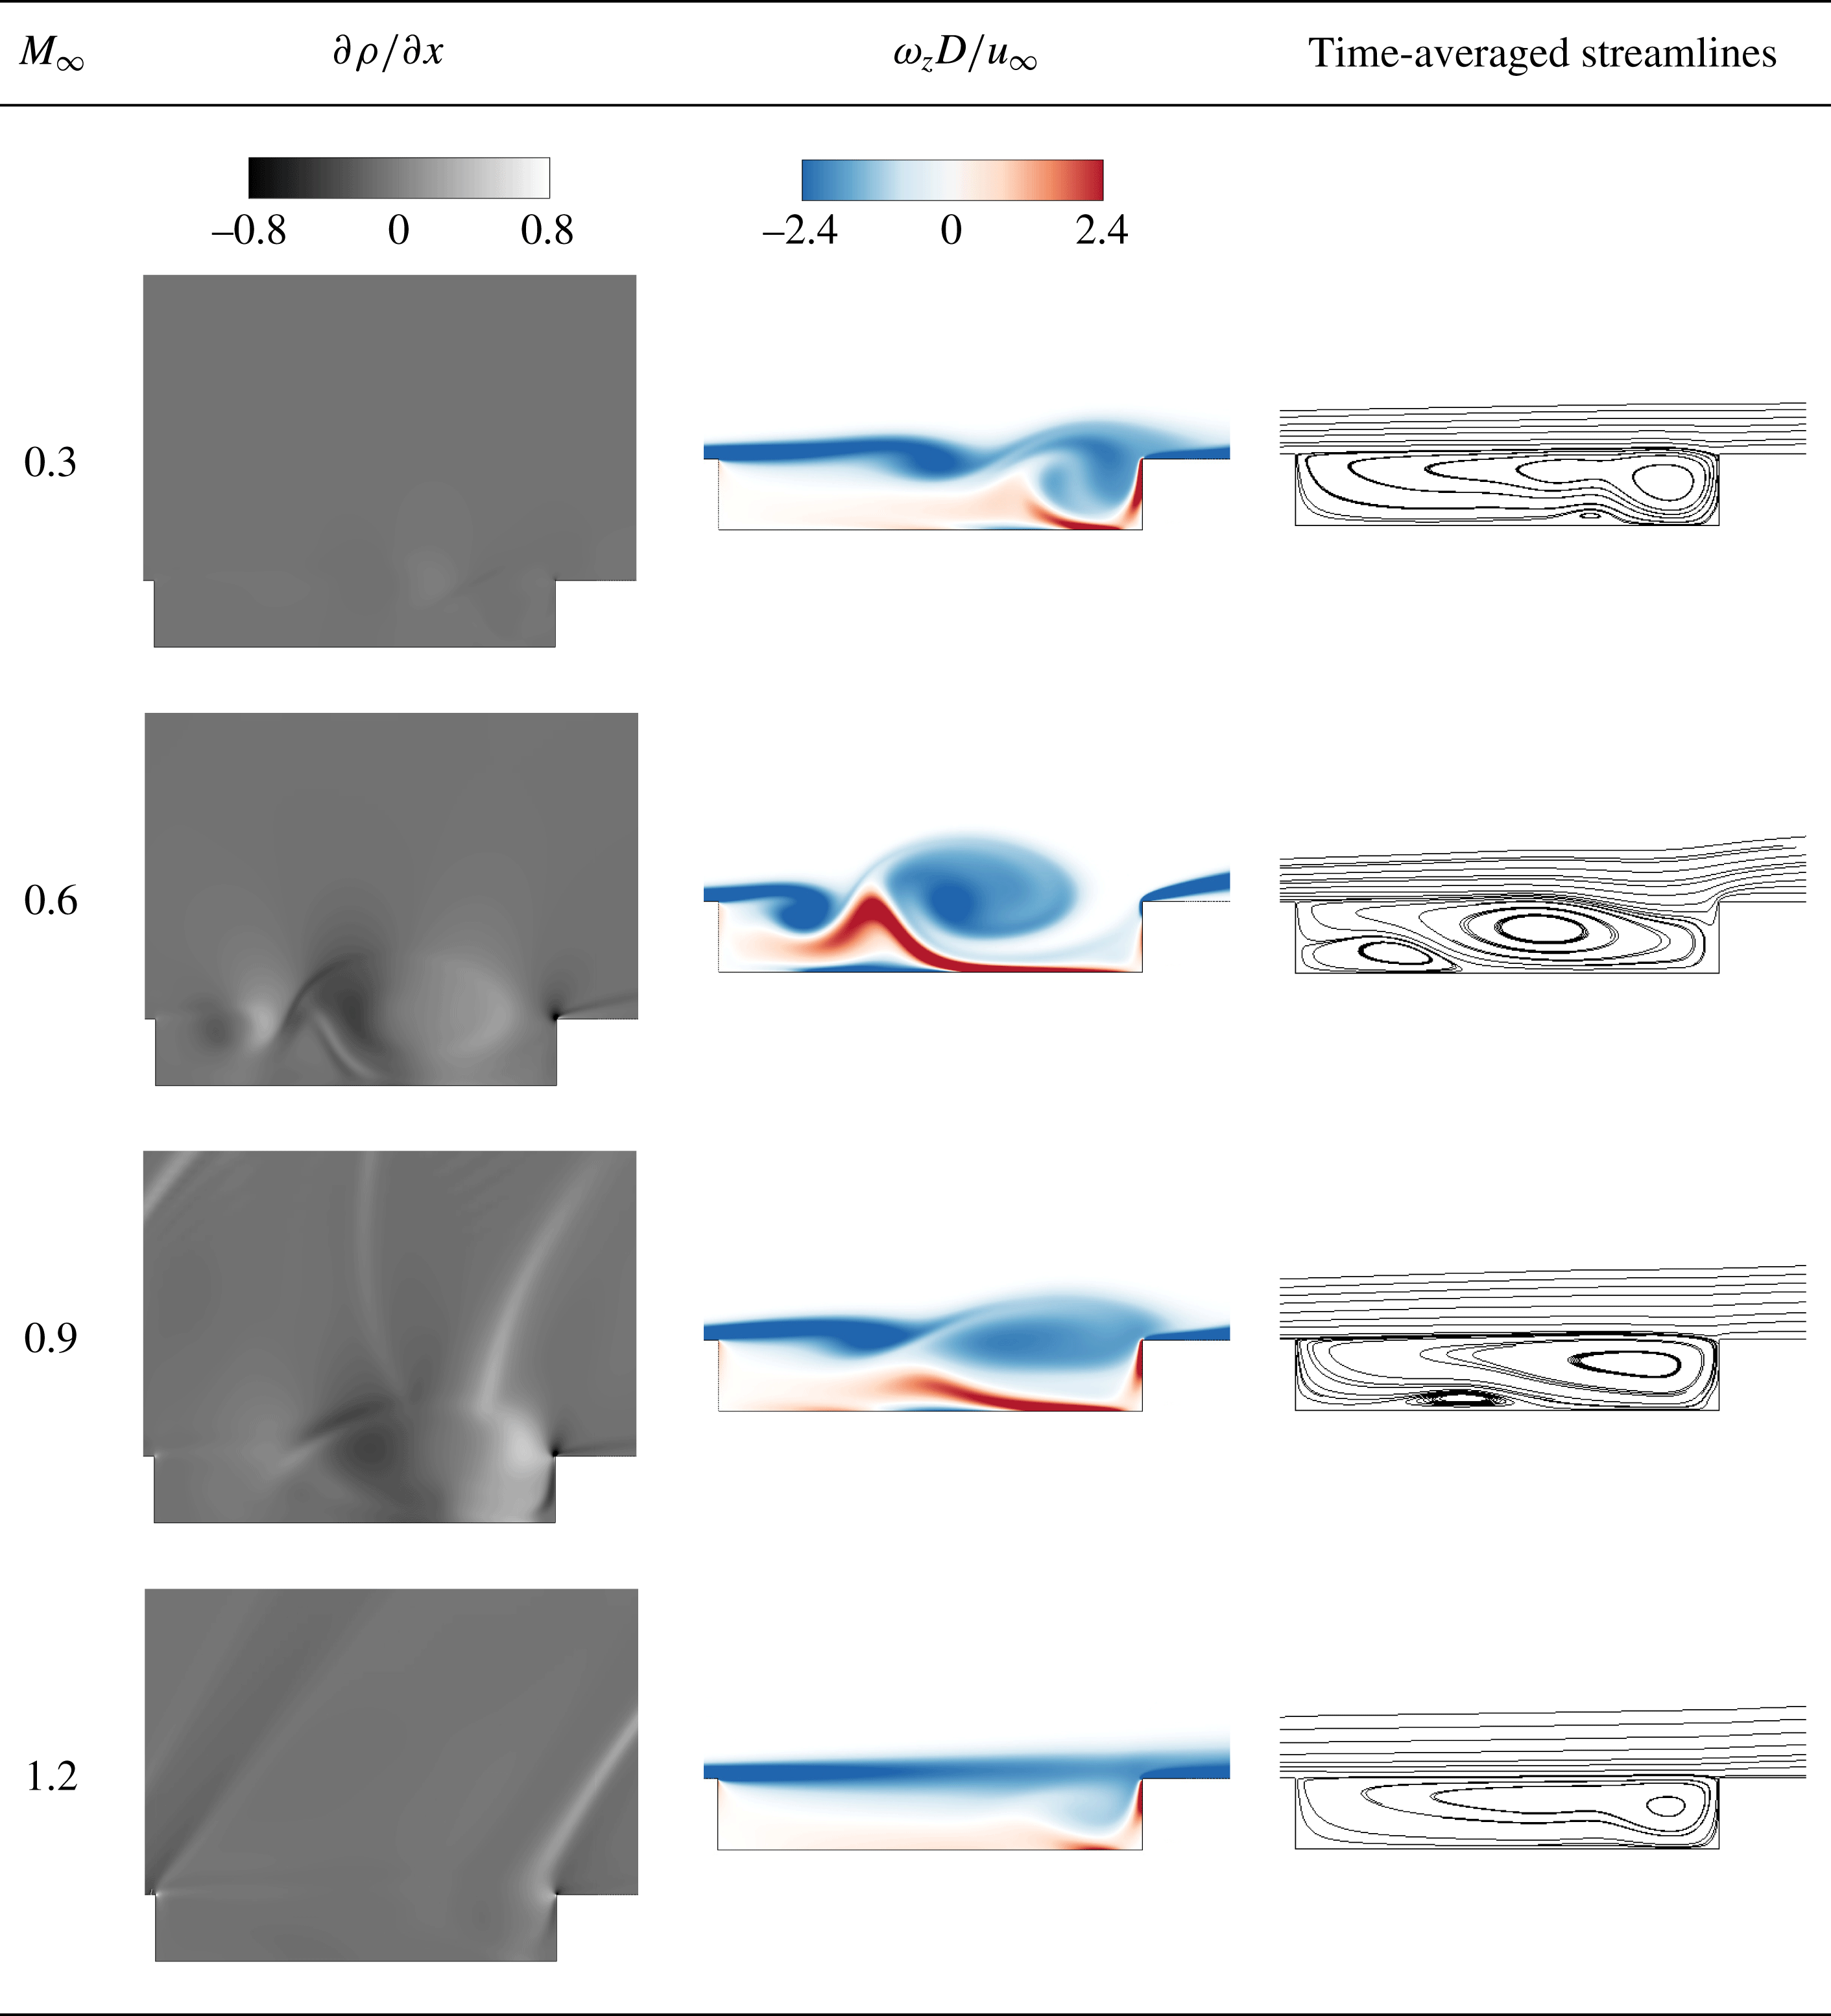
To examine how compressibility affects flow features, the instantaneous density gradient field, the instantaneous vorticity field and the time-averaged streamlines are shown in figures 5 and 6 for cavities with
 $L/D=2$
and 6, respectively.
Instantaneous numerical schlieren
 $\unicode[STIX]{x2202}\unicode[STIX]{x1D70C}/\unicode[STIX]{x2202}x\in [-0.8,0.8]$
, instantaneous vorticity
 $\unicode[STIX]{x1D714}_{z}D/u_{\infty }\in [-1.5,1.5]$
contours and time-averaged streamlines are shown for
 $M_{\infty }=0.6{-}1.4$
,
 $L/D=2$
and
 $Re_{\unicode[STIX]{x1D703}}=46$
. The arrows in numerical schlieren images indicate the propagation directions of compression waves.

For a cavity with
 $L/D=2$
, the instantaneous density gradient fields for Mach numbers from 0.6 to 1.4 are presented in figure 5 at
 $Re_{\unicode[STIX]{x1D703}}=46$
. At
 $M_{\infty }=0.6$
, the compression waves in the flow field are not prominent compared to those at higher Mach numbers. When
 $M_{\infty }$
increases to 0.8, the acoustic radiation emitted from the trailing edge becomes noticeable and its wavelength becomes smaller, which has also been discussed by Rowley et al. (Reference Rowley, Colonius and Basu2002). For
 $M_{\infty }\geqslant 1.0$
, the acoustic waves are more prominent and its structure over the cavity becomes directional. This phenomenon is observed in experiments by Krishnamurty (Reference Krishnamurty1956) as well. Part of the compression waves are generated at the rear corner of cavity. At the trailing edge, for the oncoming flow with a large deflection angle, a shock is formed due to the impingement of the shear layer on the trailing edge. The remaining waves are generated from the periodic expansion and compression of shear-layer oscillations in the supersonic flow. Inside the cavity, animations (not shown) reveal that waves travel back and forth due to reflections. Outside of the cavity, compression waves propagate upstream in the subsonic cases (
 $M_{\infty }<1.0$
). On the other hand, the compression waves are swept downstream in the supersonic cases (
 $M_{\infty }\geqslant 1.0$
). This leads to the formation of oblique compression waves propagating downstream. A beam structure is formed which consists of the compression waves described above. The angle
 $\unicode[STIX]{x1D711}$
of the beam composed of these compression waves above the cavity is measured in the density gradient flow fields. This angle
 $\unicode[STIX]{x1D711}$
approximates the corresponding Mach wave angle
 $\sin ^{-1}(1/M_{\infty })$
for
 $M_{\infty }>1$
. For
 $M_{\infty }=1.2$
and 1.4, we find
 $\unicode[STIX]{x1D711}=60.0^{\circ }$
and
 $46.0^{\circ }$
with
 $\sin ^{-1}(1/M_{\infty })=56.4^{\circ }$
and
 $45.6^{\circ }$
, respectively.
Instantaneous numerical schlieren
 $\unicode[STIX]{x2202}\unicode[STIX]{x1D70C}/\unicode[STIX]{x2202}x\in [-0.8,0.8]$
, instantaneous vorticity
 $\unicode[STIX]{x1D714}_{z}D/u_{\infty }\in [-2.4,2.4]$
contours and time-averaged streamlines are shown for
 $M_{\infty }=0.3$
–1.2,
 $L/D=6$
and
 $Re_{\unicode[STIX]{x1D703}}=19$
.

As shown in figure 6, for a cavity with
 $L/D=6$
at
 $Re_{\unicode[STIX]{x1D703}}=19$
, large density gradients are caused by expansion and compression of the shear layer for the subsonic regime (
 $M_{\infty }=0.3$
and 0.6). However, for
 $M_{\infty }=0.9$
, the acoustic waves become observable with their wavelength corresponding to the length of the cavity. At
 $M_{\infty }=1.2$
, the flow becomes stable with weak Mach waves emanating from the leading and trailing edges.
For a cavity with
 $L/D$
= 2, we only observe the shear-layer mode for unstable flows, with a large clockwise-rotating vortex present in the rear part of the cavity as shown in figure 5. In all cases considered for the short cavity, the streamlines reveal two major recirculation zones inside the cavity. The lack of variation in the time-averaged streamlines versus Mach number suggests that compressibility does not affect the mean flow inside the cavity significantly.
However, the flow features in the
 $L/D=6$
cases vary greatly with Mach number. At
 $M_{\infty }=0.3$
, instantaneous vorticity flow fields shown in figure 6, reveal a shear-layer mode with a clockwise rotating vortex sitting near the trailing edge. An increase in
 $M_{\infty }$
from 0.3 to 0.6 causes the flow oscillate more violently with a transition from the shear-layer mode to the wake mode. The wake mode (at
 $M_{\infty }=0.6$
) dominates the flow with a large-scale vortex rolling up with an opposite sign vortex sheet being engulfed between the vortices. Details on the appearance of the wake mode are reported in Sun et al. (Reference Sun, Taira, Cattafesta and Ukeiley2016a
). For
 $M_{\infty }=0.9$
, the opposite sign vorticity patch pulled between the shedding vortices decreases, and the fluctuations over the cavity weaken. In the transonic regime, increasing the Mach number from 0.9 to 1.2 leads to a steady flow. Compressibility apparently affects the flow instabilities by first destabilizing at subsonic speeds and then eventually stabilizing at transonic speeds.
A large difference between flow states versus Mach number is revealed in the time-averaged streamlines. When the free stream Mach number increases from 0.3 to 0.6, the centre of the main recirculation region moves towards the leading edge, then moves back towards to the trailing edge for
 $M_{\infty }=0.9$
. The features of flows inside the longer cavity are somewhat more complex than those of the shorter length.
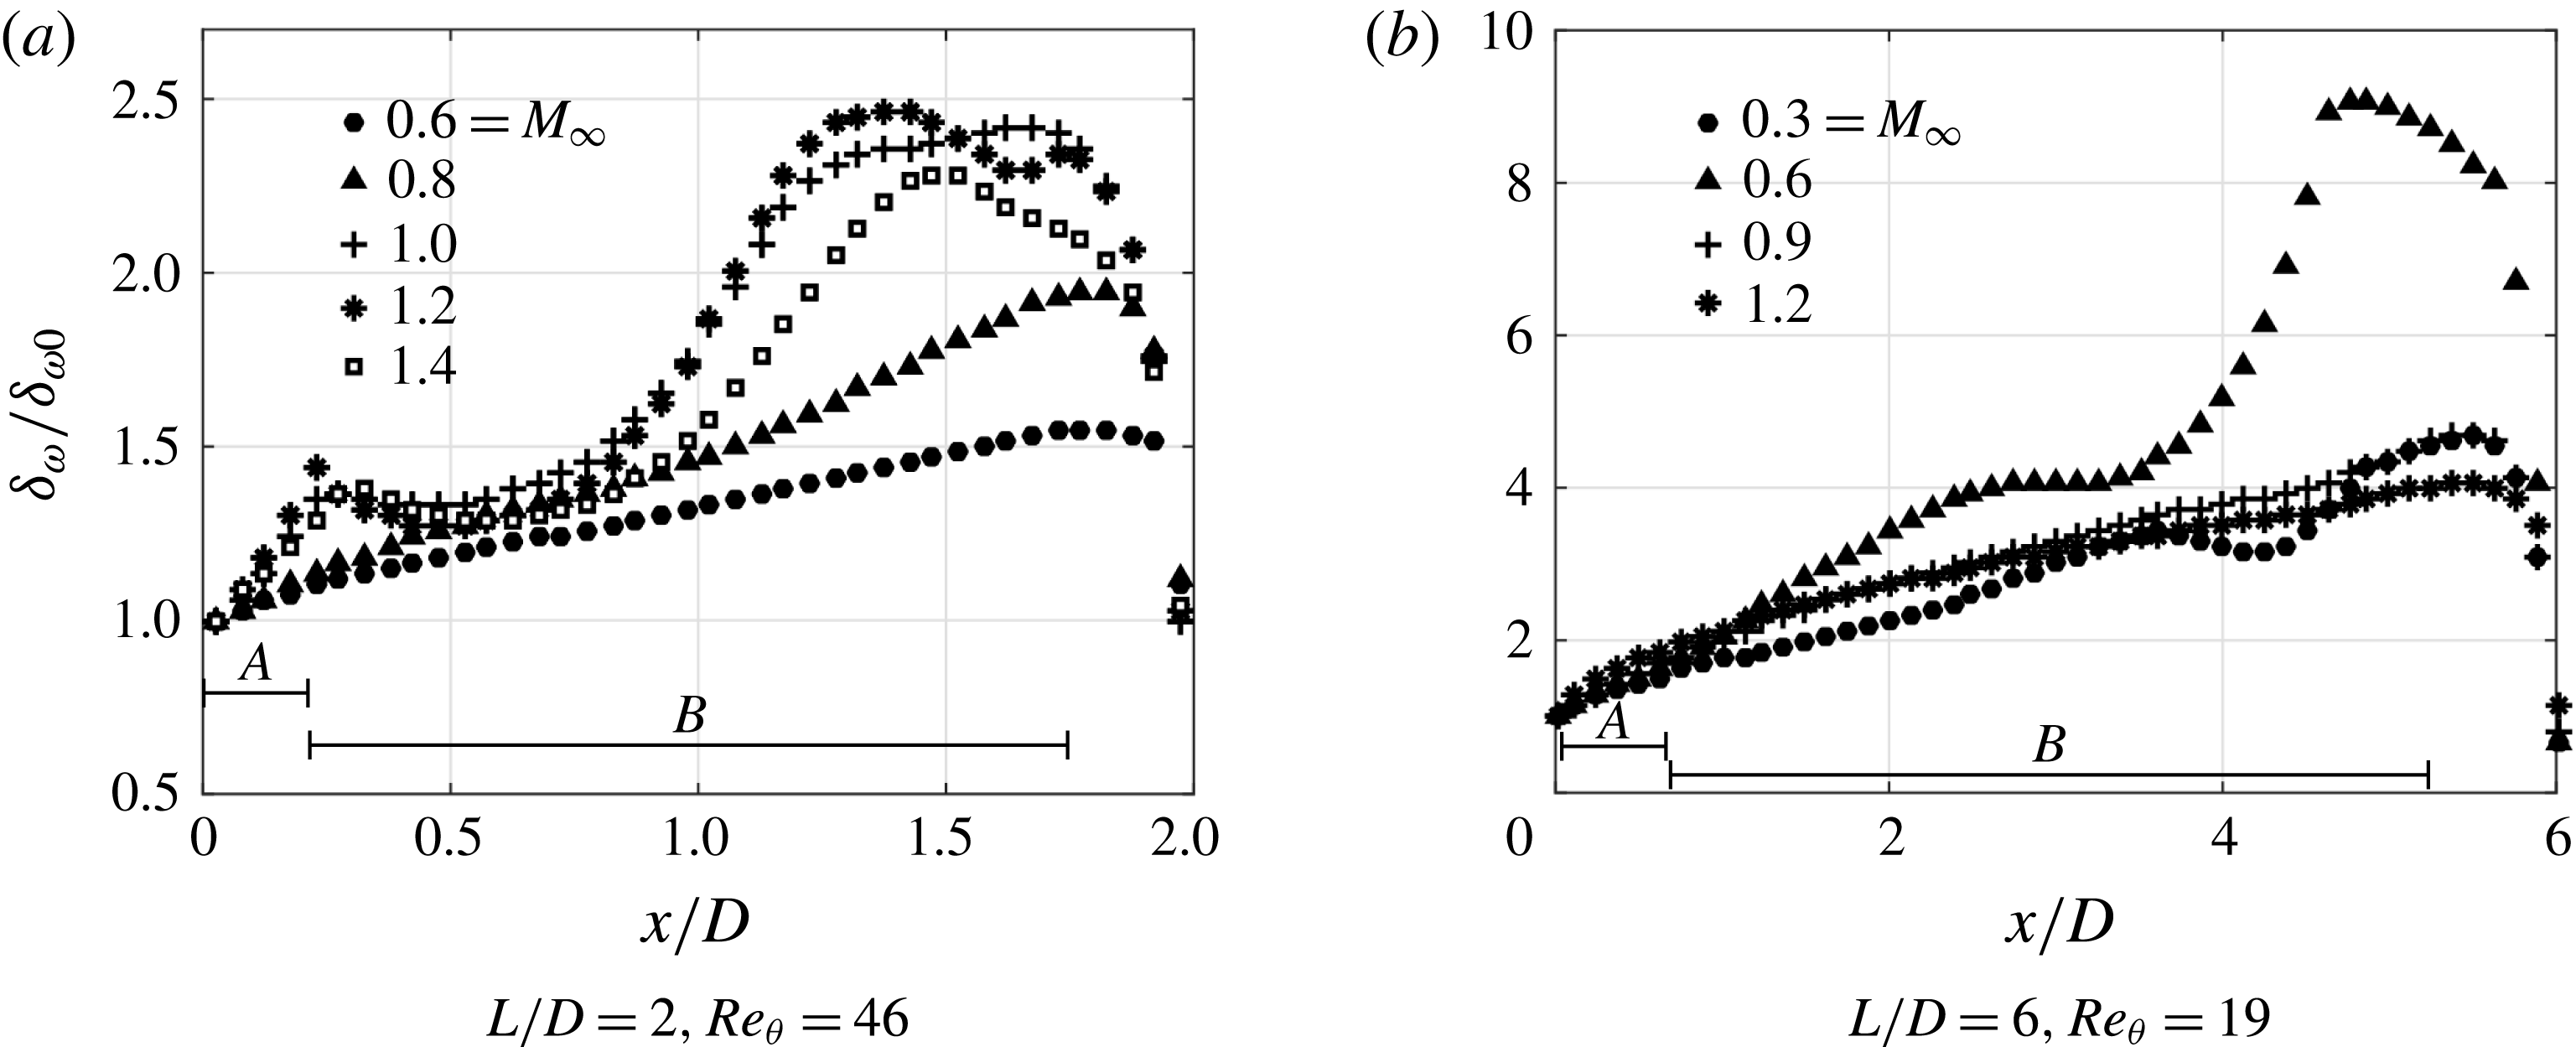
The complexity of open-cavity flow results from the feedback process associated with the shear-layer development. Let us further investigate the characteristics of the shear layer over the cavity. Several researchers have noted the similarities between the shear layer spanning the cavity and a free shear layer, such as their linear spreading rate (Sarohia Reference Sarohia1975; Cattafesta et al. Reference Cattafesta, Garg, Choudhari and Li1997; Rowley et al. Reference Rowley, Colonius and Basu2002). We evaluate the development of the vorticity thickness
 $$\begin{eqnarray}\unicode[STIX]{x1D6FF}_{\unicode[STIX]{x1D714}}=M_{\infty }\left[\left(\frac{\unicode[STIX]{x2202}\bar{u}}{\unicode[STIX]{x2202}y}\right)_{\!max}\right]^{-1}.\end{eqnarray}$$
In figure 7, the vorticity thickness is normalized by its value at the leading edge
 $\unicode[STIX]{x1D6FF}_{\unicode[STIX]{x1D714}0}$
. We examine the spreading rate dependence on different regions in the shear layer and only report
 $\text{d}\unicode[STIX]{x1D6FF}_{\unicode[STIX]{x1D714}}/\text{d}x$
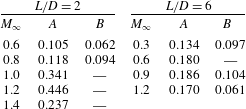
for the cases with linear spreading rate, which are summarized in table 3.
Vorticity thickness normalized by its value
 $\unicode[STIX]{x1D6FF}_{\unicode[STIX]{x1D714}0}$
at the leading edge is shown as a function of streamwise location. Different regions are indicated by
 $A$
(
 $x/L\in [0,0.12]$
) and
 $B$
(
 $x/L\in [0.12,0.86]$
).

Spreading rate of vorticity thickness
 $\text{d}\unicode[STIX]{x1D6FF}_{\unicode[STIX]{x1D714}}/\text{d}x$
of flows over
 $L/D=2$
cavity for
 $M_{\infty }=0.6$
to 1.4 at
 $Re_{\unicode[STIX]{x1D703}}=46$
and
 $L/D=6$
cavity for
 $M_{\infty }=0.3$
to 1.2 at
 $Re_{\unicode[STIX]{x1D703}}=19$
as illustrated in figure 7. Different regions are indicated by
 $A$
(
 $x/L\in [0,0.12]$
) and
 $B$
(
 $x/L\in [0.12,0.86]$
).
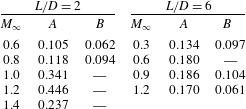
As shown in figure 7 for the cavity with
 $L/D=2$
, for the cases (
 $M_{\infty }=0.6$
and 0.8) without intense acoustic compression waves, the overall spreading rate is still nearly linear. Rowley et al. (Reference Rowley, Colonius and Basu2002) found
 $\text{d}\unicode[STIX]{x1D6FF}_{\unicode[STIX]{x1D714}}/\text{d}x=0.05$
for
 $D/\unicode[STIX]{x1D703}_{0}=26.5$
at
 $Re_{\unicode[STIX]{x1D703}}=56.8$
and
 $M_{\infty }=0.6$
, and the value is close to the spreading rate
 $\text{d}\unicode[STIX]{x1D6FF}_{\unicode[STIX]{x1D714}}/\text{d}x=0.062$
(region
 $B$
) for
 $D/\unicode[STIX]{x1D703}_{0}=26.4$
at a lower
 $Re_{\unicode[STIX]{x1D703}}=46$
and
 $M_{\infty }=0.6$
in the present work. In the cases with
 $M_{\infty }\geqslant 1.0$
, a double-hump distribution of vorticity thickness is observed in figure 7(a). As the numerical schlieren reveals in figure 5, strong compression waves are formed in supersonic flows. When these waves propagate upstream, they interact with shear layer over the cavity, which distorts the mean profile of the shear layer and results in the double-hump feature. However, for subsonic flows, the compression waves are not strong enough to affect the mean profile, resulting in a linear spreading rate. Near the leading edge of cavity (region
 $A$
), the spreading rate is increased as Mach number increases until
 $M_{\infty }=1.2$
. Further increasing Mach number to
 $M_{\infty }=1.4$
reduces the spreading rate. The stabilizing effect of compressibility in the transonic regime will be further addressed in a later discussion in § 4.1.
For
 $L/D=6$
, except for the wake-mode case at
 $M_{\infty }=0.6$
, all the other cases (shear-layer modes) reveal approximately linear spreading rates. We note that the growth rates here (region
 $B$
) are in agreement with the values reported by Gharib & Roshko (Reference Gharib and Roshko1987), which are almost constant
 $\text{d}\unicode[STIX]{x1D6FF}_{\unicode[STIX]{x1D714}}/\text{d}x=0.124$
when
 $L/\unicode[STIX]{x1D703}_{0}>103$
. The flow at
 $M_{\infty }=1.2$
is stable, in which there is no roll up of the shear layer bridging the cavity; thus the spreading rate in region
 $B$
is reduced compared to the other shear-layer cases.
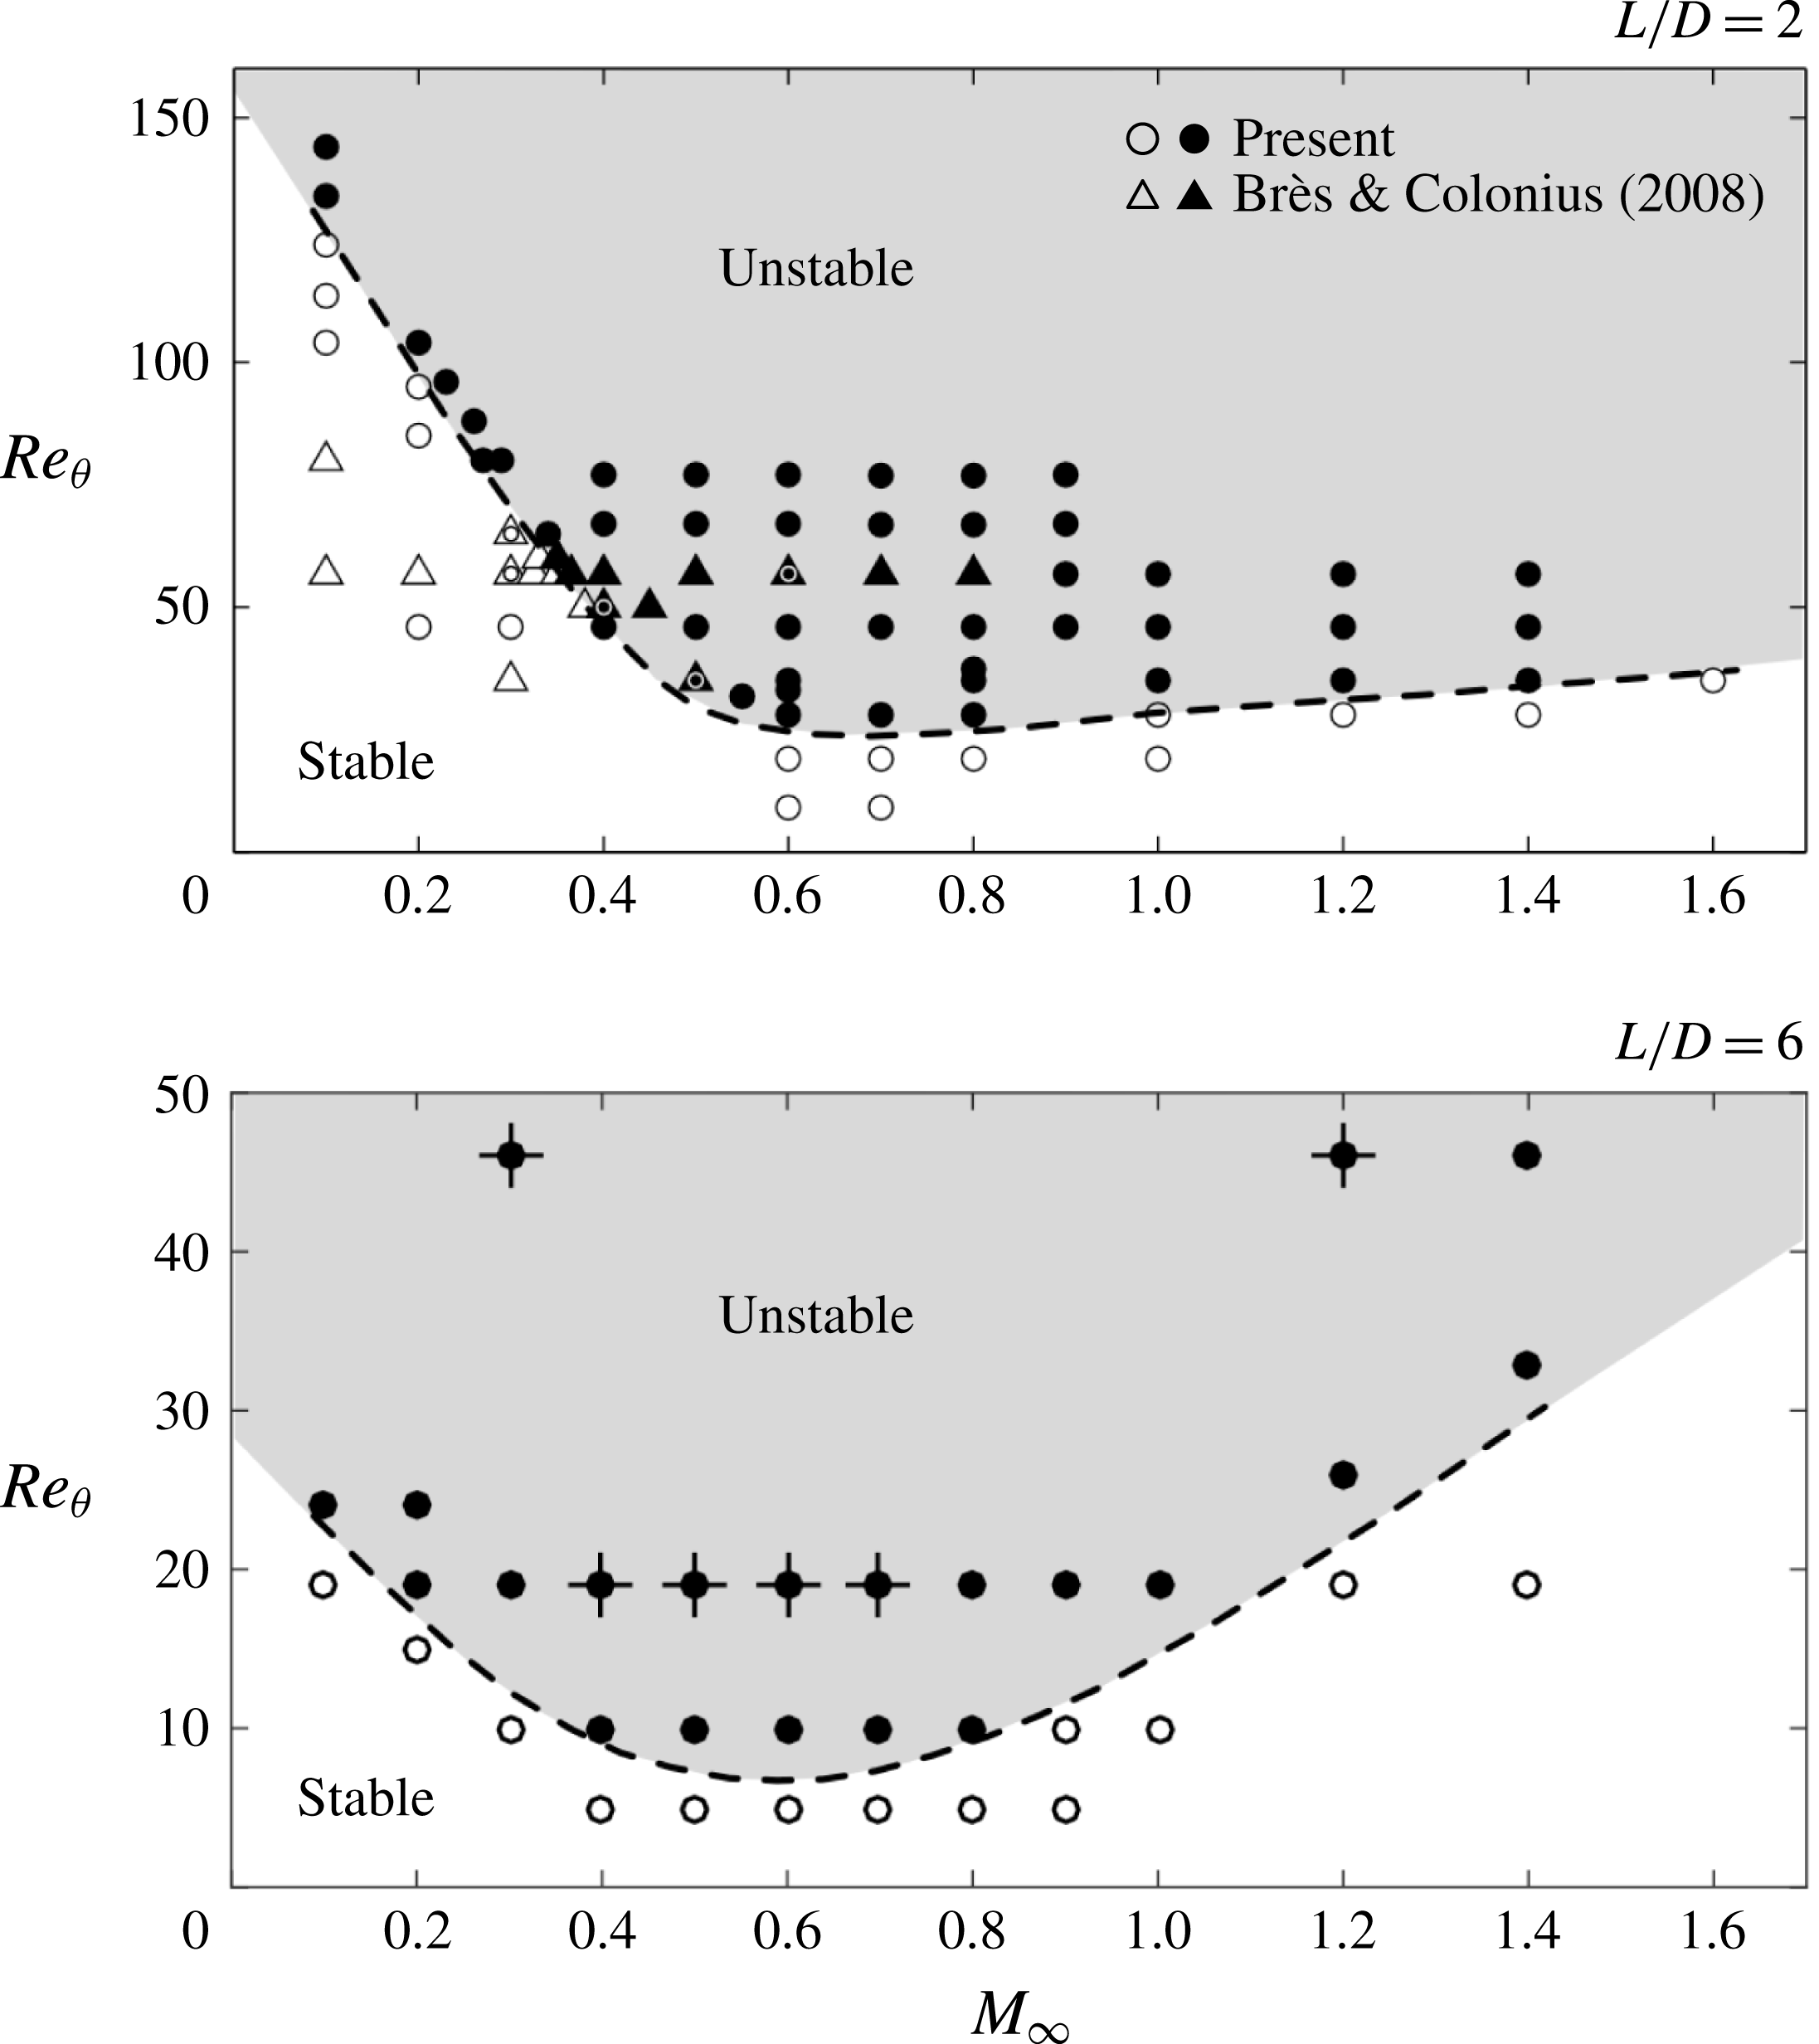
3.2 Stability diagram
In the present work, the parameters of
 $M_{\infty }$
and
 $Re_{\unicode[STIX]{x1D703}}$
are selected to expand upon the subsonic stability analysis performed by Brès & Colonius (Reference Brès and Colonius2008). Through an extensive parametric study, the influence of
 $M_{\infty }$
and
 $Re_{\unicode[STIX]{x1D703}}$
on the stability of 2-D open-cavity flows are revealed, as shown in figure 8. We find the approximate neutral stability curve via nonlinear flow simulations to separate the stable and unstable zones in terms of
 $M_{\infty }$
and
 $Re_{\unicode[STIX]{x1D703}}$
. For both
 $L/D=2$
and 6, when the Mach number decreases towards the incompressible limit, the flow becomes more stable for a wider range of Reynolds numbers as shown in figure 8. In the subsonic regime below
 $M_{\infty }=0.6$
, an increase in Mach number destabilizes the flow, which was also documented by Brès & Colonius (Reference Brès and Colonius2008). However, in the present study, as the Mach number increases above
 $M_{\infty }=0.6$
for both
 $L/D=2$
and 6, the slope of the neutral stability curve increases, which corresponds in the simulations to a reduction in the amplitude of the observed oscillations. This destabilization (
 $M_{\infty }\leqslant 0.6$
) and subsequent stabilization (
 $M_{\infty }>0.6$
) effects of Mach number are also reported by Yamouni et al. (Reference Yamouni, Sipp and Jacquin2013) for short cavities with
 $L/D=1$
and 2. Compared to
 $L/D=2$
, the neutral stability curve for
 $L/D=6$
shifts downwards. The flows over cavities with larger aspect ratio are thus more unstable because of the increased spatial extent for the shear layer to develop and amplify disturbances.
Stability diagram of 2-D open-cavity flow for
 $L/D=2$
and 6 obtained from DNS. Stable cases: ▵, ○; unstable cases: ▴,
 $\bullet$
. The triangles are from Brès & Colonius (Reference Brès and Colonius2008) and the circles are from the present study. The dashed lines represent the approximate neutral stability curves. For the cavity with
 $L/D=6$
, the wake-mode dominated cases are indicated by
 $+$
.

3.3 Rossiter modes
The primary oscillation mechanism in open-cavity flow is associated with the Rossiter modes. For all cases considered herein, the time history of the vertical velocity at the mid-point of the cavity shear layer (
 $x=L/2,$
 $y=0$
) is recorded. A discrete Fourier transform is performed on the probe data collected after a minimum of
 $50$
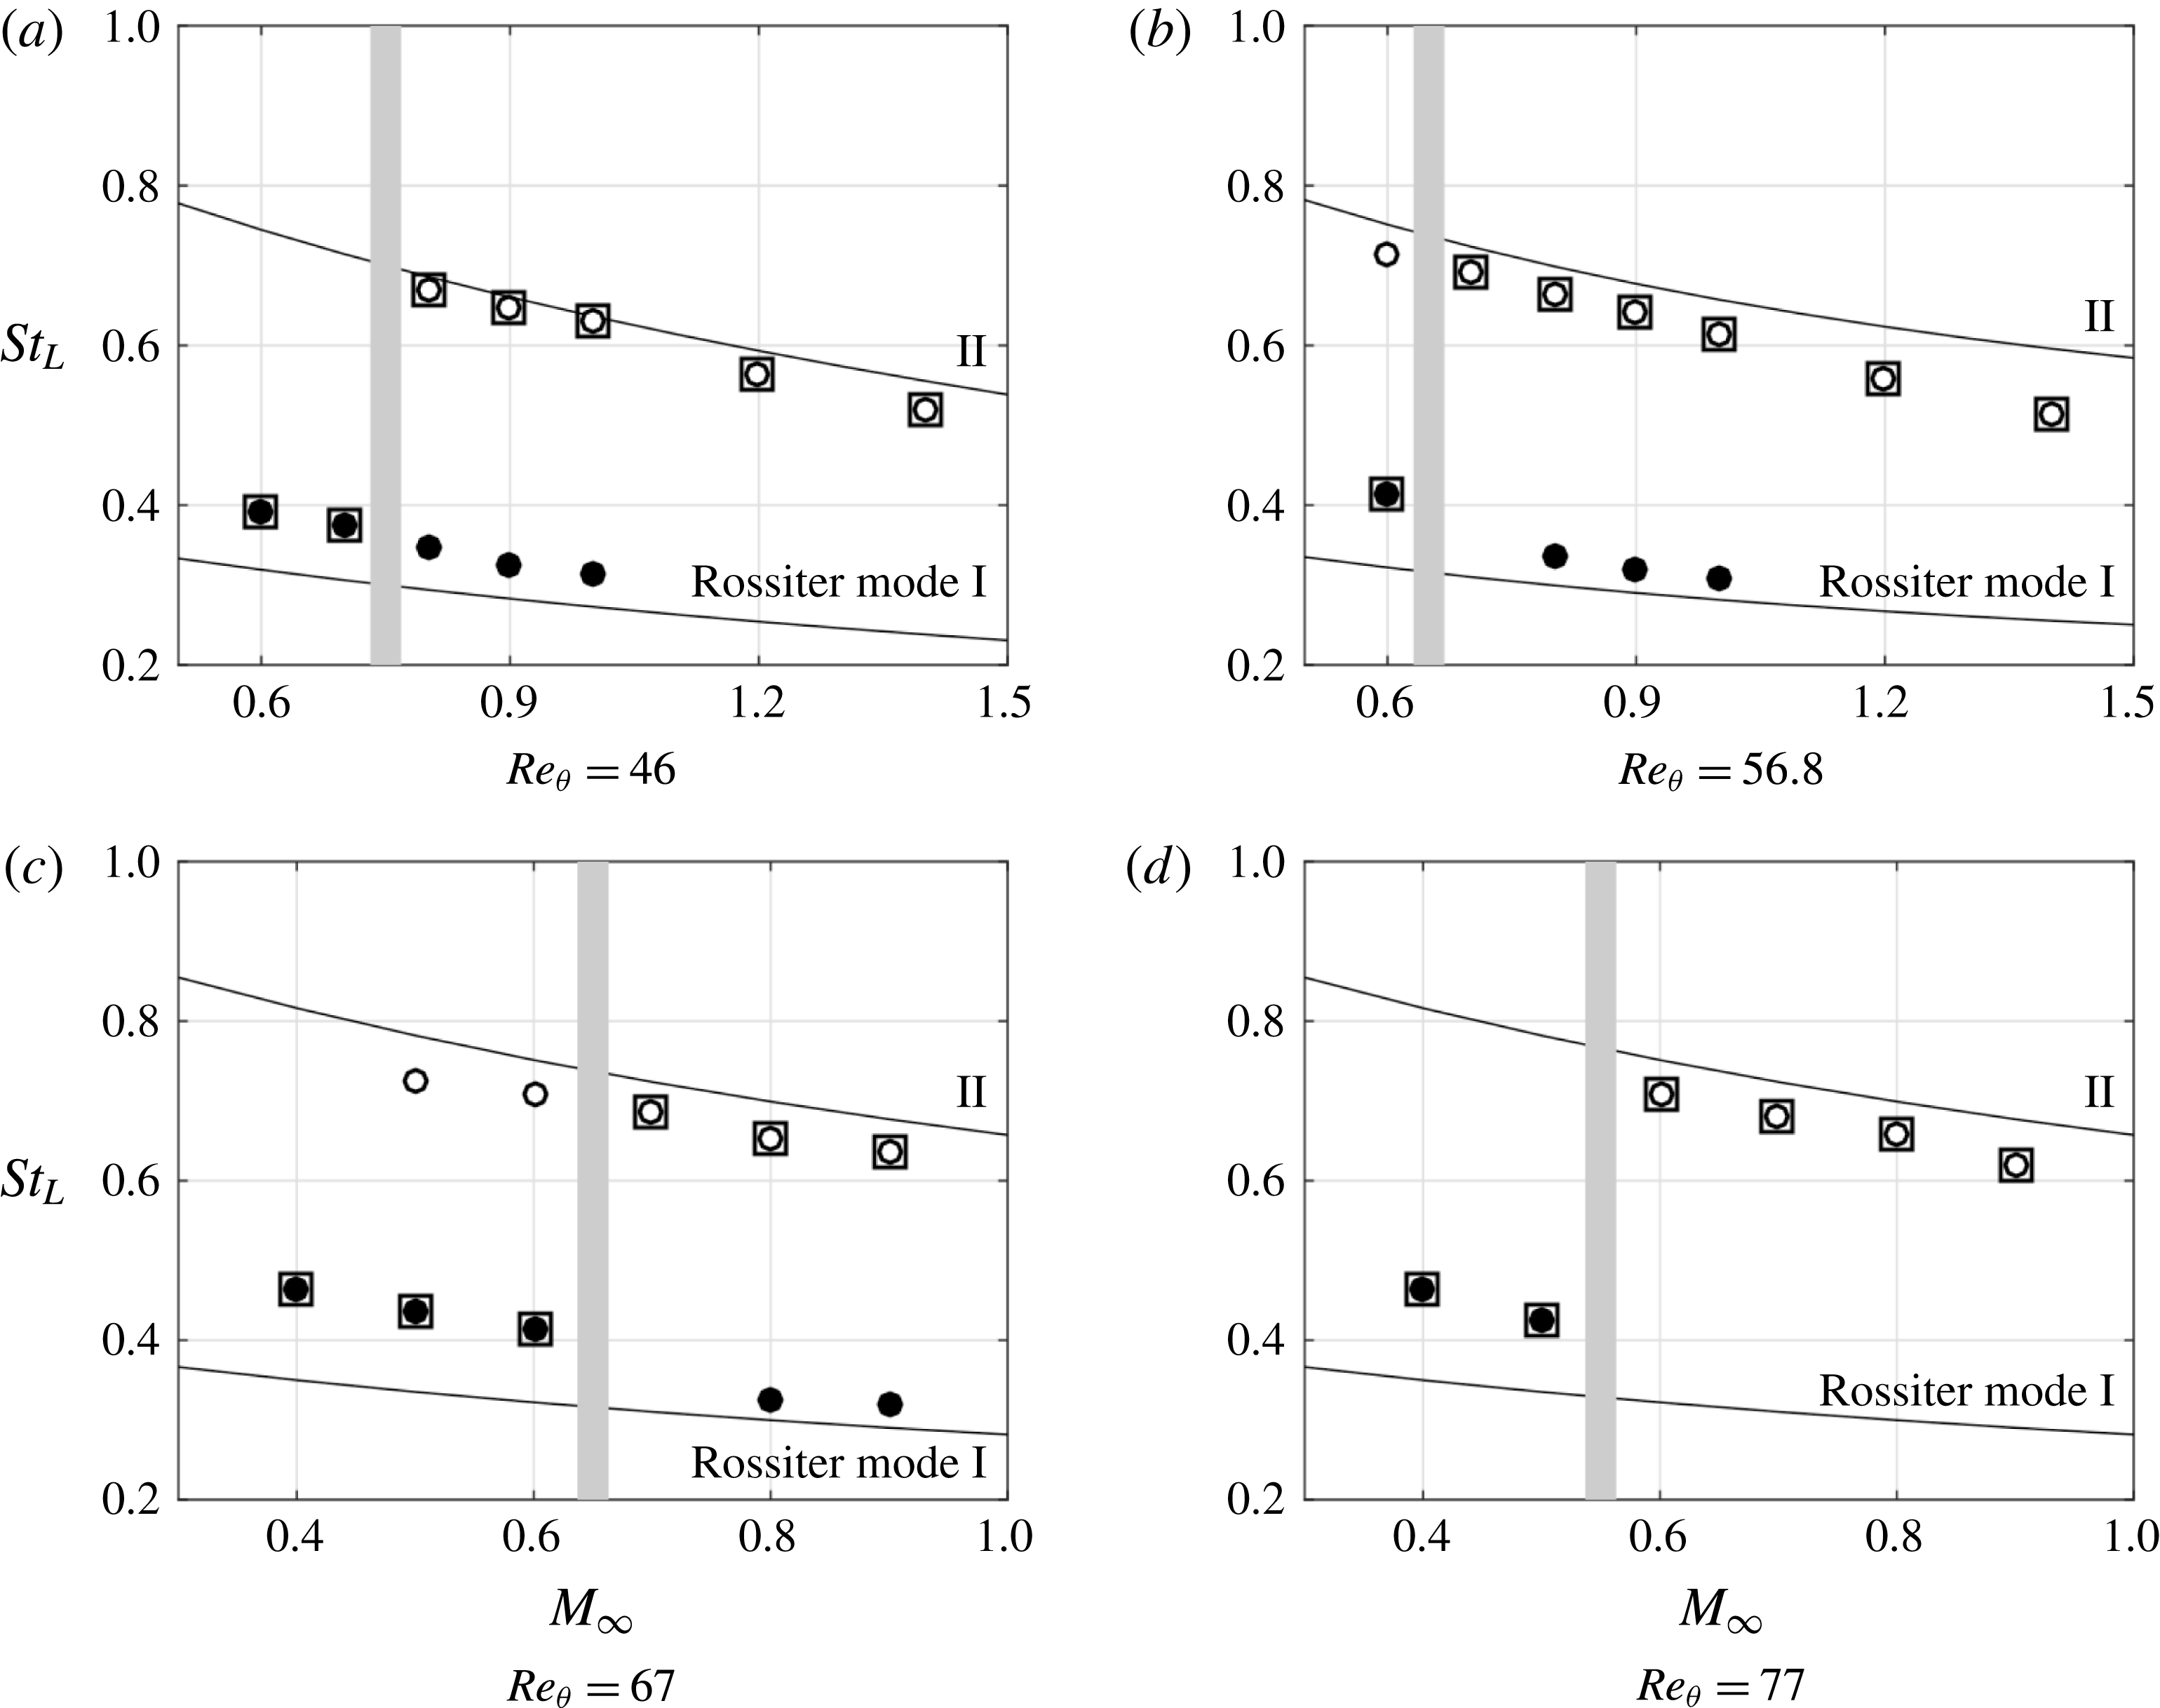
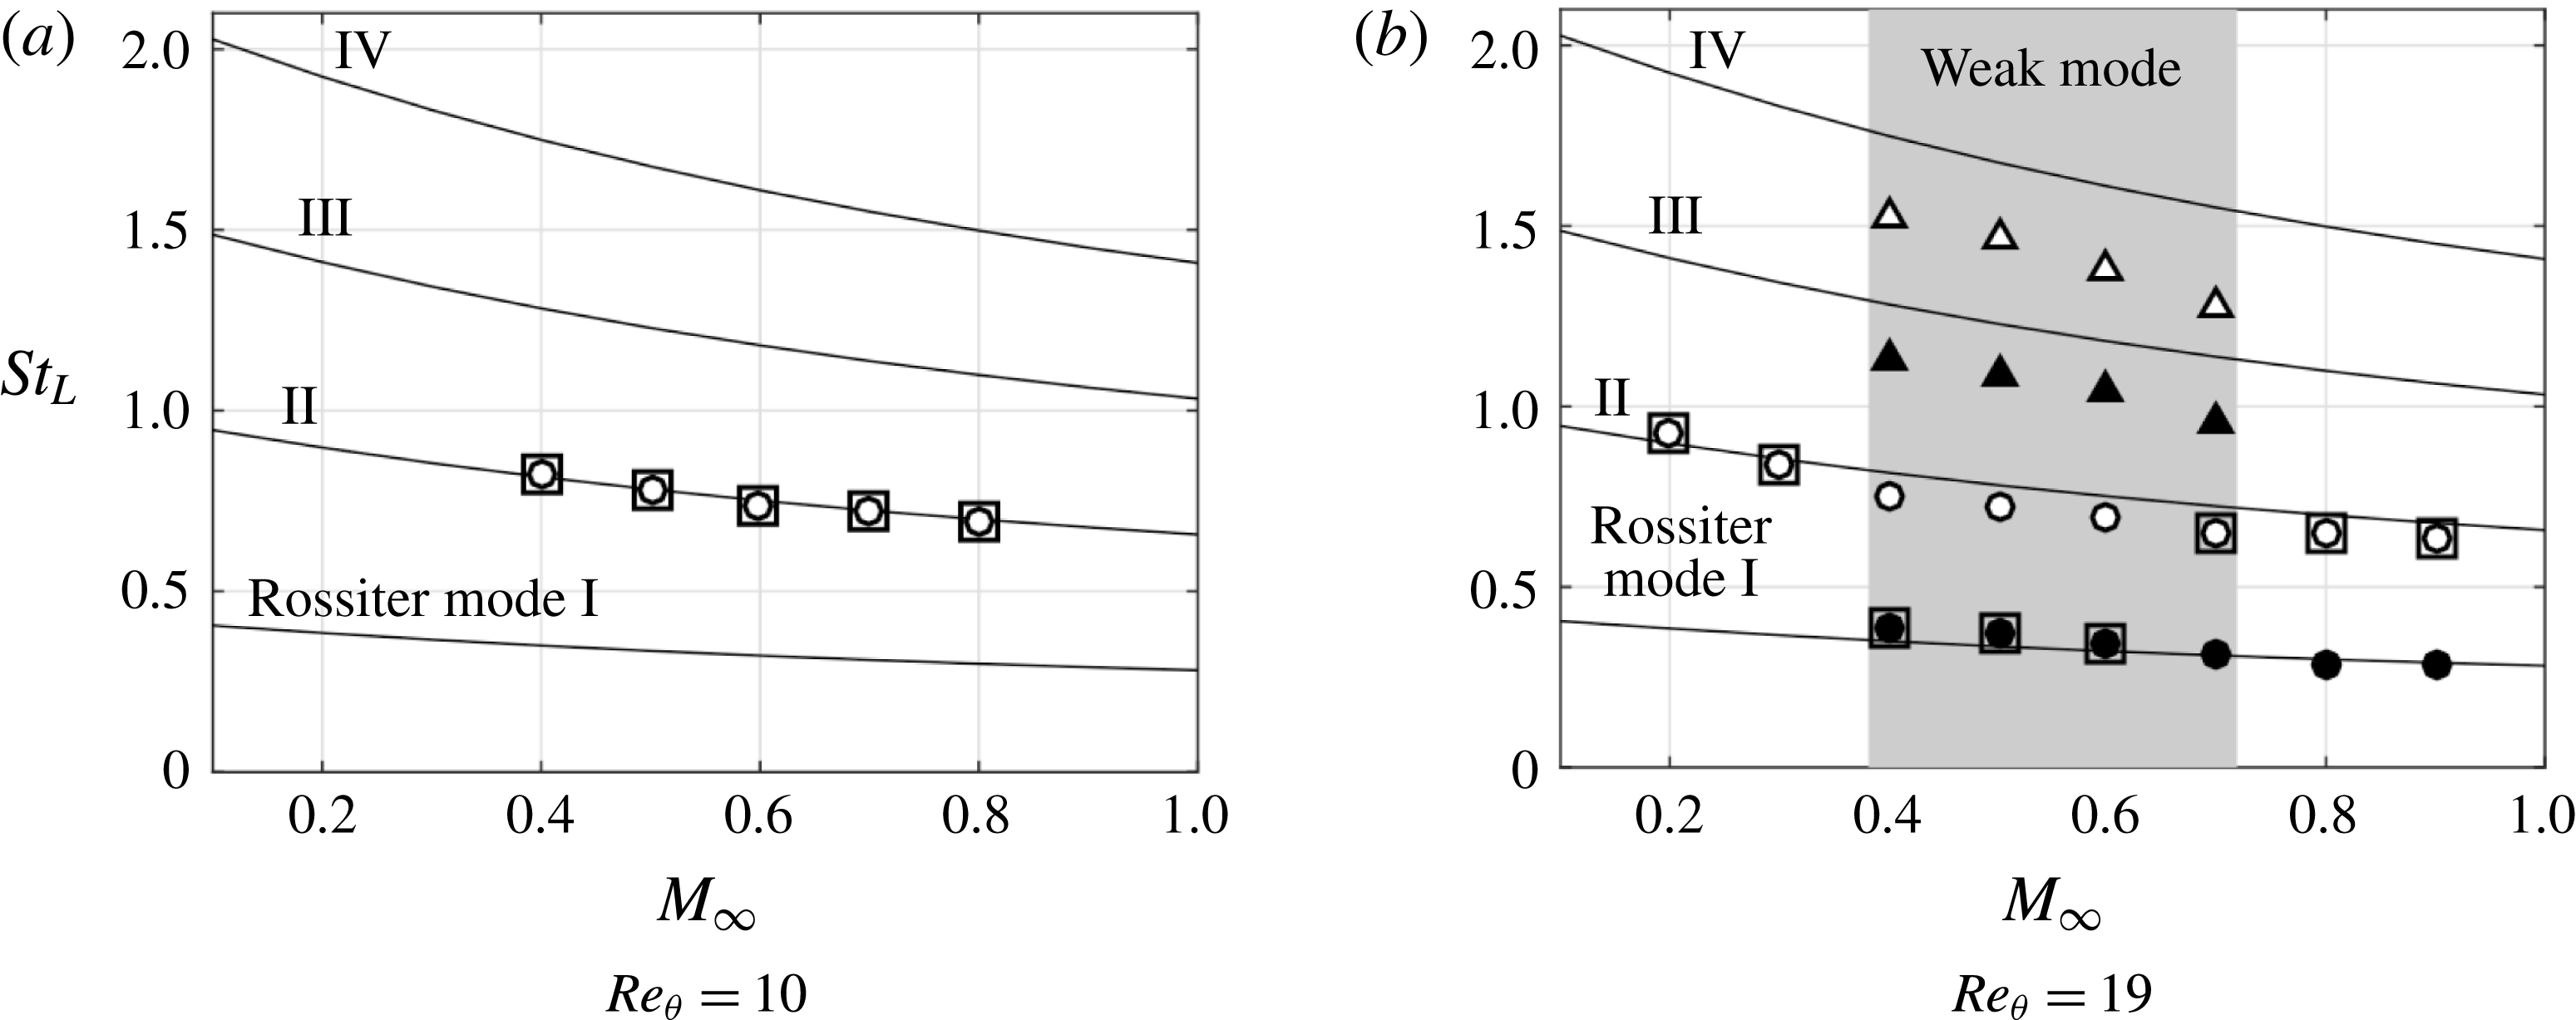
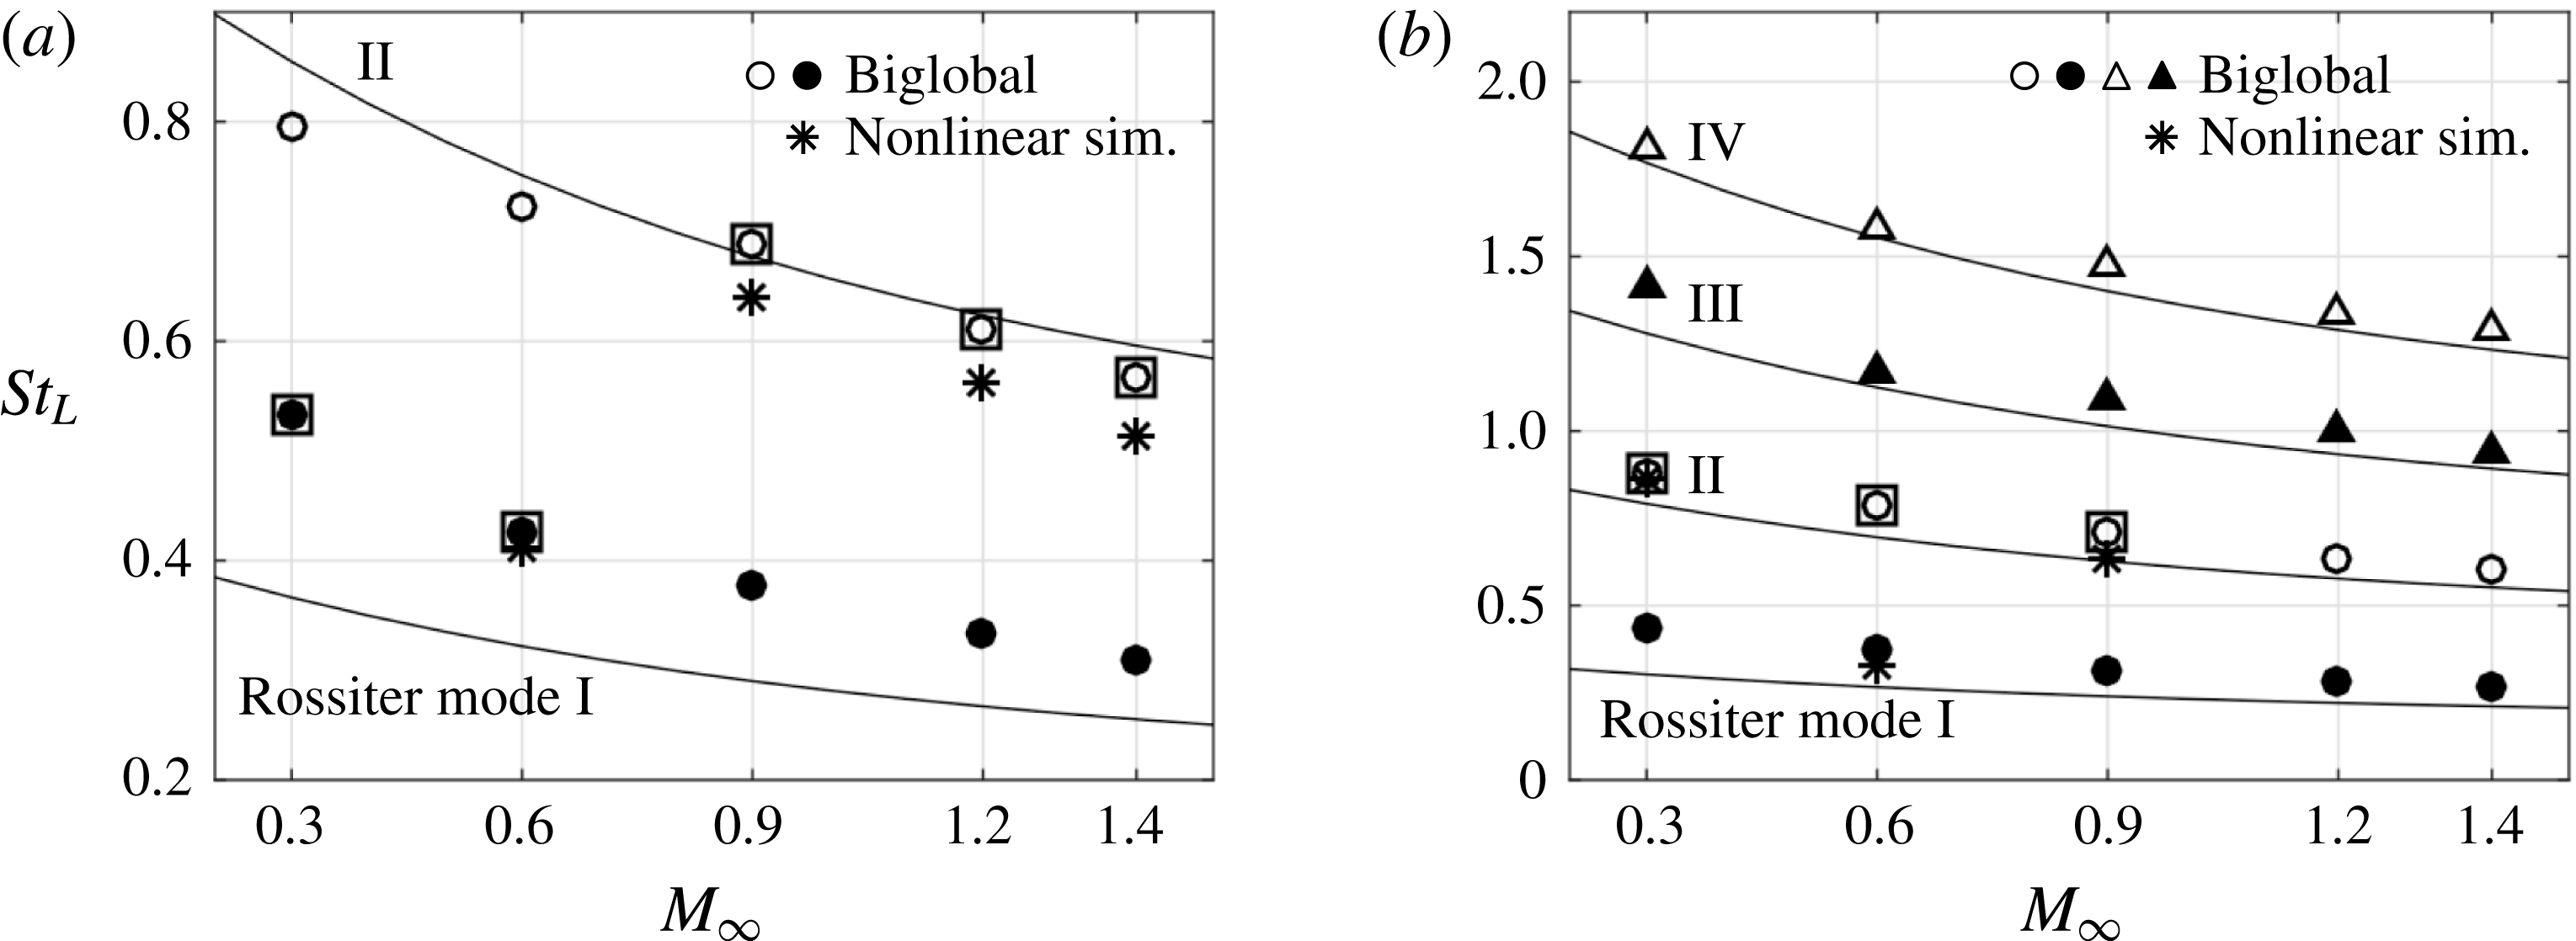
convective units to eliminate the initial transients. For the unstable cases, the extracted oscillation frequencies are compared with Rossiter’s prediction based on the modified formula (Heller & Bliss Reference Heller and Bliss1975), equation (1.1). The dominant and subdominant Rossiter modes as a function of Mach number are presented in figure 9. The frequencies (Strouhal numbers) of the Rossiter modes show a decreasing trend with increasing
 $M_{\infty }$
, which follows the prediction of the semi-empirical formula.
Comparison of
 $St_{L}(=St_{D}\cdot L/D)$
from the classic Rossiter semi-empirical formula, equation (1.1) (solid line) and the present work for
 $L/D=2$
. Rossiter mode I:
 $\bullet$
; mode II: ○. The dominant modes are indicated by ▫. The shaded grey line shows the estimate of the Mach number where the dominant mode shifts.

Comparison of
 $St_{L}(=St_{D}\cdot L/D)$
from the classic Rossiter semi-empirical formula, equation (1.1) (solid line) and present work for
 $L/D=6$
. The wake-mode dominated cases are indicated in the shaded region with
 $M_{\infty }\in [0.4,0.7]$
, while other cases represent shear-layer modes. In the wake-mode dominated flow, symbols
 $\bullet$
, ○, ▴ and ▵ represent wake mode and its harmonics. In the shear-layer mode, these symbols denote Rossiter mode I to IV. The dominant modes are indicated by ▫.

From the previous work by Brès (Reference Brès2007) on
 $L/D=2$
, it was inferred that Rossiter mode I dominates the flow oscillation in the subsonic regime (
 $0.3\leqslant M_{\infty }\leqslant 0.6$
). The present investigation reveals that the dominant Rossiter mode shifts to mode II with an increase in Mach number. This transition indicated by the shaded grey line in figure 9 occurs at progressively lower Mach numbers for higher Reynolds numbers. The dominant mode switching was also observed in the experimental results from Kegerise et al. (Reference Kegerise, Spina, Garg and Catttafesta2004) for cavity with
 $L/D=2$
at a much higher Reynolds number. As shown above in figure 5 at
 $Re_{\unicode[STIX]{x1D703}}=46$
, the acoustic radiation becomes stronger at
 $M_{\infty }=0.8$
, where the dominant Rossiter mode shifts from mode I to II. Thus, it appears that the strong acoustic wave emission can be correlated with Rossiter mode II rather than mode I for the short cavity.
For flow over a cavity with
 $L/D=6$
, the frequencies (Strouhal numbers) of Rossiter mode for
 $Re_{\unicode[STIX]{x1D703}}=10$
and 19 are shown in figure 10. At
 $Re_{\unicode[STIX]{x1D703}}=10$
, Rossiter mode II is the dominant mode and it is the sole mode present. As
 $Re_{\unicode[STIX]{x1D703}}$
increases to 19, the flow is unstable for
 $M_{\infty }=0.2$
and 0.3. Moreover, the wake mode appears in the flows for a range of
 $M_{\infty }\in [0.4,0.7]$
, in which the dominant wake-mode frequency and its harmonics are observed. Although the wake-mode frequencies are close to the value of Rossiter mode frequencies, the features of the flow fields are significantly different from the shear-layer modes. Relating back to the stability diagram in figure 8 of
 $L/D=6$
at
 $Re_{\unicode[STIX]{x1D703}}=19$
, we also find that the flow exhibits a shear-layer mode near the neutral stability boundary. For longer cavity flows with
 $L/D=6$
, there is no dominant Rossiter mode shifting observed in the shear-layer mode cases; and the wake mode dominates the flow at
 $M_{\infty }\in [0.4,0.7]$
.
The analysis performed above reveals the 2-D open-cavity flow physics and the tendency of the flow towards specific Rossiter modes. Noting that the results from this section are obtained from 2-D numerical simulations. In § 4, biglobal stability analysis is employed to gain deeper insights into the flow instabilities for a range of spanwise wavenumbers,
 $\unicode[STIX]{x1D6FD}$
. Two-dimensional global stability can be uncovered with
 $\unicode[STIX]{x1D6FD}=0$
, while spanwise-periodic 3-D global eigenmodes can be revealed by specifying
 $\unicode[STIX]{x1D6FD}>0$
. Because 2-D base states are required for performing the biglobal stability analysis, the results from the above nonlinear simulations serve as the foundation for the subsequent stability analysis, in addition to the unstable steady states discussed below.
3.4 Unstable steady states
A steady-state flow is a time-invariant solution of the Navier–Stokes equations, which can be used as base state in linear stability analysis. This base state might be stable or unstable depending on the flow conditions. Time-averaged flow is obviously time invariant but is not necessarily a solution of the Navier–Stokes equation. Numerical techniques can be used to determine the unstable steady state even if the flow is naturally unstable.
In the present work, the selective frequency damping method (Åkervik et al.
Reference Åkervik, Brandt, Henningson, Hœpffner, Marxen and Schlatter2006) is used to find the unstable steady state for unstable flows with the feedback gain chosen to be
 $\unicode[STIX]{x1D712}=0.1$
. It has been verified that the numerically found time-invariant solutions from the selective frequency damping method are indeed the unstable steady states by substituting them into the Navier–Stokes equations and ensuring that
 $|\dot{q}|<10^{-7}$
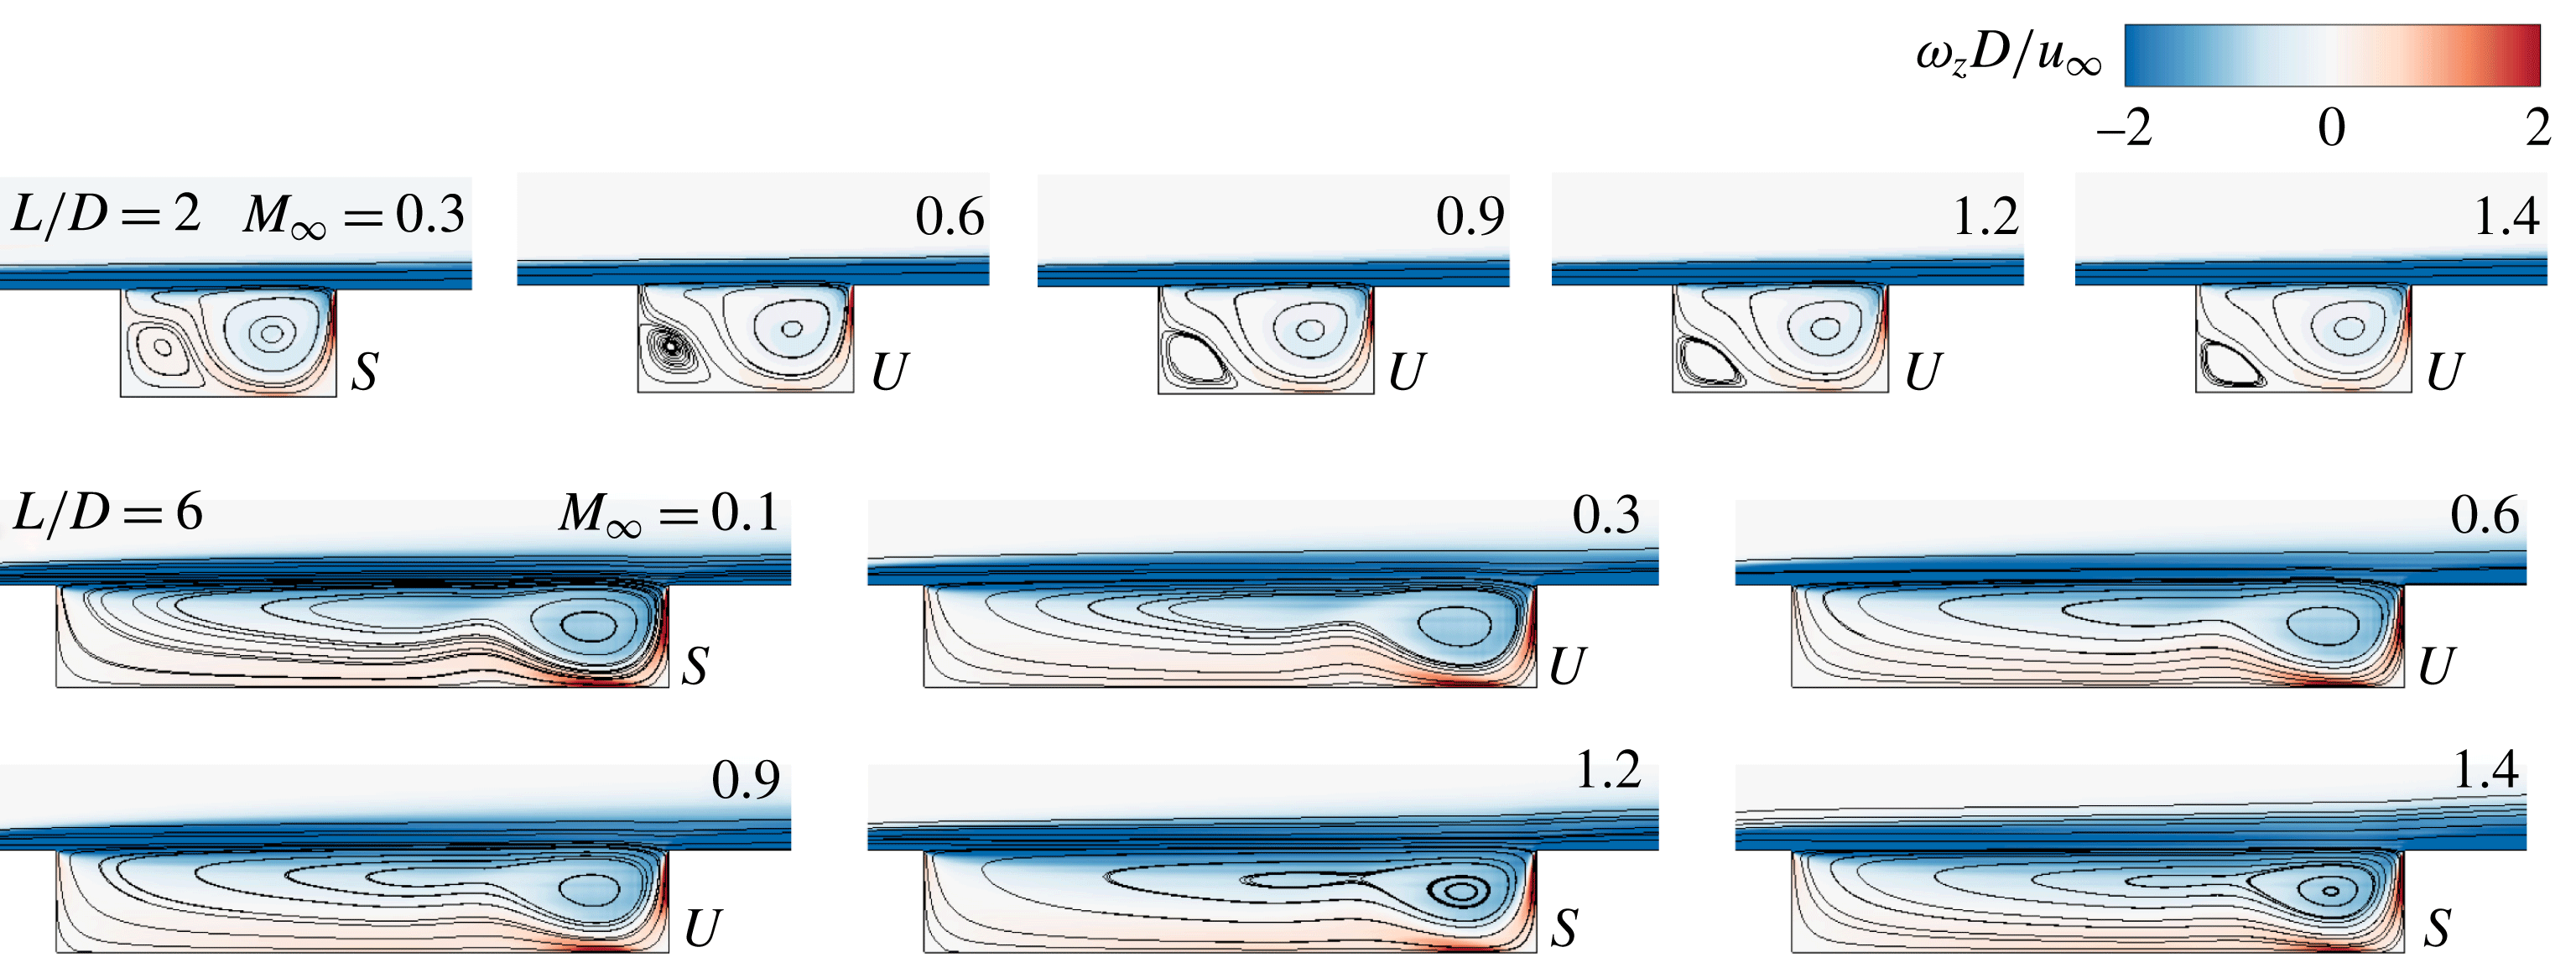
. As shown in figure 11, we find that the unstable steady states remain similar regardless of the Mach number variation in the short cavity (
 $L/D=2$
), exhibiting the same features of the time-averaged streamlines as shown in figure 5. For the cavity with
 $L/D=6$
, all the stable and unstable steady states share similar features regardless of the Mach number, while the time-averaged flow fields vary significantly depending on the Mach number as shown in figure 6. In the present paper, we use these steady states (in figure 11) as the base states to perform global stability analysis.
As we discuss in the next section, we find that the use of the stable/unstable steady states shown in figure 11 as the base states in the biglobal stability analysis yields excellent agreement in the oscillatory features in most of the cases except for a very limited number of cases where the wake mode dominates the flow. For the wake-mode dominated flow (at
 $Re_{\unicode[STIX]{x1D703}}=19$
), the mean flow can also be considered for its use as the base flow, as discussed in our companion work (Sun et al.
Reference Sun, Taira, Cattafesta and Ukeiley2016a
).
Using the stable and unstable steady states, we perform extensive 2-D and 3-D linear global stability analysis. The 2-D and 3-D results are provided below in §§ 4.1 and 4.2, respectively.
Streamlines of stable (
 $S$
)/unstable (
 $U$
) steady state of flows at various Mach number.
 $L/D=2$
:
 $Re_{\unicode[STIX]{x1D703}}=56.8$
;
 $L/D=6$
:
 $Re_{\unicode[STIX]{x1D703}}=19$
. Contours represent vorticity
 $\unicode[STIX]{x1D714}_{z}D/u_{\infty }\in [-2,2]$
.

4 Biglobal stability analysis
4.1 Two-dimensional eigenmodes
 $(\unicode[STIX]{x1D6FD}=0)$

In the biglobal stability analysis, 2-D global eigenmodes can be found by specifying
 $\unicode[STIX]{x1D6FD}=0$
in (2.6) and (2.7), which theoretically translates to the perturbation being associated with infinite wavelength in the spanwise direction. In this section, the stability properties are found for the base states. The eigenvalues
 $\unicode[STIX]{x1D714}=\unicode[STIX]{x1D714}_{r}+\text{i}\unicode[STIX]{x1D714}_{i}$
obtained are reported in the non-dimensional form of the growth/decay rate
 $\unicode[STIX]{x1D714}_{i}D/u_{\infty }$
and frequency
 $St_{L}=\unicode[STIX]{x1D714}_{r}L/2\unicode[STIX]{x03C0}u_{\infty }$
for 2-D eigenmodes while
 $St_{D}=\unicode[STIX]{x1D714}_{r}D/2\unicode[STIX]{x03C0}u_{\infty }$
for spanwise-periodic 3-D eigenmodes.
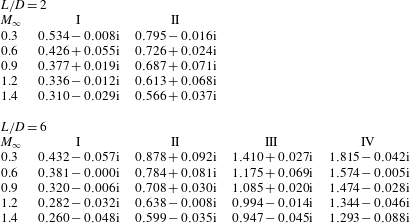
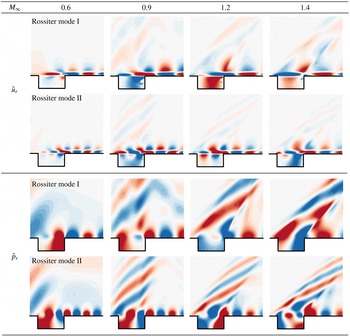
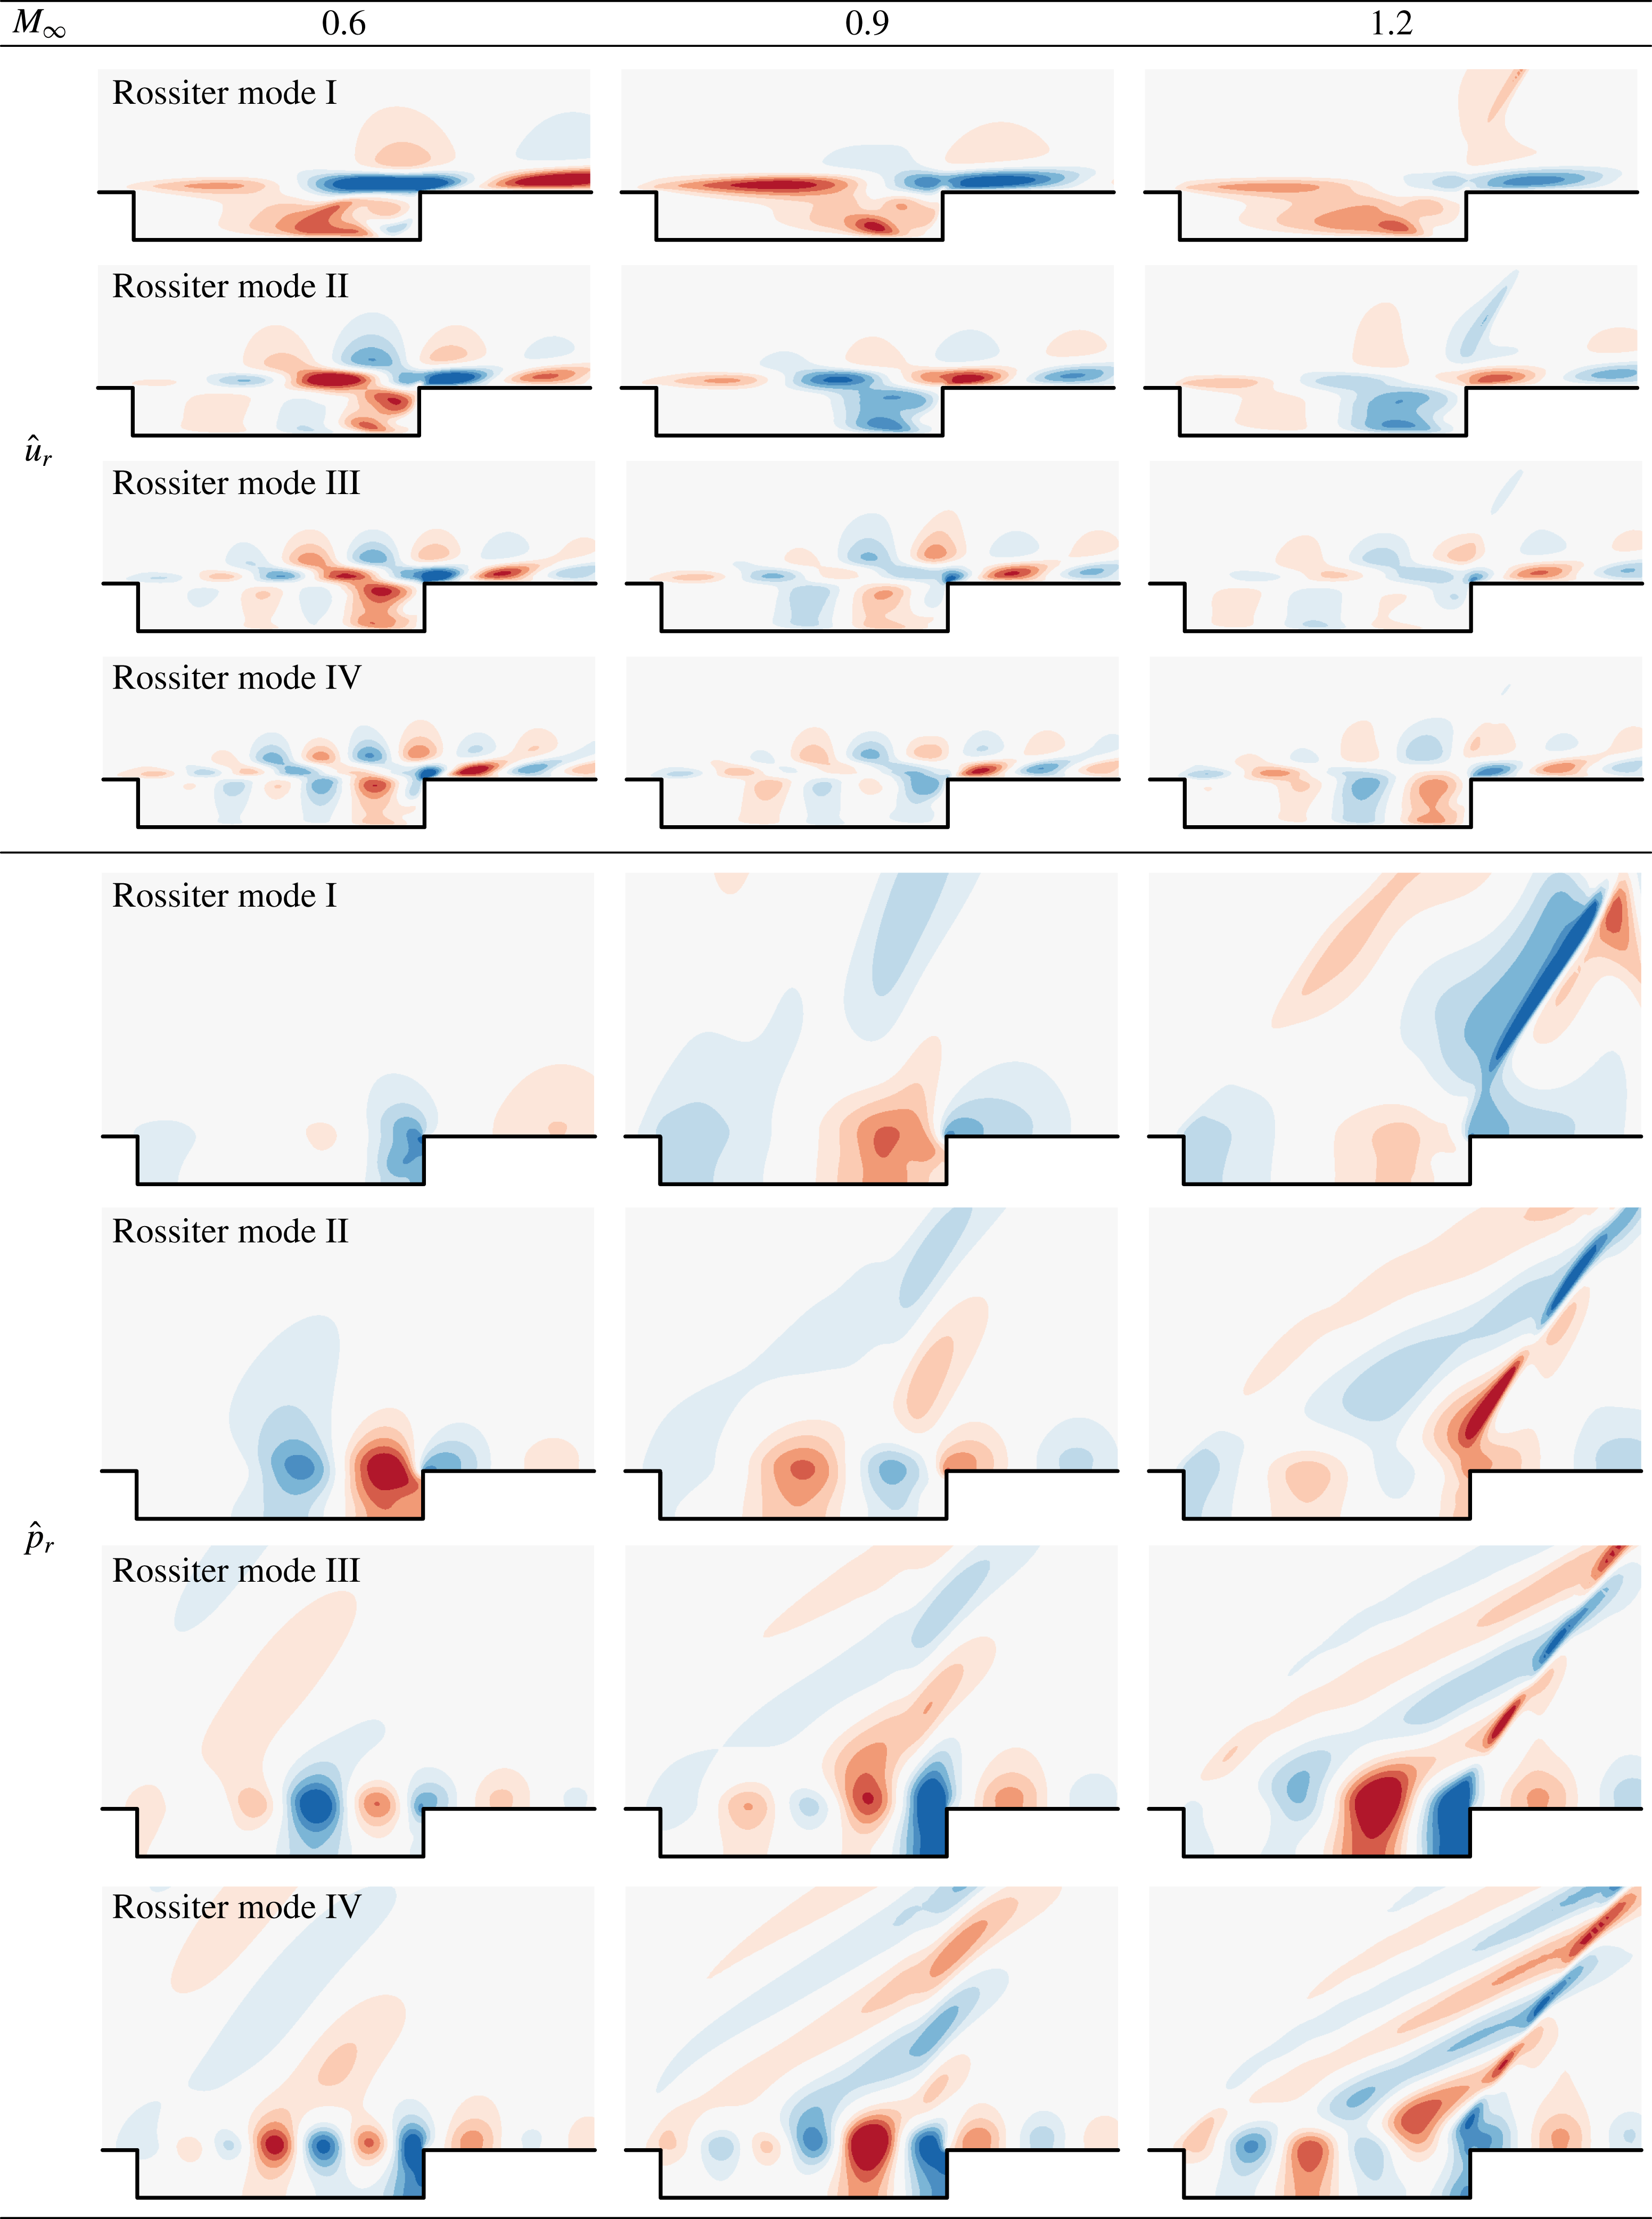
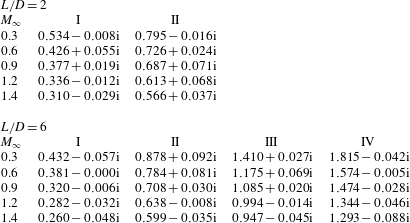
The leading eigenmodes are shear-layer modes whose spatial structures are mainly located in the shear-layer region. Realizing that not all shear-layer modes can be called Rossiter modes, we further check that the frequencies of these shear-layer modes match the Rossiter mode frequencies predicted by the semi-empirical formula. Hence, all the leading eigenmodes herein are associated with Rossiter modes and correspond to shear-layer modes (i.e. Kelvin–Helmholtz instabilities) reported in the works by Yamouni et al. (Reference Yamouni, Sipp and Jacquin2013) and Meseguer-Garrido et al. (Reference Meseguer-Garrido, de Vicente, Valero and Theofilis2014) . The eigenvalues of Rossiter modes are listed in table 4 and their eigenvectors are shown in figures 12 and 13 for
 $L/D=2$
and 6, respectively. As predicted by the semi-empirical formula, an increase in Mach number reduces the flow oscillation frequency. The spatial structure size of Rossiter modes becomes larger as Mach number increases. The spatial structures of higher-order modes exhibits finer spatial scales than those of lower-order modes. The major spatial structures of the velocity eigenmodes
 $\hat{u} _{r}$
have the largest magnitude in the shear layer, which indicates that Rossiter modes are driven by the shear layer of the flow. In the pressure eigenvector contours, there are beam-shaped structures that develop above the cavity. The geometric features of these beams parallel the compression waves previously discussed in figure 5. Based on the results from both 2-D nonlinear simulations and biglobal stability analysis with
 $\unicode[STIX]{x1D6FD}=0$
, it indicates that Rossiter modes are indeed two-dimensional, shear-layer driven instabilities.
Eigenvalues
 $\unicode[STIX]{x1D714}=\unicode[STIX]{x1D714}_{r}+\text{i}\unicode[STIX]{x1D714}_{i}$
associated with Rossiter mode I to IV for
 $\unicode[STIX]{x1D6FD}=0$
are reported in a form of
 $St_{D}(L/D)+\text{i}(\unicode[STIX]{x1D714}_{i}D/u_{\infty })$
at
 $Re_{\unicode[STIX]{x1D703}}=56.8$
. Frequency
 $\unicode[STIX]{x1D714}_{r}$
is normalized as Strouhal number
 $St_{L}=\unicode[STIX]{x1D714}_{r}L/2\unicode[STIX]{x03C0}u_{\infty }$
and growth/decay rate
 $\unicode[STIX]{x1D714}_{i}$
is normalized as
 $\unicode[STIX]{x1D714}_{i}D/u_{\infty }$
.
Spatial structures of the real component of the eigenmodes
 $\hat{u}$
and
 $\hat{p}$
for cavity of
 $L/D=2$
at
 $Re_{\unicode[STIX]{x1D703}}=56.8$
.

Spatial structures of the real component of the eigenmodes
 $\hat{u}$
and
 $\hat{p}$
for cavity of
 $L/D=6$
at
 $Re_{\unicode[STIX]{x1D703}}=19$
.

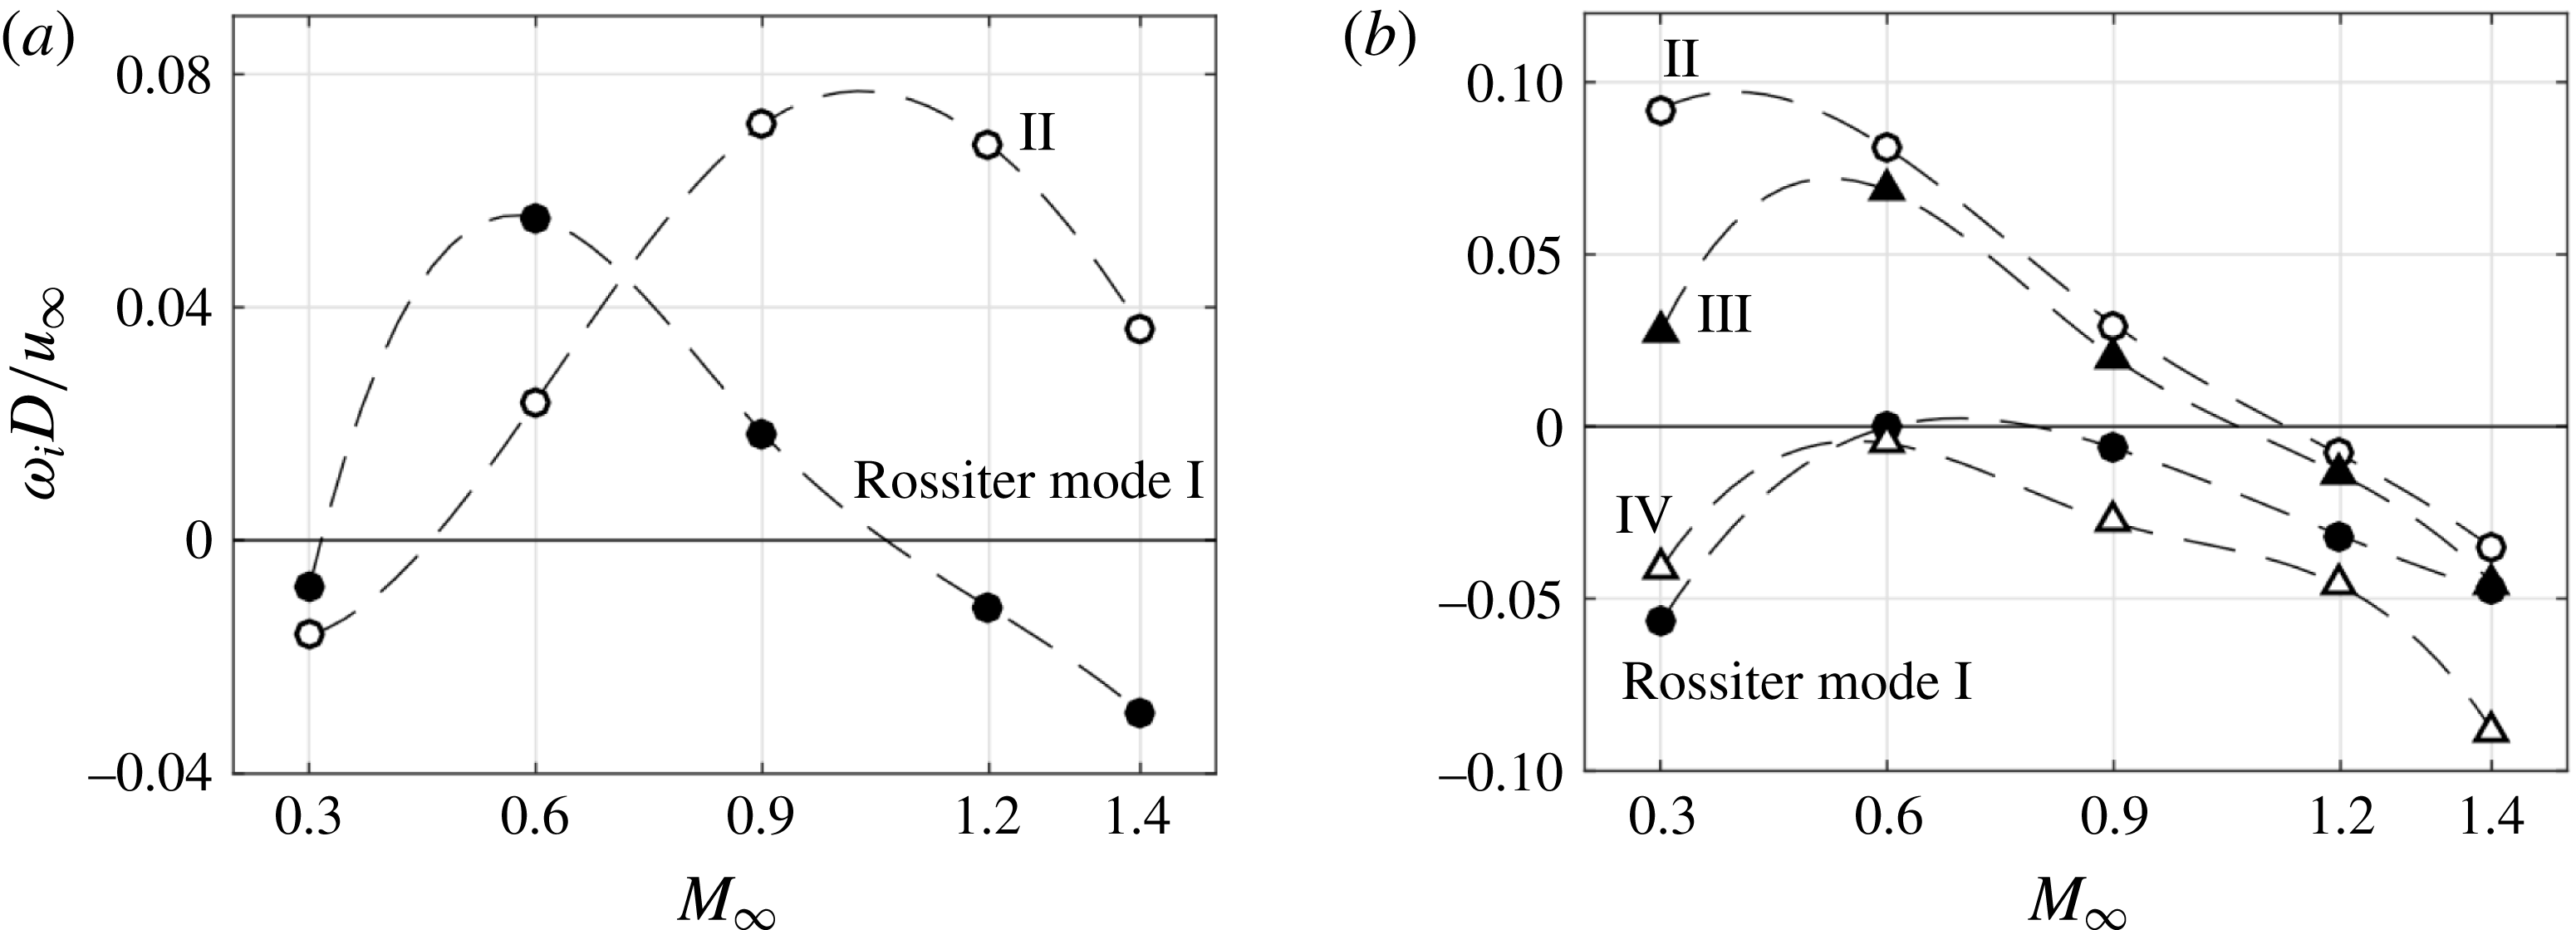
From the discussion in § 3.3 (and figures 9 and 10), the flow instability and dominant Rossiter mode shift with free stream Mach number. In the biglobal stability analysis, the growth/decay rate
 $\unicode[STIX]{x1D714}_{i}D/u_{\infty }$
over
 $M_{\infty }$
is presented in figure 14. For cavity with
 $L/D=2$
, the growth/decay rates of Rossiter modes I and II increase as Mach number changes from 0.3 to 0.6. However, when
 $M_{\infty }$
reaches the transonic regime, the values of growth rate show a decreasing trend. The growth rate for Rossiter mode I peaks around
 $M_{\infty }=0.6$
and is surpassed by the growth rate of Rossiter mode II around
 $M_{\infty }=0.7$
, which reaches its peak near
 $M_{\infty }=1$
. This cross-over point corresponds to the shift from Rossiter mode I to mode II seen in figure 9(b). This peaking trends of growth/decay rates of Rossiter modes are also observed for the flows over cavity with
 $L/D=6$
. The growth rate of the eigenmode negatively correlating to the increase in free stream Mach number (
 $M_{\infty }>0.6$
) can be related to the behaviour of the neutral stability curve in the nonlinear stability diagrams shown in figure 8. Both stability diagrams indicate that an increase of Mach number in the subsonic regime (
 $M_{\infty }<0.6$
) destabilizes the flow, but over the transonic regime, an increase of Mach number (
 $M_{\infty }>0.6$
) stabilizes the flow. Furthermore, in the cases of
 $L/D=2$
and
 $M_{\infty }=0.3$
, as shown in figure 14, the values of
 $\unicode[STIX]{x1D714}_{i}D/u_{\infty }$
are both negative. In other words, disturbances related to Rossiter modes I and II decay in the base flow, which matches the result from the stability diagram in figure 8 that the flow is stable. This agreement is also noticed in the cases of cavity with
 $L/D=6$
at
 $M_{\infty }=1.2$
and 1.4.
Growth/decay rates of Rossiter modes as a function of free stream Mach number determined from biglobal stability analysis with
 $\unicode[STIX]{x1D6FD}=0$
. (a)
 $L/D=2$
,
 $Re_{\unicode[STIX]{x1D703}}=56.8$
; (b)
 $L/D=6$
,
 $Re_{\unicode[STIX]{x1D703}}=19$
. Rossiter mode I:
 $\bullet$
; mode II: ○; mode III: ▴ and mode IV: ▵.

Dominant Rossiter modes captured from the 2-D nonlinear simulations and the biglobal stability analysis. (a)
 $L/D=2$
,
 $Re_{\unicode[STIX]{x1D703}}=56.8$
; (b)
 $L/D=6$
,
 $Re_{\unicode[STIX]{x1D703}}=19$
. Rossiter mode I:
 $\bullet$
; mode II: ○; mode III: ▴ and mode IV: ▵. The dominant Rossiter modes from the biglobal stability analysis and the nonlinear simulations are indicated by ▫ and
 $\ast$
, respectively.

From the growth/decay rate trend shown in figure 14, we compare the Rossiter mode with the largest growth/decay rate at each Mach number to the dominant Rossiter mode observed from the 2-D nonlinear simulations, which can explain the mode shifting presented in figures 9 and 10. In figure 15, the dominant Rossiter mode captured from linear stability analysis and nonlinear DNS discussed in § 3 are compared. In almost all cases, there is excellent agreement in the dominant Rossiter mode with respect to Mach number. At
 $M_{\infty }=0.6$
and
 $L/D=6$
, the dominant Rossiter mode from biglobal stability analysis deviates from that in the DNS in which the wake mode is dominant. Moreover, the eigenvector shown in figure 13 at
 $M_{\infty }=0.6$
resembles more closely the Rossiter modes instead of the wake mode revealed from the 2-D DNS. For this particular case, we further investigate the wake mode in our companion paper (Sun et al.
Reference Sun, Taira, Cattafesta and Ukeiley2016a
). By the observation that the mean (time-averaged) flow and unstable steady state are significantly different in this wake-mode dominated flow, biglobal stability analysis was performed using both states (mean flow and unstable steady state) as base states. When the mean flow is prescribed as the base state, the wake-mode eigenmode is captured by the linear stability analysis, which can also predict its frequency with only 4 % difference between that and the wake-mode frequency determined from the 2-D DNS. It should be mentioned that in the linear stability theory, the nonlinear interactions among modes are neglected. There is however a strong nonlinear dynamical process in the wake-mode dominated flow, making the mean greatly deviate from the unstable steady state. Hence, the use of the mean flow as the base flow is necessary for uncovering the wake mode.
4.2 Three-dimensional eigenmodes
$(\unicode[STIX]{x1D6FD}\neq 0)$

In this section, we discuss characteristics of the 3-D global instability modes with finite wavelength
 $\unicode[STIX]{x1D706}/D=2\unicode[STIX]{x03C0}/\unicode[STIX]{x1D6FD}$
in the spanwise direction prescribed in (2.6). The analyses performed for the 3-D instabilities are analogous to those for the 2-D cases shown in the previous section. In what follows, the spanwise wavelength
 $\unicode[STIX]{x1D706}/D$
is set in a range of 0.5–2.0 following Brès & Colonius (Reference Brès and Colonius2008). Note that the 3-D instabilities discussed in this section represent spanwise-periodic 3-D instabilities with selected wavenumbers
 $\unicode[STIX]{x1D6FD}$
.
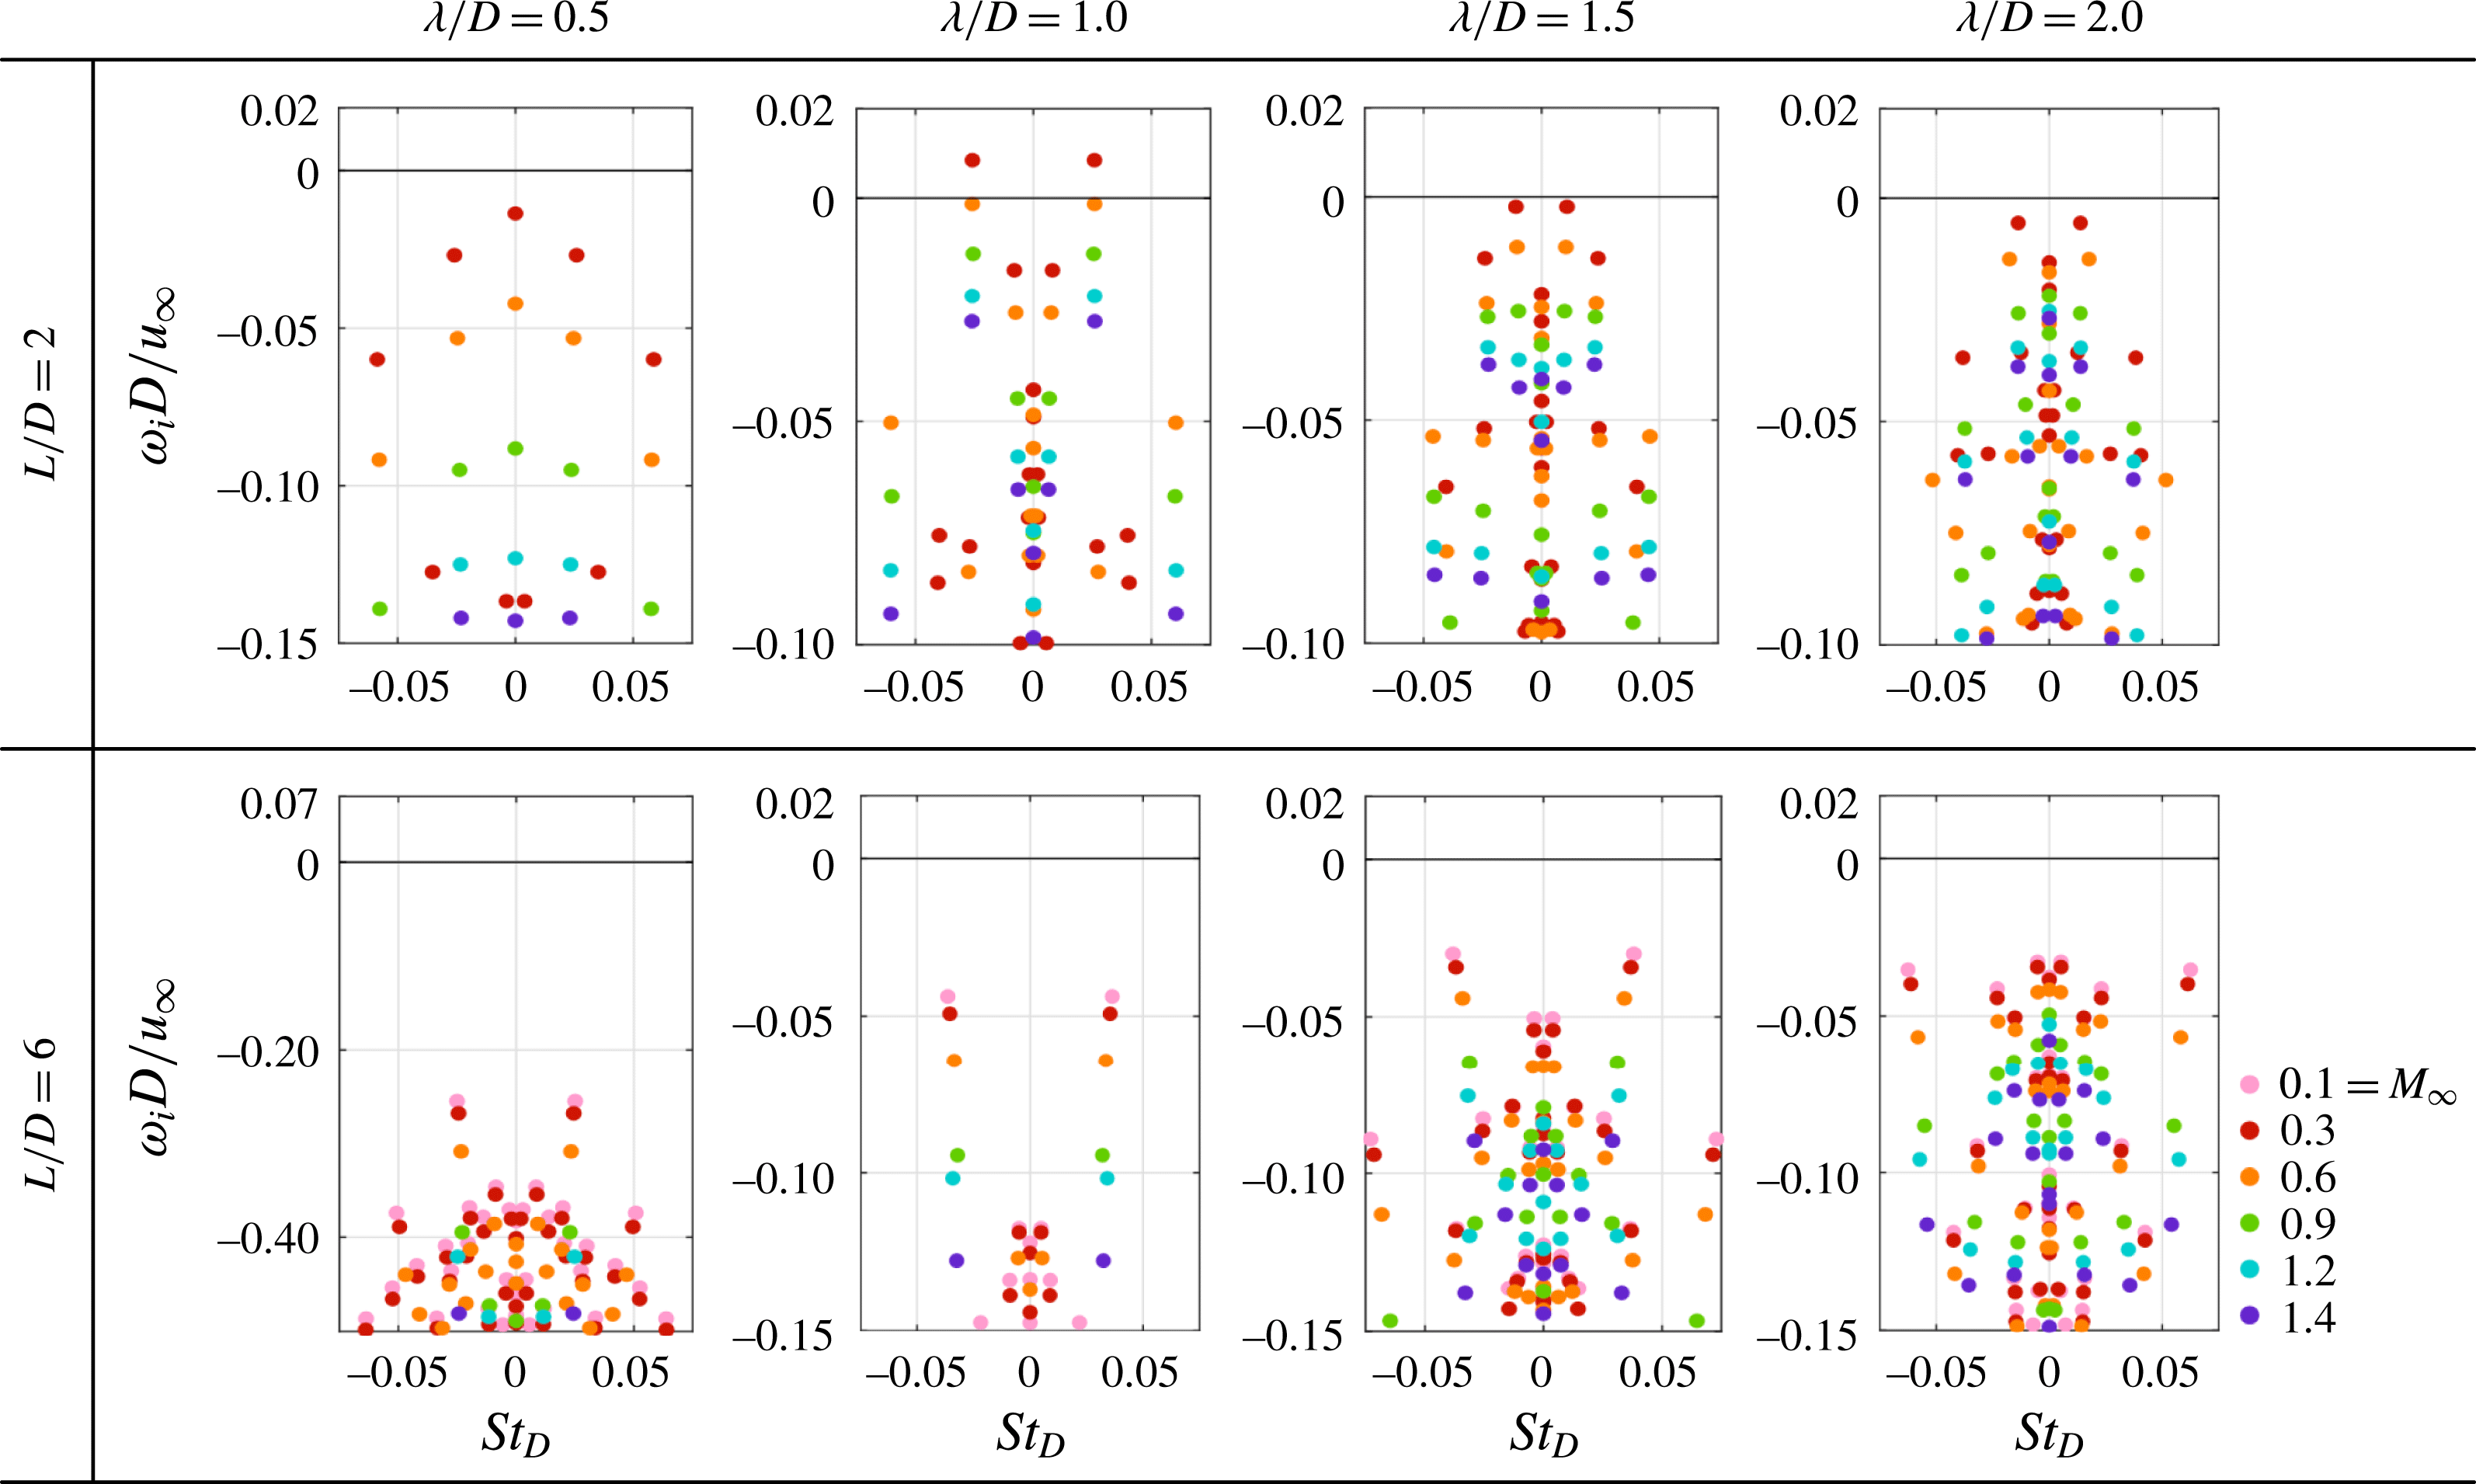
The eigenspectra of the 3-D eigenmodes for
 $L/D=2$
and 6 are presented in figure 16. It should be noted that the eigenspectra are only shown in the vicinity of the origin. For the
 $L/D=2$
cavity flows at
 $Re_{\unicode[STIX]{x1D703}}=56.8$
, unstable 3-D modes are only observed in the subsonic cases of
 $M_{\infty }=0.3$
with
 $\unicode[STIX]{x1D706}/D=1.0$
, while all other 3-D eigenmodes with higher Mach number (
 $M_{\infty }\geqslant 0.6$
) are stable. For
 $L/D=6$
cases at
 $Re_{\unicode[STIX]{x1D703}}=19$
, all the 3-D eigenmodes captured are stable. Below, the effects of cavity geometry, Mach number and spanwise wavelength
 $\unicode[STIX]{x1D706}/D$
on the most unstable/least stable (dominant) 3-D modes are further examined.
Eigenspectra of the 3-D eigenmodes for cavity with
 $L/D=2$
(
 $Re_{\unicode[STIX]{x1D703}}=56.8$
) and 6 (
 $Re_{\unicode[STIX]{x1D703}}=19$
) with
 $M_{\infty }\in [0.1,1.4]$
and
 $\unicode[STIX]{x1D706}/D\in [0.5,2.0]$
.

Based on eigenspectra shown in figure 16, the eigenvalue of the most unstable/least stable eigenmode for each Mach number is extracted and plotted as a function of spanwise wavelength
 $\unicode[STIX]{x1D706}/D$
in figures 17 and 18. For both cavity geometries, the overall trends of growth/decay rates are similar regardless of
 $M_{\infty }$
. An increase in Mach number stabilizes all the dominant 3-D eigenmodes. For each Mach number, the growth/decay rate
 $\unicode[STIX]{x1D714}_{i}D/u_{\infty }$
of the dominant 3-D eigenmode is a function of
 $\unicode[STIX]{x1D706}/D$
. To identify the 3-D eigenmode properties, their frequencies and spatial structures can distinguish the modes based on types of instabilities.
We follow the nomenclature used by Brès & Colonius (Reference Brès and Colonius2008) for the leading modes in figures 17 and 18. As shown in figure 17 for cavity with
 $L/D=2$
, the leading eigenmode with
 $\unicode[STIX]{x1D706}/D=0.5$
is mode i with
 $St_{D}=0$
(referred to as mode i by Brès & Colonius (Reference Brès and Colonius2008)) except at
 $M_{\infty }=1.4$
. The dominant 3-D mode at
 $M_{\infty }=1.4$
is mode ii, a travelling mode discussed next. However, its decay rate is close to that of a stationary mode as shown in figure 16. The eigenmodes with
 $\unicode[STIX]{x1D706}/D\in [0.75,1.25]$
are travelling modes with
 $St_{D}\approx 0.025$
(referred to as mode ii by Brès & Colonius (Reference Brès and Colonius2008)). For each of
 $\unicode[STIX]{x1D706}/D\leqslant 1.25$
, the frequency,
 $St_{D}$
, of all the dominant 3-D modes are independent of Mach number, but these 3-D modes can be stabilized by increasing
 $M_{\infty }$
as mentioned above. However, the frequencies of the dominant 3-D modes exhibit a sudden decrease near
 $\unicode[STIX]{x1D706}/D=1.5$
, and the modes exhibit different branches for larger
 $\unicode[STIX]{x1D706}/D$
(
 ${\geqslant}1.75$
) depending on Mach numbers. As shown in figure 17, for the flows at
 $0.3\leqslant M_{\infty }\leqslant 0.6$
, the dominant modes are travelling modes with
 $St_{D}\approx 0.015$
(referred to as mode iii by Brès & Colonius (Reference Brès and Colonius2008)), while for the transonic flows at
 $0.9\leqslant M_{\infty }\leqslant 1.4$
, the dominant modes are stationary. Moreover, we indicate the transitions of dominant modes over the spanwise wavelength in figure 17 by grey regions. As the wavelength of the 3-D eigenmode is increased from 0.5 to 2, in general, the dominant 3-D mode shifts from stationary to travelling mode and back to stationary mode. This phenomenon was also reported by de Vicente et al. (Reference de Vicente, Basley, Meseguer-Garrido, Soria and Theofilis2014) on incompressible cavity flows that the dominant 3-D mode can arise from different instabilities in terms of its spanwise wavelength.
Eigenvalues of the dominant 3-D modes as a function of
 $M_{\infty }$
and spanwise wavelength
 $\unicode[STIX]{x1D706}/D$
for cavity with
 $L/D=2$
at
 $Re_{\unicode[STIX]{x1D703}}=56.8$
. (a) Growth/decay rate
 $\unicode[STIX]{x1D714}_{i}D/u_{\infty }$
; (b) frequency
 $St_{D}$
. Results from Brès & Colonius (Reference Brès and Colonius2008) and de Vicente et al. (Reference de Vicente, Basley, Meseguer-Garrido, Soria and Theofilis2014) are also compared to the present results. The grey regions represent the transitions of dominant modes.

Eigenvalues of the dominant 3-D modes as a function of
 $M_{\infty }$
and spanwise wavelength
 $\unicode[STIX]{x1D706}/D$
for cavity with
 $L/D=6$
at
 $Re_{\unicode[STIX]{x1D703}}=19$
. (a) Growth/decay rate
 $\unicode[STIX]{x1D714}_{i}D/u_{\infty }$
; (b) frequency
 $St_{D}$
. The grey regions represent the transitions of dominant modes.

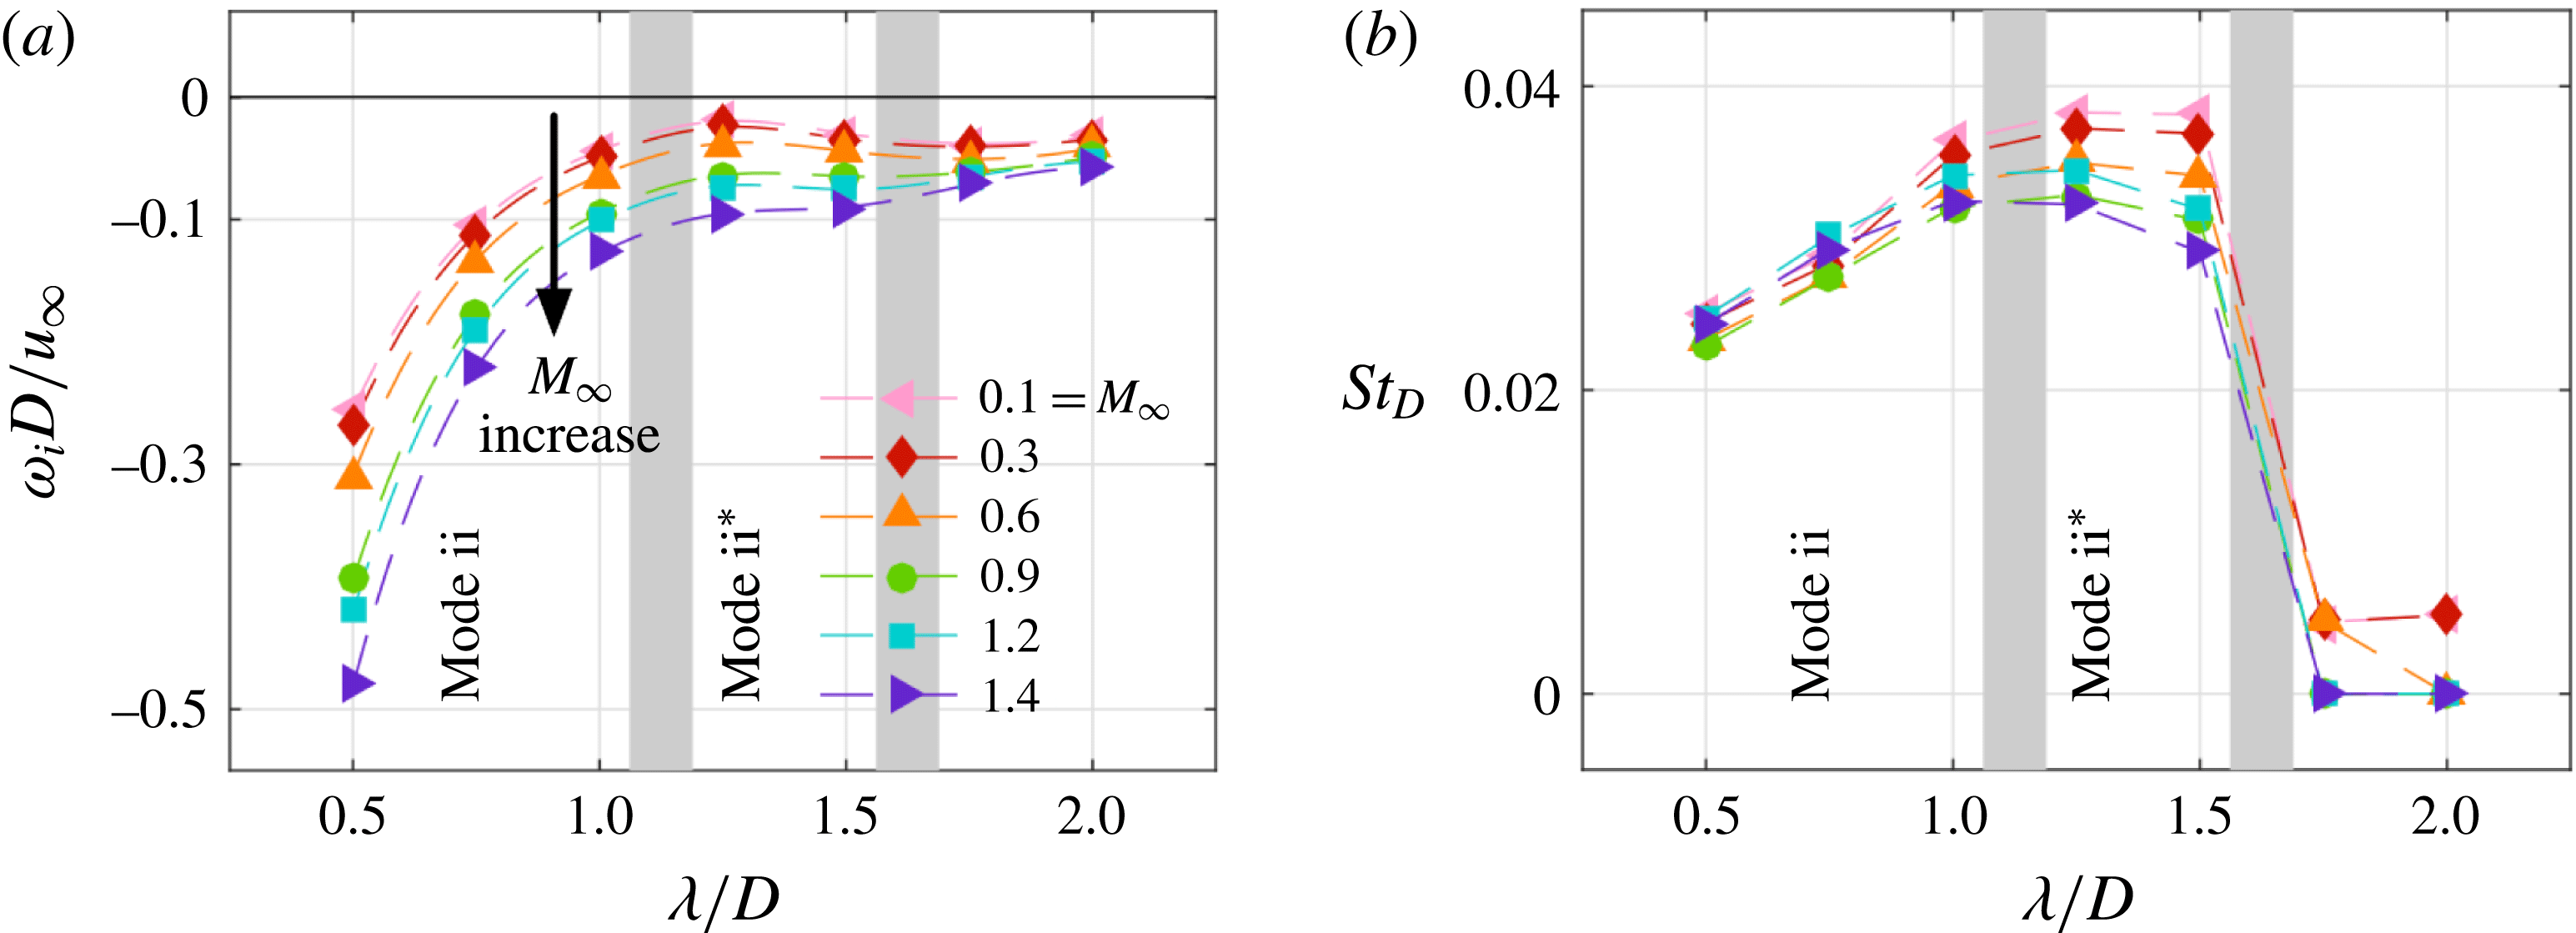
For the eigenvalues in the case of a cavity with
 $L/D=6$
presented in figure 18, the dominant 3-D mode with
 $\unicode[STIX]{x1D706}/D=0.5$
is the travelling mode or mode ii (
 $St_{D}\approx 0.025$
) as mentioned above for the case of short cavity. We further note that the dominant mode has characteristics of mode ii type, as we later discuss in the spatial structures of the eigenmodes (in figure 19). The dominant 3-D modes with
 $\unicode[STIX]{x1D706}/D=0.75$
and 1.0 have higher frequencies compared to that of smaller wavelengths, but their eigenvectors still share similarities, as shown later. There is another mode having frequency
 $St_{D}\in [0.03,0.04]$
with
 $\unicode[STIX]{x1D706}/D=1.25$
and 1.5, which is denoted as mode
 $\text{ii}^{\ast }$
due to the variation in both frequency and eigenvector compared to mode ii. As
 $\unicode[STIX]{x1D706}/D$
increases from 1.5 to 1.75, the dominant mode changes from a travelling mode to a stationary mode. With
 $\unicode[STIX]{x1D706}/D=1.75$
and 2.0, there is similarity to the cases of short cavity, in which the dominant 3-D modes are nearly stationary. For the subsonic flows with
 $0.1\leqslant M_{\infty }\leqslant 0.6$
, these 3-D modes possess non-zero frequencies, but with relatively small
 $St_{D}$
compared to the other travelling modes. A decreasing trend in the growth/decay rates at
 $\unicode[STIX]{x1D706}/D=1.5$
is observed as shown in figure 18, which is similar to those captured for the short cavity. However, the possible mode transitions in the region of
 $0.5\leqslant \unicode[STIX]{x1D706}/D\leqslant 1.5$
is not distinctly clear based on the properties of the eigenvalues, which is further discussed below.
Iso-surface of eigenvectors of the least stable 3-D eigenmodes at
 $M_{\infty }=0.9$
and spanwise wavelength
 $\unicode[STIX]{x1D706}/D\in [0.5,2.0]$
. The values selected to show the iso-surface of
 $\hat{u} _{r}/u_{\infty }$
are indicated below each panel. Red and blue colours represent the indicated positive and negative values, respectively.

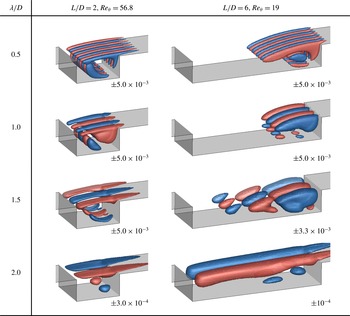
The spatial structures of the dominant 3-D eigenmodes are illustrated in figure 19 for different values of
 $\unicode[STIX]{x1D706}/D$
. For the short cavity with
 $L/D=2$
, the eigenvectors obtained for all Mach numbers considered are similar in terms of the spatial structures. For all values of
 $\unicode[STIX]{x1D706}/D$
considered, the eigenvectors show variations in the aft part of the cavity where the major recirculation zone is located as shown in the unstable steady states shown in figure 11, while their structures are also present in the shear-layer region of the flows. Brès & Colonius (Reference Brès and Colonius2008) examined the 3-D instabilities as well at
 $M_{\infty }=0.3$
and argued that these 3-D modes result from the centrifugal instability of the recirculation in the base flows.
For the cavity with
 $L/D=6$
, the spatial structures of the dominant 3-D eigenmodes also appear independent of the Mach number, as in the case of
 $L/D=2$
. As shown in figure 19, in the cases of
 $\unicode[STIX]{x1D706}/D=0.5$
and 1.0, the spatial structures of mode ii are located in the rear part of the cavity, which exhibit similar features to those presented in the shorter cavity, but with the eigenmodes extending upstream along the shear layer. The spatial structures of mode
 $\text{ii}^{\ast }$
(
 $\unicode[STIX]{x1D706}/D=1.5$
) align along the floor from the rear towards the mid-region of the cavity, which is significantly different from the mode ii that stems from centrifugal instabilities. The streamwise-stretched recirculation pattern in the unstable steady state shown in figure 11 appears due to the large aspect ratio of the long cavity. This elongated recirculating flow is likely the reason for the formation of the mode
 $\text{ii}^{\ast }$
, which explains the absence of mode
 $\text{ii}^{\ast }$
in the short cavity flows. For the stationary mode for
 $\unicode[STIX]{x1D706}/D=2.0$
, its spatial structure covers the entire length of the cavity. Although the frequency of the 3-D mode with
 $\unicode[STIX]{x1D706}/D=2.0$
in the subsonic regime (
 $M_{\infty }=0.1-0.6$
) is not exactly zero, the eigenvectors still share similar features to the stationary mode. The spatial structures of 3-D instability modes appear to be strongly influenced by their spanwise wavelengths in the long cavity cases, and the leading eigenmode can be a travelling or stationary mode depending on
 $\unicode[STIX]{x1D706}/D$
.
In the work by Liu et al. (Reference Liu, Gómez and Theofilis2016) that side wall effects are considered with triglobal stability analysis for incompressible cavity flow with
 $L/D=6$
, they concluded that shear-layer instability is dominant in finite-span cavity flow. This is also observed in the present study on spanwise homogeneous cavity flow at
 $M_{\infty }=0.3$
that the most unstable mode is found to be the shear-layer mode (Rossiter mode), while centrifugal instability modes are stable. The major difference appears in the spatial structure of shear-layer mode due to cavity geometries; a narrow finite-span cavity in their work and a spanwise homogeneous cavity in the present work.
Time histories of streamwise velocity perturbation
 $u^{\prime }/u_{\infty }$
collected by a probe located at
 $x/D=1$
,
 $y/D=0$
,
 $z/D=1$
are shown on the left. The corresponding Fourier spectra are presented on the right. (a) 2-D DNS and (b) 3-D DNS (
 $W/D=2$
) for
 $L/D=2$
,
 $Re_{\unicode[STIX]{x1D703}}=56.8$
and
 $M_{\infty }=0.6$
.

4.3 Comparison with DNS
Next, let us compare our findings from linear stability analysis with those from DNS. Three-dimensional DNS with
 $W/D=2$
are performed at
 $M_{\infty }=0.6$
for both short and long cavities. For the cavity with
 $L/D=2$
(
 $Re_{\unicode[STIX]{x1D703}}=56.8$
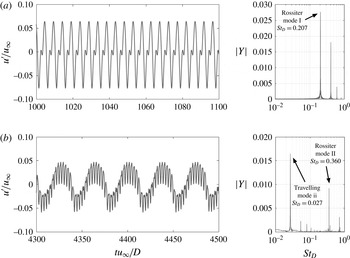
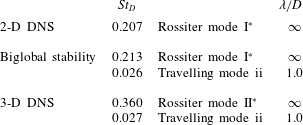
), Fourier spectra of velocity are shown in figure 20. The comparison of dominant frequencies,
 $St_{D}$
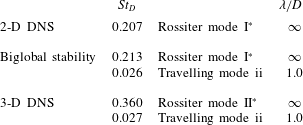
, obtained from DNS and biglobal stability analysis are listed in table 5. In the 3-D DNS of
 $L/D=2$
, the dominant 2-D mode is Rossiter mode II. However, in 2-D DNS and biglobal stability analysis with
 $\unicode[STIX]{x1D706}/D=\infty$
, the Rossiter mode I is the dominant mode. By performing the simulation over a sufficiently long time, the travelling mode with
 $St_{D}=0.027$
at
 $\unicode[STIX]{x1D706}/D=1.0$
is observed in the 3-D DNS. Its properties have excellent agreement to those of the leading 3-D mode shown in figure 17, in which mode ii with
 $\unicode[STIX]{x1D706}/D=1.0$
has the largest
 $\unicode[STIX]{x1D714}_{i}D/u_{\infty }=-0.0013$
among all the
 $\unicode[STIX]{x1D706}/D$
considered. Although this mode has negative growth rate, in the 3-D nonlinear simulation, unstable 2-D Rossiter mode and 3-D modes could interact via nonlinearities and result in the existence of the 3-D mode in the nonlinear flows, especially when the eigenvalue is close to the neutral stability line (
 $\unicode[STIX]{x1D714}_{i}D/u_{\infty }=0$
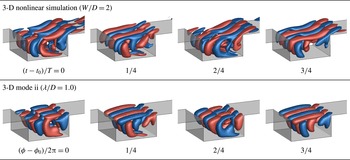
). The comparison of the 3-D spatial structures of nonlinear flow and travelling mode ii are displayed in figure 21, where instantaneous flow fields and eigenmode with a quarter period interval are presented. Mode ii shown in figure 21 has qualitatively similar spatial structures to the eigenfunction of Mode I found by Meseguer-Garrido et al. (Reference Meseguer-Garrido, de Vicente, Valero and Theofilis2014) at a similar incompressible flow condition. In their work, this mode is unstable in incompressible conditions. In contrast, mode ii is slightly stable in the present work at
 $M_{\infty }=0.6$
, which agrees with the discussion in § 4.3 that an increase in Mach number can stabilize 3-D eigenmodes. The iso-surface of spanwise velocity
 $w/u_{\infty }$
from nonlinear simulation exhibits comparable structures to those of mode ii. In particular, the 2-D Rossiter mode also appears in the nonlinear DNS, in which streamwise distortions of the spatial structures are observable in the shear-layer region.
Comparison of the iso-surface of the spanwise velocity
 $w/u_{\infty }=\pm 0.013$
from the 3-D nonlinear simulation and
 ${\hat{w}}/u_{\infty }=\pm 0.03$
from the dominant 3-D eigenmode with
 $\unicode[STIX]{x1D706}/D=1.0$
for the cavity with
 $L/D=2$
at
 $M_{\infty }=0.6$
and
 $Re_{\unicode[STIX]{x1D703}}=56.8$
. Represented by
 $T$
is the time period of the 3-D mode captured by the nonlinear simulation,
 $t_{0}$
and
 $\unicode[STIX]{x1D719}_{0}$
are reference time and phase, respectively. Red and blue colours represent positive and negative values, respectively.

Comparison of the frequencies of the dominant modes obtained from DNS and biglobal stability analysis for
 $L/D=2$
,
 $Re_{\unicode[STIX]{x1D703}}=56.8$
and
 $M_{\infty }=0.6$
. Dominant mode is denoted with
 $^{\ast }$
.
Comparison of the iso-surface of the instantaneous spanwise velocity
 $w/u_{\infty }=\pm 0.083$
from the 3-D nonlinear simulation and
 ${\hat{w}}/u_{\infty }=\pm 0.083\times 10^{-3}$
from the dominant 3-D eigenmode (stationary mode) with
 $\unicode[STIX]{x1D706}/D=2.0$
for the cavity with
 $L/D=6$
and
 $M_{\infty }=0.6$
and
 $Re_{\unicode[STIX]{x1D703}}=19$
. Red and blue colours represent positive and negative values, respectively.

For the cavity with
 $L/D=6$
(
 $Re_{\unicode[STIX]{x1D703}}=19$
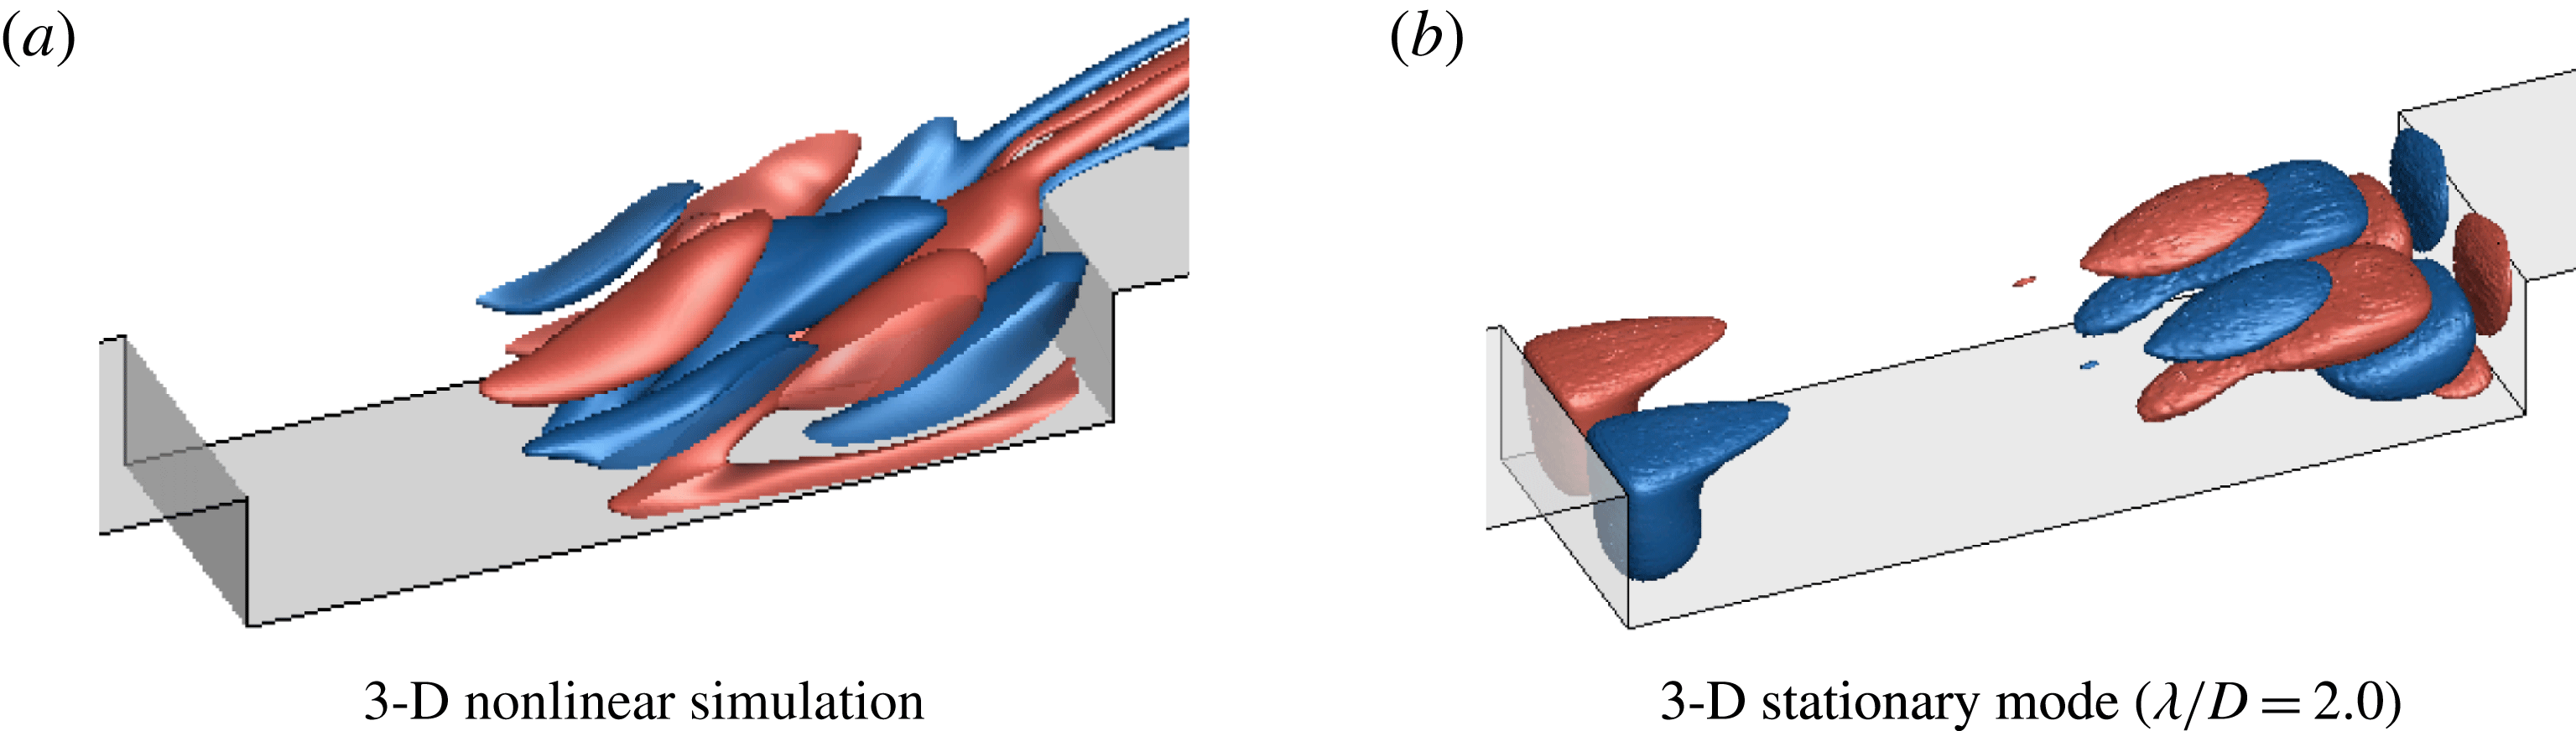
), the violent wake mode present in 2-D DNS is not observed in 3-D DNS. Instead, Rossiter mode II dominates the flow. When the flow has reached steady oscillations, there is no evident low-frequency peaks of the 3-D structures in the nonlinear flows. In the comparison of the 3-D spatial structures revealed by the 3-D DNS and 3-D eigenmodes as shown in figure 22, we find that for the 3-D nonlinear flows, the spatial structures located in the rear region of the cavity stay almost stationary in the spanwise direction with wavelength of
 $\unicode[STIX]{x1D706}/D=2$
, while those obtained from the linear stability analysis are distributed in the front and rear regions of the cavity. As shown in figure 18, though all the 3-D eigenmodes have negative values of growth rate, the spatial structures of 2-D Rossiter modes (figure 13) and 3-D eigenmodes (figure 19) overlap in the rear part of the cavity, which can lead to modal interactions and modify the instabilities predicted from biglobal stability analysis.
In the 3-D DNS, the large vortex roll ups of wake mode present in the 2-D DNS is no longer observable. Meanwhile, the spanwise motion becomes evident in the 3-D flows. To uncover these spanwise effects on the long cavity, further analysis has been performed in our companion work (Sun et al. Reference Sun, Taira, Cattafesta and Ukeiley2016a ), in which we found that the presence of spanwise motion (or three-dimensionalities) in the flow can preclude the formation of the wake mode, reducing the intense fluctuations of the flow. This observation suggests the potential to reduce cavity flow oscillations by introducing spanwise variations to the base flows. In order to weaken the strength of the impingement of shear layer on the trailing edge of the cavity, we can trigger the emergence of 3-D global modes and achieve energy redistribution from spanwise vortices to streamwise vortical structures. To retain the energy inside the cavity, the spanwise wavelength of perturbation introduced to the flow should be in the range of 0.5–1.5, since the spatial structures of 3-D modes associated with these wavelengths mainly stay inside the cavity, which has been illustrated in figure 19.
To verify this concept of using 3-D instability to reduce cavity flow oscillations, we note in passing that 3-D slot jets can be introduced along the leading edge of the cavity to alter the flow features. The performance of these control strategies via 3-D steady blowing for cavity flows is assessed by Zhang et al. (Reference Zhang, Sun, Arora, Cattafesta, Taira and Ukeiley2015) and George et al. (Reference George, Ukeiley, Cattafesta and Taira2015) through a large number of experiments and some representative large-eddy simulations. They find that the wavelengths for effective 3-D flow control to reduce cavity flow oscillations are in good agreement with the findings of present global stability analysis. Although the idea of 3-D flow control is not new (Zdravkovich Reference Zdravkovich1981), the present work particularly uncovers the temporal instabilities affected by compressibility in the transonic regime. Moreover, the spanwise wavelength and frequency associated with 3-D instabilities are identified, which can be useful in examining the influence of flow parameters for 3-D flow control designs. We believe that the insights from the global instability characteristics of compressible open-cavity flows can provide valuable information for designing physics-based flow control strategies.
5 Conclusions
Two- and three-dimensional biglobal instabilities of two-dimensional compressible open-cavity flows are examined for rectangular cavities with aspect ratios of
 $L/D=2$
and 6. Noteworthy in the present work is the focus on the global instability analysis for long cavity (
 $L/D=6$
) flows in the transonic regime, which have not been examined in detail in the past, despite their importance in being representative of practical cavity applications on aircraft. Direct numerical simulations and biglobal stability analysis are used to uncover the influence of Mach number, Reynolds number and spanwise wavelength on the 2-D and 3-D global instability modes with respect to the 2-D steady states. In the 2-D DNS, we find that an increase in Mach number in the subsonic regime destabilizes the flow but stabilizes the flow in the transonic regime at low Reynolds number for both short (
 $L/D=2$
) and long (
 $L/D=6$
) cavities, which agrees with the findings from the work by Yamouni et al. (Reference Yamouni, Sipp and Jacquin2013) on flows over short cavities (
 $L/D=1$
and
 $2$
). Moreover, the dominant Rossiter mode can shift due to the variation in the free stream Mach number.
The 2-D eigenmodes obtained from biglobal stability analysis exhibit excellent agreement with the properties of the 2-D flow characteristics uncovered from 2-D DNS, indicating that these 2-D global modes are Rossiter modes driven by the shear layer. Through the 2-D eigen-analysis with
 $\unicode[STIX]{x1D6FD}=0$
, destabilization and subsequent stabilization effects via increasing Mach number is captured. Moreover, a shift in the dominant Rossiter mode is observed with Mach number variation, which explains the mode shifting behaviour in 2-D nonlinear simulation results.
In contrast to the 2-D modes, the dominant 3-D modes unravelled in the present work are instabilities that are largely unaffected by a change in Mach number. Although an increase in Mach number stabilizes all 3-D eigenmodes, the overall behaviour of 3-D eigenmodes as a function of the spanwise wavelength
 $\unicode[STIX]{x1D706}/D$
is almost independent of the Mach number. However, the type of dominant 3-D mode is strongly dependent on
 $\unicode[STIX]{x1D706}/D$
. For the short cavity with
 $L/D=2$
, the most unstable/least stable 3-D modes have
 $\unicode[STIX]{x1D706}/D\in [1.0,1.25]$
(mode ii) stemming from centrifugal instabilities for almost all Mach numbers considered, as reported by Brès & Colonius (Reference Brès and Colonius2008). For the long cavity with
 $L/D=6$
, the least stable 3-D modes have
 $\unicode[STIX]{x1D706}/D=1.25$
and 2.0 for cases of
 $M_{\infty }\lesssim 0.3$
and
 $M_{\infty }\gtrsim 0.6$
, respectively. Moreover, there are additional types of eigenmodes for this long cavity flow possessing various spatial structures compared to those of the shorter cavity.
In 3-D DNS, both frequencies and spatial structures of the leading 3-D mode seen in the DNS correspond closely to the results of the linear biglobal stability analysis of the dominant 3-D eigenmode for
 $L/D=2$
. However, for
 $L/D=6$
, 3-D DNS reveals large roll up of the cavity shear layer, which indicates strong nonlinearities that depart from the linear analysis. Nevertheless, the insights from global stability analysis provide a potential pathway to reduce flow oscillations by introducing spanwise variations to the base flows, which has been demonstrated in the experiments by Lusk et al. (Reference Lusk, Cattafesta and Ukeiley2012), George et al. (Reference George, Ukeiley, Cattafesta and Taira2015) and Zhang et al. (Reference Zhang, Sun, Arora, Cattafesta, Taira and Ukeiley2015). The analyses in this study provide valuable knowledge on global instabilities of 2-D and 3-D compressible open-cavity flows, which can be leveraged in designing physics-based flow control strategies in upcoming studies.
Acknowledgements
This work was supported by the U.S. Air Force Office of Scientific Research (Grant no.: FA9550-13-1-0091, Program Managers: Drs D. Smith and I. Leyva). The high performance computing resource was provided by the Research Computing Center at the Florida State University. The authors also acknowledge the insightful discussions with Dr G. A. Brès.