Introduction
The main political parties in the UK share the social policy objective, enshrined in law, to eradicate child poverty by 2020.Footnote 1 Three measures by which to judge this target have been adopted: a household measure of absolute low income, a measure of relative low income and a measure that combines material deprivation and relative low income (DWP, 2003: 9; Child Poverty Unit, 2009).Footnote 2 The main parties also agree on three broad ‘pillars’ of policy to achieve the reduction in child poverty (Harker, Reference Harker2007; Liberal Democrats, 2007, 2009; Cameron, Reference Cameron2008; Conservative Party, 2008a, 2008b):
(i) ‘Work intensification’ includes welfare to work programmes, an ongoing programme of welfare reforms and initiatives to get the economically inactive from poor households into work (DWP, 2007, 2008a, 2008b).
(ii) ‘Re-distribution’ includes the national minimum wage, working family and child tax credits, increases in child benefit and allowances targeted at young children in families claiming income support (DWP, 2005, 2006).
(iii) ‘Skill upgrading’ includes universal and income targeted early years programmes, increased spending and changes in the administration of formal education and evolving programmes of changes to vocational training for young people and the unemployed (DES, 2007; DWP and DIUS, 2008).
Disagreement has been over issues of implementation, the relative role of public and private sector in delivery and the specific targeting of spending, rather than over the appropriateness of these policy pillars (Liberal Democrats, 2007; Conservative Party, 2008a, 2008b).
This agreement over a key social objective and the policy pillars to achieve it is surprising given that we might expect differing political philosophies between parties. Under examination, it becomes clear that tensions exist between the social objective and policy pillars that reflect unresolved tensions in the political philosophies of each party. The policy pillars of (i) work intensification and (iii) skill upgrading are consistent with a belief in market outcomes and a political philosophy of providing equality of opportunity for citizens to negotiate those markets (Cameron, Reference Cameron2005; Gamble, Reference Gamble, Seldon and Kavanagh2005; Finlayson, Reference Finlayson2009: 5–9). Equality of opportunity is a procedural aspiration and hence the distributional consequences that result are explicitly outside the control of government. Income inequality may be high or low (see Blair, Reference Blair2002; Coates, Reference Coates2005: 59; Levitas, Reference Levitas2005: 133–5), as may be the resulting levels of relative household and child poverty. This is one reason why the New Labour project was accused by some as representing merely an extension of the neoliberal project of its Conservative predecessors (Hay, Reference Hay1999; Heffernan, Reference Heffernan2000; Callanicos, Reference Callanicos2001). In contrast, the social objective of reducing the incidence of child poverty – a distributional outcome – is inconsistent with a political philosophy limited to delivering equality of opportunity. So too is the second policy pillar of redistribution.Footnote 3
The question is why all the main political parties share this uneasy compromise between outcome and procedural objectives, policies of negotiating labour markets and policies that interfere with market outcomes. A possible answer is that we have reached a politics of post-ideological pragmatism (see Larsen et al., Reference Larsen, Taylor-Gooby and Kananen2006; Page, Reference Page2007: 27). A neoclassical understanding of the operation and benefits of markets dominates (Jordan, Reference Jordan2008: 55–8), tempered by a concern for the working poor (Jordan and Duevell, Reference Jordan and Duevell2003: 135–6), and recognition of previous governments’ failure to equip citizens to effectively negotiate those markets (Dolowitz, Reference Dolowitz2004: 221–2).
There is no straightforward intellectual resolution to the tensions identified; however, it is clear that neoclassical economics dominates political thinking. The major political parties share the view that markets are best left to reach their own naturally determined price levels. Direct government intervention and the operation of power by block interests, such as trade unions and monopolistic companies, are to be avoided. Labour markets and product markets should be flexible in terms of prices and quantities of work provided (OECD, 1994; Lewis, Reference Lewis2009). The legitimate role of government is twofold: first, to ensure that the welfare system encourages physically able working-age adults into the labour market (policy pillar (i)); and, second, that skills are at a level to enable the economy to compete in global markets and continue to grow (policy pillar (iii)). Policy pillar (ii), redistribution, can only ever ameliorate the inexorable logic of the market-determined price system of wages, and is partially rectifying failures, past and present, in policy pillar (iii).
Government gets its intellectual mandate to interfere in skill determination, rather than leaving it to individuals operating within the market, from ‘post-neoclassical endogenous growth theory’ (Romer, Reference Romer1986; Lucas, Reference Lucas1988). This theory was originally transmitted to New Labour from the Clinton administration's advisors (Dolowitz, Reference Dolowitz2004; Coates, Reference Coates2005: 34). The crucial elements of the theory are that economic growth is related to a society's knowledge and human capital (Coates, Reference Coates1999: 79–80), and that there will likely be a private underinvestment in human capital because the benefits of knowledge spill outside of any investing firm (Romer, Reference Romer1986: 1003). Hence, it is in society's interest for government to invest in human capital or, in more straightforward language, skills in order to improve its knowledge base.
From the perspective of individuals, human capital theory suggests that greater human capital results in higher levels of marginal productivity, which equate with higher wages/total remuneration to labour. Hence, there is a potential social benefit in terms of narrowing the earnings distribution, as well as a macroeconomic benefit in terms of increased growth, in increasing the human capital of the lowest-paid workers in society. Creating a ‘knowledge economy’ holds the long-run promise of solving economic and social problems simultaneously (Brown et al., Reference Brown, Green and Lauder2001: 9, 13).Footnote 4
This paper challenges the ability of this theoretical understanding of labour markets to capture their actual operation in real economies, and hence the capacity for policies that rest upon it to achieve their desired objectives. It does so primarily through an empirical assessment of the three policy pillars’ ability to achieve reductions in relative household and hence child poverty.
Pillars (i) and (ii), work intensification and re-distribution, are examined together because the capacity for an increased quantity of paid work to lift families above the relative poverty line depends upon the degree of redistribution. It is found that, for low-paid workers, increasing the quantity of paid work performed by a household, given current levels of redistribution, is extremely limited in lifting those families out of poverty. This suggests that policy pillar (iii), upskilling, is central to the social objective of eradicating child poverty by 2020.
Raising skills and creating a knowledge economy are ‘supply-side’ policies. They rely upon demand for skills by employers increasing in line with their increased supply. However, the evidence from employment across a number of developed economies shows polarised growth in high- and low-paid work, with the middle of the distribution becoming ‘hollowed out’. This trend suggests that developed countries will have to manage the assimilation of an increasing number of households consisting of workers that perform low-paid work currently categorised as low-skilled.
Possible responses to this challenge vary in their degree of radicalism; however, this paper argues that we need to examine more closely a generally overlooked part of the picture – the factors that determine national wage structures. By showing that the degree of national wage dispersion differs considerably between developed countries, it argues that this cannot be explained by neoclassical economic theory and requires research into national institutional and cultural causes. Only through such research may issues of relative household and child poverty be effectively addressed.
Examining the effectiveness of policy pillars (i) and (ii) work intensification and redistribution in reducing child poverty
(i) Policy overview
The main mechanism on which the government has focused to reduce the incidence of childhood poverty since 1998/9 has been getting parents into work.
nearly half of children in low income live in households where no adult works. . .finding work is the first step out of poverty – changes in labour-market earnings account for roughly two-thirds of exits from low income (DWP, 2006: 19).
This aspiration has crystallised into a long-term target for an employment rate of 80 per cent of the working age population and a 70 per cent employment rate for lone parents (DWP, 2005: 4, 36).
The government has phased in increasingly tough welfare reforms in its attempt to increase employment. The New Deal created an obligation for those on unemployment benefits – job seekers allowance (JSA) – for more than six months to address their skills and subsequently engage in paid, subsidised or voluntary work, or recognised training.Footnote 5 The second phase of reform promoted voluntary participation in further targeted New Deals and ‘Pathways to Work’ directed at the disabled, lone parents and partners of JSA claimants. The ongoing third phase represents a toughening of the approach towards long-term benefit claimants (Black, Reference Black2008) through rationalisation of the benefits system, ‘personalised conditionality’ (Gregg, Reference Gregg2008: 11) and the involvement of the private sector in employment matching alongside enhanced roles for Job Centres (Freud, Reference Freud2007: 4–6; DWP, 2008a).
Alongside the increases in the number of people working have been policies aimed at improving the income of the lowest paid. The national minimum wage was introduced on 1 April 1999 with annual reviews produced by the independent Low Pay Commission on its recommended level. The working families tax credit was also introduced in 1999, split in April 2003 into child tax credit and working tax credit. Working and child tax credits provide income-related payments up to household earnings of £18,215 for childless householdsFootnote 6 and £58,231 for those with children, although for a two-child family with annual income above £29,677, the maximum value of tax credits is £545 per annum.Footnote 7
Additional financial incentives are aimed at intensifying both the number of workers in low-income households and the quantity of work that they perform (DWP, 2007: 19–24). For example childcare tax credits are conditional upon each adult working a minimum of 16 hours per week, and one of the working tax credits is conditional upon the household working a minimum of 30 hours per week (HMRC, 2010).
(ii) Assessment of performance
The government has certainly achieved some success through these policy measures. The employment rate for lone parents stood at 56.7 per cent in 2009, up 12.1 per cent from 44.6 per cent in 1997, when Labour came to power (ONS, 2010). The employment rate for the working-age population increased from 72.8 per cent in May 1997 to stabilise at between 74.5 per cent and 75 per cent for much of the 2000s prior to the effects of the financial crisis, after which it dropped to 72.4 per cent for the last released monthly figure of November 2009 (ONS, 2010). The government narrowly missed its interim target in 2004/5 to reduce child poverty by 25 per cent from a 1998/99 baseline, achieving a 21.3 per cent reduction before housing costs (BHC) and a 17.2 per cent reduction after housing costs (AHC) (Brewer et al., Reference Brewer, Goodman, Shaw and Sibieta2006: 35).Footnote 8 Since then the situation has worsened. Between 2004–5 and 2007–8, the last year for which data are available from the ‘Family Resources Survey’ (DWP, 2009), there has been a recorded increase of 200,000 children in poverty (BHC) and 300,000 (AHC) (Brewer et al., Reference Brewer, Muriel, Phillips and Sibieta2009: 30, 43–4, table 4.4). This left the government needing to reduce child poverty by an additional 1.2 million children (BHC) to reach its target for 2010–11. To put this in context, it reduced it by 500,000 between 1998–9 and 2007–8.
As of 2007–8, the two largest shares of total household income in Britain were earnings (66 per cent), and benefits and tax credits (18 per cent) (Brewer et al., Reference Brewer, Muriel, Phillips and Sibieta2009: 13, table 2.3).Footnote 9 Whilst a minority factor when considering the whole population, benefits and tax credits are highly significant in determining whether low-income households are above the relative poverty threshold. Between 1997 and 2001 increases in employment for poor households contributed significantly to the reduction in child poverty. However, between 2001 and 2005, most of the fall in child poverty is attributable to increases in tax credits (Brewer et al., Reference Brewer, Goodman, Shaw and Sibieta2006). The increase in child poverty since then has been at a time when the growth in entitlements has been less than the growth of the relative poverty line or the retail price index (RPI), that is a reduction in income in real terms (Brewer et al., Reference Brewer, Muriel, Phillips and Sibieta2009: 37, table 4.3). A recent estimate of the additional spending on redistribution required to meet the 2010–11 and 2020 targets is £4bn per annum. Given the current strains on public finances, this is not a realistic option.
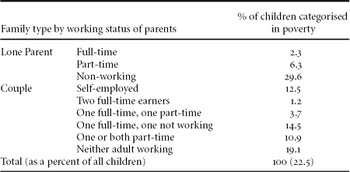
Given this fiscal constraint, all the major parties are committed to further welfare reforms to get the economically inactive into work. From Table 1, it is clear that the greatest risk of a child being in poverty comes from them being in a non-working family (48.7 per cent of all children in poverty) and that the risk is very low if parents work full-time or at least where one parent works full-time and the other part-time (only 7.2 per cent of all children in poverty live in such households).Footnote 10 Given these data, it is perhaps not surprising that policy-makers have concluded that having both parents working, preferably full-time, should reduce the incidence of child poverty.
– Breakdown of child poverty by family type (2007–8)

Source: Author calculations using ‘Family Resources Survey 2007–8’. There will be some rounding errors as the original table from which this is derived displays percentages to only 1 decimal point.
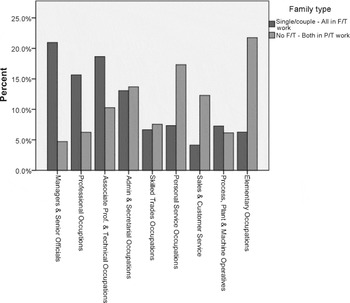
However, there is a potential fallacy of composition here. If families currently engaged in full-time work have relatively high incomes due to the quality of work that they perform rather than its quantity,Footnote 11 then dramatically increasing the quantity of paid work for many other families will not have the desired result. Examining the distribution of working adults by standard occupational classification supports this intuition. Employment is skewed towards higher-level occupations – managers, professional and associate professional occupations – for families where all adults work full-time. There is a statistically significant dependence of occupational classification upon family type which is most pronounced when comparing full-time working families with families where one or both adults work part-time.Footnote 12 Part-time working families consist of workers concentrated in elementary occupations, personal services and sales and customer services (see Figure 1). People entering the labour market from long-term inactivity are more likely to obtain this quality of work than that performed by the small proportion of families, only 12.9 per cent of the population of all households with children, where all adults work full-time.
Comparison of employment by occupation for families where all adults work full-time and those who work part-time
Source: ‘Family Resources Survey 2007–8’ (DWP, 2009)
N = 2,658 working adults for families where all adults work full-time and 993 working adults in families that do not contain a full-time worker.
Percentages sum to 100 within each family type across all Standard Occupational Classifications. The occupational category ‘undefined’ has been removed from the calculations as it may include adults in part-time working families who do not work.

A further limiting factor, that continues to be an obstacle in the desire for all parents to work full-time, is the prohibitive cost and availability of childcare. This is something that the Labour government was trying to address through the direct provision of free childcare. There is a target of 15 hours per week free childcare for all three- and four-year olds, an increased network of 3,500 Sure Start childcare centres and childcare between 8 a.m. and 6 p.m., organised through schools for all five to 14 year olds during term time (DWP, 2007: 29; DES, 2007). In addition, working tax credit includes a component that contributes to up to 80 per cent of childcare costs, up to a limit of £175 per week for one child or £300 for two children, in households where both parents work more than 16 hours per week (HMRC, 2010). However, it remains to be seen whether these targets will be supported by the new government and, if they are, whether they will radically alter the problems that families face in juggling work and caring responsibilities.
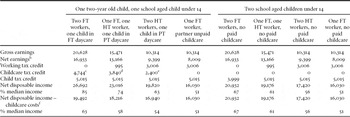
As most of the people that the government wishes to move into employment will have limited labour market skills or experience, it is informative to examine the capacity for a greater quantity of low-paid work to lift the poorest households out of poverty. I have estimated the net disposable income including tax credits that would be paid to a two-adult, two-child family working for the minimum wage, where the adults work different proportions of time and pay for childcare in proportion to this (see Appendix for details of the calculation). The results are shown in Table 2.
Estimates of net disposable income of households working for the minimum wage, as a proportion of median income, tax year 2008–9a

Notes: aValues are expressed in GBP unless percentages of median income.
bNet earnings are after income tax, national insurance and council tax.
cBased on £150 per week childcare costs over 48 weeks, which is £25 less than the maximum that the government will provide funding towards.
dBased on £100 per week childcare costs over 48 weeks as it is assumed that childcare costs will not simply halve with part-time work.
eBased on £50 per week childcare costs over 48 weeks as it is assumed that two part-time workers can flex childcare more easilly than one part-time.
fNet disposable income minus the childcare working tax credit and the non-government funded 20% of childcare costs.
This analysis indicates that all of the families would be below the ‘equivalised’ 60 per cent median net household income poverty line (BHC) of £18,772 (author calculation from Adams et al., Reference Adams, Johnson, Matejic, Vekaria and Whatley2009: 18, table 2.3) for two-adult, two-children families if it were not for tax credits. Tax credits make a major contribution in lifting families with two full-time workers above this threshold. Whether the other working configurations for families are lifted above the threshold depends upon the extent to which they consume childcare, which highlights the issue of what is included in the measure of net disposable income.
The measure followed in the DWP constructed ‘Households Below Average Income’ HBAI tables deducts costs such as council tax, occupational pension contributions and student loan repayments, and provides both before and after housing costs measures (BHC and AHC) (see Adams et al., Reference Adams, Johnson, Matejic, Vekaria and Whatley2009: 2–3, 175–6).
Given this sensitivity, it is surprising that income is not calculated both gross and net of childcare costs. As Table 2 indicates, a large element of tax credits for low-earning families with pre-school children can be towards childcare costs, paid as a transfer. Taken at face value, these transfers dramatically increase net disposable income as a percentage of median income (see Table 2).Footnote 13 However, this transfer, whilst generous, only pays up to 80 per cent of actual childcare costs. Therefore, if net disposable income is calculated after childcare costs, it is significantly lower (the second to last row of Table 2).
When making the comparison with median net household earnings, ideally this should also be adjusted for the quantity of paid childcare that the median family consumes. Unfortunately, this is not known. However, because of the tapering effect of increased income-reducing tax credits, I consider it highly unlikely that the median household can afford to employ full-time childcare. Therefore, a second-best comparison for poverty purposes is post-childcare disposable income as a percentage of median net household income (last row of Table 2). This will be most stable over the lifetime of the children, with the quantity of childcare required decreasing as children reach school age.
Whether one uses the disposable income measure net of childcare costs or not, the conclusions are similar. Two full-time working parents definitively get over 60 per cent of medium income with children of pre-school or school age. One full-time and one half-time working parent also manage this if the children are at school, but it is borderline if one child is of pre-school age after childcare costs have been accounted for. Neither one full-time parent nor two half-time working parents manage it. Net of childcare costs, not even two full-time working parents on the minimum wage are able to pass 70 per cent of median household income, the level used in the combined measure of child poverty. These calculations are without any further pulling away of the median earning household from those towards the bottom in future years.
This analysis indicates that for those earning low wages, even with the current levels of tax credits, increasing the intensity of work in families is extremely limited in raising those families out of poverty. This is consistent with the general observations that many service jobs, particularly those related to social care, do not pay enough to meet the high costs of living and raising a family in the UK or US, and that family members are required to increase participation in the labour market in an attempt to maintain living standards (Jordan and Duevell, Reference Jordan and Duevell2003: 102, 132). It follows that the skills component of the government's strategy will be heavily relied upon to raise the earnings of the lowest paid relative to those above them. The issue is going to be the quality of work that is available and the pay that may be earned from it. It is this that the skills agenda, with its supply-side focus, is intended to address and it is to these trends that I now turn.
Examining the effectiveness of policy pillar (iii) skill upgrading in reducing child poverty
(i) Policy overview
Consistent with the economic theory described in the introduction, enhanced skills have been linked to productivity, economic competitiveness, increased personal income and a reduction in ‘social deprivation, poverty and inequality’ (Leitch, Reference Leitch2006: 4; DWP and DIUS, 2008). Top quartile performance in each level of skills is targeted by 2020, which would place the UK eighth in international rankings. Benefits are estimated to be in the order of £80bn of current value over the next 30 years, based upon productivity and employment growth of 10 per cent by 2020 (Leitch, Reference Leitch2006: 15).
Considering one of the tasks of the Leitch report was to identify the skills that would be required in the UK in the future (Leitch, Reference Leitch2006: 143), there is a lot of emphasis on skills needing to be ‘economically valuable’, but virtually no identification of the actual skills that individuals will need. Leitch explicitly rejects what he calls the historical ‘supply-side’ attempts to predict future skill requirements. Instead, he calls for a ‘demand-led’ process, which means greater employer involvement in the determination of qualifications and more of a market in training. The market will operate both in terms of greater employer control of budgets in commissioning workplace training, referred to as ‘train to gain’, and individual control of ‘learner accounts’ in spending personal allowances on training.Footnote 14 There will also be a national employer-led Commission for Employment and Skills, responsible for ‘re-licensed and re-empowered’ sector skills councils, which in turn are tasked with ‘taking the lead role in developing occupational standards and approving vocational qualifications’ (Leitch, Reference Leitch2006: 18; DWP and DIUS, 2008).
The tension between societal and personal benefit within the theory of human capital theory is apparent when it comes to who should be responsible for paying for training. The Leitch report suggests that the government should be responsible for the bulk of basic training (up to level 2, equivalent to five good GCSEs), employers and individuals should contribute at least 50 per cent of level 3 training costs (equivalent to two A-levels), whilst the bulk of level 4 (degree level) training should be paid for by recipients as ‘they will benefit most’ (Leitch, Reference Leitch2006: 15).
(ii) Assessing likely performance
As mentioned, the idea that skill upgrading will result in poverty reduction rests upon human capital theory, which is an extension of the marginal productivity theory of neoclassical economics. In equilibrium, skilled workers are employed until their marginal product exactly equals their marginal cost (remuneration). This theory considers the labour market as a trading floor for the pre-existing possession of skills, general or specific, that have productive use to employers.
Implicit in the theory is the assumption that investment in human capital will create its own demand (Brown et al., Reference Brown, Green and Lauder2001: 17). In other words, the nature of jobs will change in order to make use of enhanced skills, otherwise the capacity for skills to be translated into actual productivity will be limited by the work that is available. Criticisms of this assumption highlight regional disparities in demand (Theodore, Reference Theodore2007), including the importance of transport proximity to London (Dorling, Reference Dorling2006), and more fundamentally the socially embedded nature of work (Block, Reference Block1990: 75) with the existence of multiple segmented labour markets rather than a simple skill–reward relationship (see Fine, Reference Fine1998: 124–32 for a historical overview). However, the skill–reward equilibrium assumed by human capital theory has not been a problem from the economist's perspective. As stated above, technological change was seen as ensuring higher-skilled workers would have higher-skilled jobs.
The theory of ‘skill-biased technical change’ (SBTC) suggests that new technology – particularly computers – requires highly skilled workers to be able to operate it and simultaneously makes low-skilled workers redundant (e.g. Machin, Reference Machin2001: 774). To a lesser extent, trade with developing countries that specialise in the production of low-skilled labour-intensive goods reduces the demand for low-skilled labour in developed countries. This should mean an observed reduction in the number of workers employed in low-skilled occupations and an increase in employment in high-skilled ones. The limiting factor, which also explains the increasing wage dispersion between the 1970s and 1990s, was thought to be the scarcity of skilled workers. The conclusion drawn was to upskill the workforce in developed countries, reducing the supply bottleneck, and shifting the majority of work to the new high-productivity, high-wage jobs.
Recent evidence has begun to challenge this view, even if the theory has always been considered extremely reductionist by other social sciences. The crucial evidence is with regard to the changing structure of employment within developed countries. Empirical studies of the UK, US and Germany using detailed occupational-industry classifications have found that, whilst employment in the top two deciles of jobs has increased dramatically since the 1970s, it has also unexpectedly increased in the lowest two deciles.Footnote 15 Jobs in the middle six deciles of the distribution have been disappearing. This suggests polarisation in the workforce, with an increasing proportion of low-paid workers and an increasing proportion of high-paid workers (Autor et al., Reference Autor, Katz and Kearney2006; Spitz-Oener, Reference Spitz-Oener2006; Goos and Manning, Reference Goos and Manning2007; Dustman et al., Reference Dustman, Ludsteck and Schoeneberg2009).
SBTC predicted the increase in high-skilled jobs but not in low-skilled ones. In response, a more nuanced version of the technology hypothesis has been put forward, attributed to Autor, Levy and Murnane (ALM) (2003). This suggests that computer technology is a replacement for workers performing routine tasks, mainly clerical and skilled manual roles in the middle of the wage distribution, but cannot replace those workers doing non-routine tasks, either professional or managerial at the top, or low-paying service occupations at the bottom.
Whilst able to potentially explain rising wages for the high-skilled as an increase in demand above the supply of skilled workers, even the ALM hypothesis struggles to explain falling relative wages for the low-skilled under circumstances of increasing demand and reduced supply. (This reduced supply is the logical consequence of an increasingly educated workforce.) It could well be that immigration from poorer countries has played a major role in boosting the supply of workers willing to perform low-skilled roles. However, this does not mean that such workers are receiving the theoretical equilibrium wage for their skills, as many are vastly overqualified for the work.
The fact is that the content of jobs limits the potential productivity of any worker and cannot be overcome by improving the qualifications of those applying for them. In examining the UK, Goos and Manning found an increase in the average level of qualifications across all occupations and an increase in the entry-level qualifications being asked for.Footnote 16 However, they also found little change in the skills required to perform the jobs and survey results reported that workers in low-skilled jobs feel unnecessarily skilled to perform them. This suggests that a form of ‘credentialism’ has been occurring, where employers will take the highest qualified workers available, even if their skills are in excess of those required (Goos and Manning, Reference Goos and Manning2007: 128–9).
Neither the changing structure of jobs nor the widening dispersion in compensation between low- and high-skilled workers fits well with the neoclassical framework of human capital theory and theories of skill-biased technological change that suggest we may aspire to a knowledge economy. The idea that upskilling the workforce will automatically upskill the work and result in a narrowing of wages is unrealistic for real economies. The similar patterns of employment growth across countries adds a considerable note of caution to claims made in the influential ‘varieties of capitalism’ literature that developed countries can specialise in productive activities best suited to their ‘institutional basis of comparative advantage’ (Hall and Soskice, Reference Hall, Soskice, Hall and Soskice2001). Whilst it is true that the percentage of employment by industry differs across countries, suggesting some opportunity for strategic industrial policy, none of the developed countries examined has been able to escape significant growth in low-skilled service employment (Drucker, Reference Drucker1993: 7; see GGDC, 2008). No amount of aspiring to the knowledge economy is going to change this.
With hindsight, it is now clear that the Anglophone economies used credit as a ‘privatised Keynesian’ substitute for the earnings of the low-paid from the 1990s onwards (Crouch, Reference Crouch2008; Jordan, Reference Jordan2008: 249). However, as has been found to our cost, this is not a sustainable solution to low earnings, limited ultimately by the ability to repay debt out of income.
A radical response that has been suggested is for a universal basic income (Van Parijs, Reference Van Parijs1995). This accepts the increase in low-skilled work, takes market determined remuneration as a given and considers what states can do to ensure the material well-being of workers that perform such jobs. Some claim it would make low-productivity and part-time jobs more attractive and to be freely chosen irrespective of their economic valuation (Barry, 1997, cited in Jordan, Reference Jordan2008: 225–6). It is beyond the scope of this paper to examine the arguments for a universal basic income. However, before taking such a radical step, it is important to examine whether the market valuations of work are as objective and universal as assumed by economic theory and policy-makers.
Whilst economic theory suggests a universal logic of marginal product and marginal cost equating to produce levels of remuneration, as will be seen in the next section there are large cross-country differences in ‘market’ determined earnings dispersion. Which factors determine the size of earnings differentials between types of jobs and whether governments have any capability to alter this are important questions that have been largely unexamined in considering how to address rising earnings inequality and relative poverty in developed economies.
Different national degrees of earnings dispersion
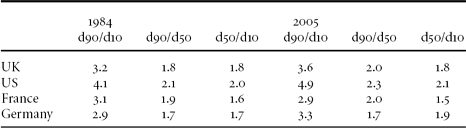
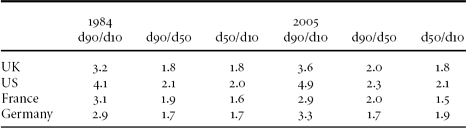
A range of evidence exists that illustrates national differences in the distribution of earnings within similarly developed economies. A direct way to measure this is to compare points in the earnings distribution. Table 3 shows the ratio of earnings between the 90th, 50th and 10th percentiles for several countries in 1984 and 2005.
Decile earning ratios 1984 and 2005
Source: OECD (2009).
The US is the most unequal for all ratios in both years, with the top earners having particularly pulled away from the bottom and to a lesser extent from the middle during the period. The UK demonstrates a similar trend, with the government policies reviewed in this paper credited with preventing the lowest earners from falling further behind the rest (Mason et al., Reference Mason, Mayhew, Osborne, Lloyd, Mason and Mayhew2008: 15).
Germany began the period with some of the lowest ratios but was regressive for the lowest paid. This has led to German service sector trade unions initiating a campaign for a minimum wage of about 50 per cent of the full-time median in 2006 (Bosch and Weinkopf, Reference Bosch, Weinkopf, Bosch and Weinkopf2008: 308). France bucks the trend, with the lowest earners having increased their wage relative to middle and top earners, whilst the middle has slightly lost ground to the top.
The country decile ratios are consistent with the proportion of workers categorised as low-paid, defined as gross hourly pay below 60 per cent of the median hourly wage for all employees (see Table 4).
The proportion of all employees categorised as low-paid in a selection of developed countries, 2005

Source: Solow (Reference Solow, Bosch and Weinkopf2008: 6)
Being a low-earner does not automatically translate into living in a poor household, because of the potential for there to be multiple earners (Mason et al., Reference Mason, Mayhew, Osborne, Lloyd, Mason and Mayhew2008: 29–30). However, the UK's relatively high proportion of low-paid workers reinforces the argument made earlier that intensifying the quantity of work performed by poor households will be extremely limited in shifting these households above the relative poverty line. The data also highlight the degree to which different countries produce dramatically different outcomes when it comes to low pay for the same work.
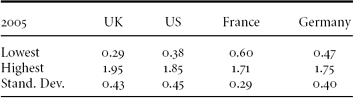
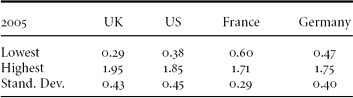
A further piece of evidence is a comparison of the range and standard deviation of industry compensation across countries, using data categorised by Standard Industry Codes (see Table 5)
Spread of average industry compensation as a proportion of the employment weighted mean wage across all industries
Source: Author calculations using the highest level ISIC categories (12) from the EU KLEMS database (GGDC, 2008)
Whilst Table 5 provides a fairly crude measure of earnings dispersion, using average compensation across industry categories that in some cases group several occupations, it is consistent with the previous two tables. Greater dispersion in average employee compensation between industries is consistent with an increased incidence of relatively low-paid workers.
Given the similar trends experienced by the four countries examined in the growth of low-skilled, relatively low-paid work, what is significant for the social objective of reducing relative poverty through increased work intensification is the gap between the wages of these workers and the rest of the workforce.
Human capital theory can only explain the cross-country differences in wage dispersion in terms of national distributions of skills. This is ‘a universal, irrefutable, empty rationalization for existing wage differentials’ (Galbraith, Reference Galbraith, Galbraith and Berner2001: 8). Even if different countries have different educational distributions, such an explanation suggests that the same occupation in the same industry but in different developed countries has widely different skill requirements and resulting marginal products. In particular, it suggests that professional and managerial occupations in finance and business services in the UK and US are much more skilled and inherently productive than their counterparts in continental Europe, whilst many retail, health and personal service workers are much more skilled and productive in Germany and France than the UK and US. As Martin Carnoy puts it, ‘the pay off to education is conditioned not only by technology, but by information, ideology, political power, property rights, citizenship rights in the workplace, and the willingness of organizations to innovate constantly’ (1995: 3). It is impossible to roll all of these considerations into a single concept of human capital (Fine, Reference Fine1998: 60).
For economists to consider how other features of societies affect wage determination means considering the labour market to be ‘non-competitive’. In other words, wages do not solely reflect the marginal productivity contribution of the factor inputs, and hence firms do not optimise their production to maximise consumer utility for the inputs available. To state this is an almost heretical step, but even so a number of labour market economists have at least raised the possibility that ‘differences in labour market and educational institutions may greatly affect how demand shifts translate into wage structure changes’ (Autor et al., Reference Autor, Katz and Kearney2006: 6–7; see also Goos and Manning, Reference Goos and Manning2007: 132; Dustman et al., Reference Dustman, Ludsteck and Schoeneberg2009: 874).
It is not possible in this paper to examine the range of cultural and institutional factors specific to national economies that may result in dramatically different wage distributions; however, some suggestions for further research can be made. Although the analysis of earnings is gross, prior to tax, redistribution and the provision of welfare services, it may be suggested that the private–public mix in employment will have an effect on relative wage levels for certain services, particulary those related to social care (e.g. Esping-Andersen, Reference Esping-Andersen1990; Iversen and Wren, Reference Iversen and Wren1998).Footnote 17 Whilst this may be true, it is insufficient to explain significant cross-country differences in average industry wage dispersion found across a wide range of private and public sector industries (GGDC, 2008). A broader argument may be made that the national institutions of the ‘production regime’ – the financial, education and training, industrial relations and inter-company competition systems – found in the varieties of capitalism and business systems interact to produce significant differences in cross-country wage dispersion (see Lewis, Reference Lewis2009: ch. 7). A culturally sensitive addition to this argument is that there is a social code of pay norms, distinct from the economic theory of workers being paid their marginal product, that is contingent. Changes to greater inequality of earnings are related to ‘superstar rents’, steeper hierarchies of pay in organisations and shifts from hierarchical to individualised norms of pay (Atkinson, Reference Atkinson2008: 72–9).
Whatever the combination of causes, the last two sections have demonstrated that significant differences in national wage structures exist, whilst differences in the structure of employment across national economies are not as significant as the Hall and Soskice inspired literature suggests. These distinct national wage structures cannot be plausibly explained by the neoclassical understanding of the economy that dominates politics and policy in the UK today. Understanding the causes of national wage dispersion from a broader cultural and institutional perspective is central to policy aspirations to reduce relative household and child poverty.
Conclusion
This paper has demonstrated that the main political parties in the UK share the social objective of reducing relative poverty through the implementation of three broad policy pillars. It has argued that, whilst not entirely coherent, these policy pillars are consistent with a neoclassical understanding of how the economy should optimally function. The unencumbered operation of competitive markets combined with ‘new growth theory’ holds the promise of improved economic performance and the narrowing of earnings inequality. It also provides a mandate for government to intervene on the supply-side of the economy in increasing participation in paid work and enhancing societal knowledge and the skills or ‘human capital’ of citizens.
However, this paper is sceptical of the economic framework as a model of real economies and hence the effectiveness of social policies related to it to achieve a reduction in relative household poverty. It empirically demonstrates the serious limitations of work intensification for poor households, given current levels of redistributive intervention, to lift such households above the relative poverty line. This leaves much of the burden of reducing child poverty upon the policy pillar of enhanced skills moving us towards a knowledge-based economy.
The examination of employment trends in a selection of developed economies suggests that, contrary to theory, upskilling the workers does not automatically upskill the work. There has been a polarisation of employment growth in both low-skilled, low-paid work and high-skilled, high-paid work. This is at the same time that educational qualifications in the UK have been improving across the workforce. When combined with the long-run technological trend for manufacturing to shed labour, this suggests that all developed economies will have to contend with an increasing proportion of service workers that have traditionally been categorised as low-skilled. Pursuing the mythical knowledge economy is not a realistic option.
However, it is striking that different countries produce dramatically different earnings dispersion across the same jobs, resulting in different proportions of the workforce being categorised as low-paid. This is difficult to explain with the standard ‘competitive theory’ unless skill differentials between the same occupations and industries are dramatically different in different countries. Even some neoclassical economists are suggesting that we need to look to wider societal factors to understand earnings dispersion. Without the possibility of increasing redistribution, which is highly unlikely given the dire fiscal consequences of the financial crisis and limited political appetite, relative poverty may only be realistically addressed through a comprehensive examination of how institutional and cultural factors influence the ‘market’ distribution of earnings.
Acknowledgements
I would like to thank Matthew Watson, Ben Clift and the anonymous referees for providing comments and suggestions on earlier versions of this paper.
Appendix – Assumptions for net disposable income calculations in Table 2
The year worked corresponds to the tax year 2008/9. I have assumed that all workers earn the minimum wage of £5.73 per hour. A full-time worker works 37.5 hours per week, 48 weeks of the year; a half-time worker works 18.75 hours per week, 48 weeks of the year. Income tax and national insurance allowances and bands are for the tax year 2008/9 (HMRC, 2010). Because NI is calculated weekly, earnings are spread evenly over 52 weeks. Council tax, included in BHC measures, is taken to be that of the lowest band, band A, which represents 25 per cent of dwellings and therefore is most likely representative of the lowest earning households. This is calculated as 6/9 of band D, or £915.33 (DCLG, 2008). All households are above the income threshold, including working tax credits (WTC), at which Council Tax Benefit has tapered to zero.
Tax credits follow 2008/9 allowances and taper according to income thresholds in the order: working tax credits (WTC), childcare element of working tax credits, child element of tax credits (CTC) and family element of child tax credits (CTC) (HMRC, 2010). Childcare costs are estimated at the weekly levels indicated in the table.
The net disposable median household income is the equivalised before housing cost income for a couple with two children under 14, £361 per week which equates to £18,772 per year (Adams et al., Reference Adams, Johnson, Matejic, Vekaria and Whatley2009: 18, table 2.3) This is net of the variety of expenditure listed in Adams et al. (Reference Adams, Johnson, Matejic, Vekaria and Whatley2009: 175–6). I considered it more straightforward to do the calculations BHC rather than estimate a further deduction for housing costs, which, given the availability of data, would have likely been equal for numerator and denominator in the proportion of median income calculations. Pension and student loan payments are deducted in the median BHC income measure, but were not deducted from the earnings of our hypothetical families due to lack of estimable data. If anything, this should increase estimated income as a percentage of the median.
Having tried two different on-line calculators for tax credits (HM Revenue and Customs, 2009; Working families.org.uk, 2009), which produced widely different results with minimal breakdown of workings, I constructed my own spreadsheet model following the assumptions listed above and HMRC's worked example (HMRC, 2009). As with the on-line calculators, this spreadsheet should be viewed as an estimation of the tax credits, tax and NI payable and is available upon request from the author.