1 Introduction
In the linguistic literature, so much attention has already been paid to the phonetics and phonology of the modern accents of the British Isles that one may wonder why more research is needed in this field. Part of the answer lies in the constantly evolving nature of phonological systems and phonetic realizations: what used to be true when John Wells wrote his Accents of English some 25 years ago (Wells Reference Wells1982) may not entirely apply to current pronunciation trends. Recent books (Foulkes & Docherty Reference Foulkes and Docherty1999, Schneider et al. Reference Schneider, Burridge, Kortmann, Mesthrie and Upton2004) have endeavoured to update our knowledge of accent variation, often focusing on urban accents, in the British Isles (and beyond), and a whole host of articles have been published. However, as far as we know, no recent publication has provided acoustic data for vowels on a large number of accents with the same methodology.
Thus, here, we set out to investigate the vowel systems of 13 accents of the British Isles through acoustic measurements. For the sake of brevity, we will not delve into every phonetic phenomenon (a more detailed analysis is available in Ferragne Reference Ferragne2008); however, enough information will be given in order to provide as accurate as possible an overview of present-day acoustic variation. This, we hope, might prove useful as a basis for further research on each accent (some of the accents being, as far as we know, not widely mentioned in the acoustic phonetic literature, e.g. Scottish Highlands), and could also be compared both with other contemporary acoustic descriptions of vowel systems and earlier descriptions, the latter potentially leading to a better understanding of phonetic changes. We believe that such an endeavour could be useful for linguists and phoneticians looking for a compact overview of geographically-induced phonetic and phonological variation in the British Isles. The article can also serve as a basis for more sophisticated pronunciation modelling for speech technology purposes (speaker indexing, automatic accent classification – see Ferragne & Pellegrino Reference Ferragne, Pellegrino and Müller2007).
2 Material and method
2.1 Corpus
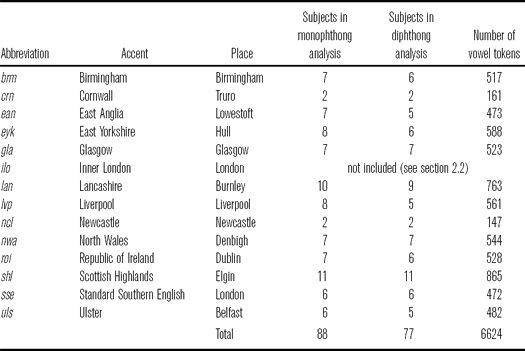
The Accents of the British Isles (ABI; D'Arcy et al. Reference D'Arcy, Russell, Browning and Tomlinson2004) corpus includes recordings from 14 areas covering the British Isles. On average, 20 subjects (equally divided into men and women) took part for each region. The speakers had lived all of their lives in the region in question, and their parents had lived there, too. The target age range was from 18 to 50 years old but, in some areas, the actual range is 16–79. The recordings took place at the beginning of 2003. Table 1 shows the abbreviations that will be used throughout to designate the accents, the meaning of these abbreviations, where the recordings took place, the number of subjects whose vowels will be actually graphed, and the number of vowel tokens per accent. The number of subjects is split into two columns: the leftmost column contains, for each accent, the number of subjects whose data contribute to monophthong plots, and the number of subjects used in the diphthong plots appears in the other column. The figures in the columns differ as a result of the screening procedure (see section 2.2). It is worth mentioning that no information on the participants is available, which de facto precludes the study of phonetic variation caused by sociological (in a broad sense) factors. In particular, it would have been desirable to know the age of the participants because many studies (e.g. Labov Reference Labov1994, Foulkes & Docherty Reference Foulkes and Docherty1999, Hawkins & Midgley Reference Hawkins and Midgley2005) have shown that a speaker's age is a central factor in explaining phonetic and phonological variation. Nevertheless, although these important factors cannot be controlled for a posteriori, standard speaker normalization techniques will be applied to the data (see section 2.2).
Accents of the ABI corpus and number of subjects and vowels.

The speech material we are concerned with here is a list of 19 /hVd/ words that the subjects were asked to read five times: heed, hid, head, had, hard, hod, hoard, hood, who'd, Hudd, heard, hade, hide, hoid, hoed, howd, hared, heered, hured. The use of such stimuli is meant to factor out both the effects of coarticulation and the acoustic variation determined by information-related phenomena such as linguistic redundancy (Wright Reference Wright, Local, Ogden and Temple2003, Aylett & Turk Reference Aylett and Turk2006). One obvious drawback of this approach lies in the questionable suitability of non-words or rare words (we return to this point, and other disadvantages, below, in the Discussion section). However, D'Arcy and colleagues, who recorded the data, provided the subjects with common words that the ‘difficult’ /hVd/ targets were supposed to rhyme with. For instance, the subjects were instructed that hoid was to rhyme with 〈void〉, hoed, with 〈showed〉, howd, with 〈loud〉, etc. (D'Arcy et al. Reference D'Arcy, Russell, Browning and Tomlinson2004: 116). In the remainder of the present article, both test-words and standard lexical sets (Wells Reference Wells1982) will be used, often interchangeably. For the correspondence to be explicit from the start, test-words and standard lexical sets have been matched in table 2; this makes comparisons with other accent studies easier. The table shows which lexical set of Standard Southern British English is – so the authors think – exemplified by each test-word; but it does not go so far as to imply that all speakers phonologically interpreted each test-word as a member of the lexical set it is associated with in the table (see the Discussion for a more thorough treatment of the bias induced by reasoning in terms of the lexical sets of Standard Southern British English). For the sake of legibility, the vowels were split between monophthongs, closing diphthongs, and centring diphthongs, following the phonological labels they are given in classic descriptions of Received Pronunciation (RP; Jones Reference Jones, Roach, Hartman and Setter2003, Wells Reference Wells2008). Of course, this conventional division does not tell us anything about the actual phonetic realization of a vowel in a given accent. The conventional labels for vowels are listed in table 2.
Test-words, (assumed) corresponding lexical sets, and conventional vowel category.

In this paper, we only report male data on the grounds that gender is known to be an important factor of phonetic variation; thus, including data from two genders would have necessitated separate graphs and comments, which would have considerably increased the length of this paper. The choice of male rather than female data was determined by the fact that typicality scores (see below) were only available for the male participants.
2.2 Method
Given the lack of information on individual subjects, a phonetician, native speaker of English, was asked to listen to all speech samples recorded by the 145 male speakers and to come up with scores (on a five-point scale) reflecting the typicality of the speaker's accent as well as intra-accent homogeneity. The expert phonetician was told to listen to the first part of the read passage (the ABI corpus contains a read passage of about 300 words) and could stop playing a sound as soon as he had formed an opinion as to the typicality of the sample under scrutiny. This assessment led us to leave out the sample labelled ilo on account of substantial within-sample phonetic variability (mainly brought about by differences in ethnic backgrounds). A more thorough assessment with more listeners and some measure of listeners' agreement constitutes a potential follow-up study.
Formants have long been held to be well-suited parameters for describing vowel quality, mainly because the F1/F2 plane correlates with traditional articulatory–auditory trapezoidal representations of vowels. However, De Wet et al. (Reference De Wet, Weber, Boves, Cranen, Bengio and Bourlard2004) emphasize that, to date, no automatic tool can reliably extract formants. As a consequence, the reproducibility of measurements is not guaranteed and the processing of very large speech corpora may prove a very time-consuming task. We opted for a compromise that would minimize human intervention while preserving the benefits of the F1/F2 representation.
The remainder of this section explains how formant measurements were calculated. The methodology includes the rejection, after visual assessment, of vowel tokens with an obvious mismatch between spectrogram and estimated formant tracks, the automatic determination of vowel boundaries based on F0 detection, the conversion of Hertz values to the Bark scale, the smoothing of formant contours with regression techniques in order to rule out remaining formant tracking errors, and the computing of Lobanov-transformed values (see below).
A broad-band spectrogram with superimposed formant tracking was obtained with Praat (Boersma & Weenink Reference Boersma and Weenink2008) – and the Burg algorithm set to default parameters – for each of the 26,408 vowels. Each such representation was visually inspected: when a complete mismatch was observed between formant tracking and spectrogram, the vowel in question was rejected; otherwise – and even if there was a slight mismatch – the vowel was kept for further analysis. The screening procedure left us with 22,331 vowels.
The ABI corpus comes complete with word-level segmentation, so that the boundaries of each /hVd/ word are clearly identified. In order to extract the vocalic nuclei, automatic F0 detection was run using the Snack Sound Toolkit (Sjölander Reference Sjölander2004) and the voiced part was kept. It should be borne in mind here that in such test-words as hard, heard, etc., a /r/ follows the vowels in rhotic accents (crn, gla, lan, roi, shl, uls). In those accents where /r/ is realized as an approximant, F0 detection did not allow for separation between the vowel and the /r/ (besides, some vowels were r-coloured throughout), which led us – for want of a better method – to keep the whole speech portion. As a consequence, we have included comments on rhoticity and the phonetic realization of /r/ where relevant.
Prior to acoustic measurements, formant values were re-sampled using linear interpolation in order for each vowel to have the same number of values, namely 13, whatever its duration. This was done for the sake of convenience: for instance, for numerical techniques such as regression, numbers were more easily handled when stored in vectors of constant size. However, it must be noted that the duration ratio between formant steady states and formant transitions varies across vowels and speech rates (Gay Reference Gay1968, Reference Gay1978), so our method causes a slight loss of information.
Beyond our conventional split of the vowels into monophthongs and diphthongs, we still had to decide if a vowel would be represented, in terms of phonetic realization, as one or the other type. After listening to each vowel token and visualizing the corresponding spectrogram, it was decided that all the vowels that had been labelled as monophthongs a priori would be treated as such. Although some of them are slightly diphthongized in some accents (see e.g. ean below), the rule was applied systematically. Similarly, all the vowel tokens conventionally called diphthongs were visually and auditorily inspected, and, in each accent, the pattern found most often (which, in practice, always proved far more frequent than alternative variants) determined how a vowel type would be analyzed in this particular accent. Given the small number of alternative variants in each accent, we reckoned that computing medians and interquartile ranges for all vowel types would guarantee insensitivity to those variants and therefore spare us an additional sorting of speakers.
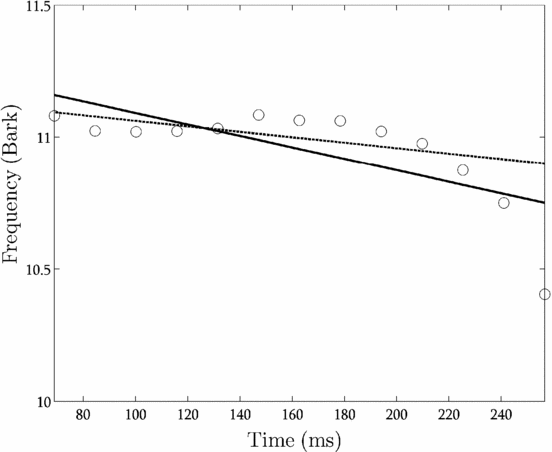
F1 and F2 values were then Bark-transformed (Traunmüller Reference Traunmüller1990), and robust and polynomial regression techniques were applied to smooth formant trajectories and rule out outlying values. The specific kind of regression to be employed was decided for each type of vowel and depended on the accent. For instance, the vowel of face in most accents of the north of England is a monophthong, so robust linear regression was deemed sufficient to characterize the formant. Figure 1 shows the second vocalic formant of hade after linear interpolation ‘re-sampling’ (circles) produced by speaker PDK from lan with regression lines obtained with classic – ordinary least squares – regression (solid line) and robust – weighted least squares – regression (dashed line). The figure makes it clear that the latter technique (which we adopt in the paper for monophthongs) proves superior in that, intuitively, it matches the monophthong pattern more closely, whereas the classic regression line, mostly because of the final formant values, leads to an overestimation of starting values and an underestimation of most values in the second half of the vowel.
F2 from the vowel of hade by speaker PDK from lan: original formant track (circles), classic regression line (solid line), and robust regression line (dashed line).

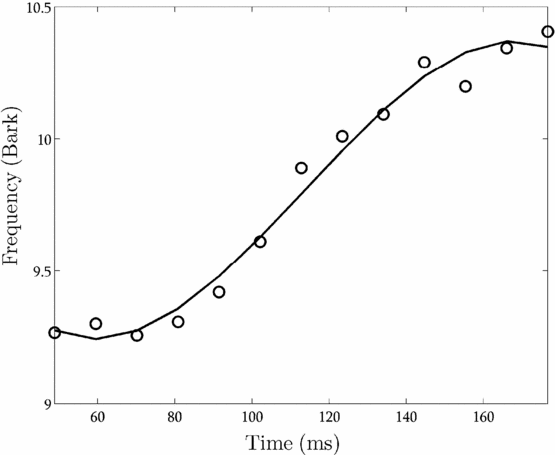
As far as the price vowel is concerned, a cubic polynomial model was adopted so that the S-shaped trajectories of F1 and F2 in many accents would be accurately rendered. In figure 2, the circles represent the second formant of the hide vowel spoken by speaker CTS from lvp; the solid line was obtained thanks to cubic polynomial regression, which allows a curvilinear trajectory with at most one inflection point.
F2 from the vowel of hide by speaker CTS from lvp: original formant track (circles) and cubic regression curve (solid line).

The so-called Lobanov (z-score) transform was applied to each formant separately and for each speaker independently in order to erase physiologically-induced acoustic variation (Lobanov Reference Lobanov1971, Adank et al. Reference Adank, Smits and van Hout2004). In practice, for example, all F1 values measured at temporal mid-point on the regression line in the monophthongs of one single speaker were z-scored, and the same was applied to F2. Such a normalization procedure implies that a speaker produces at least one token of each vowel type, which was not always the case (as a consequence of the screening procedure described above). Speakers with incomplete vowel sets were therefore removed for the remainder of the acoustic analysis, hence the variable number of remaining speakers (table 1) across accents and vowel category (i.e. monophthongs vs. diphthongs) and the reduction of vowel tokens from 22,331 to 6,624. Incidentally, the low number of crn and ncl speakers warns us against being too confident about the acoustic results for these two accents. However, along with the acoustic data, an auditory analysis of all speakers – including those who were removed during the screening – was carried out by the authors.
In addition to F1/F2 plots, probability density estimates based on kernel smoothing (Everitt, Landau & Leese Reference Everitt, Landau and Leese2001: 16–20) will be presented for some pairs of vowels necessitating finer-grained comparison (see e.g. figure 16 below). The resulting figures can be interpreted as smoothed histograms, and they are particularly helpful when it comes to deciding to what extent two vowels can be said to belong to a single phoneme.
Duration values will only occasionally be reported (e.g. in figure 16), when spectral quality alone was not enough to determine if two vowels were identical. But, although duration plays a crucial role in the phonological system of many accents, we chose not to include this parameter systematically. The reason is that, to a much larger extent than formants, duration is influenced by the specific type of speech material analyzed here. In other words, the fact that monosyllabic words appeared in a list resulted in huge inter-individual variation and, on average, duration values were much higher than one would expect in natural speech.
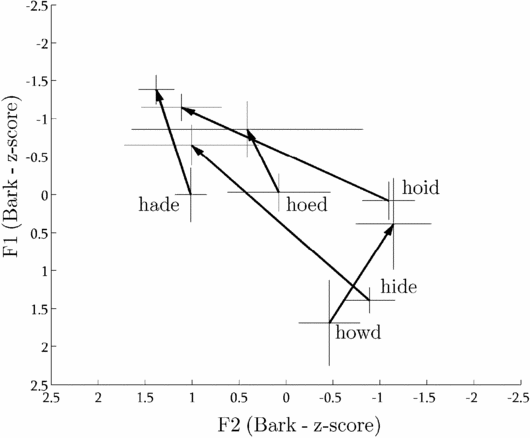
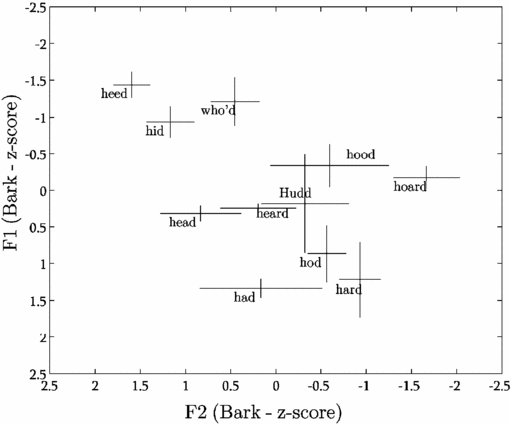
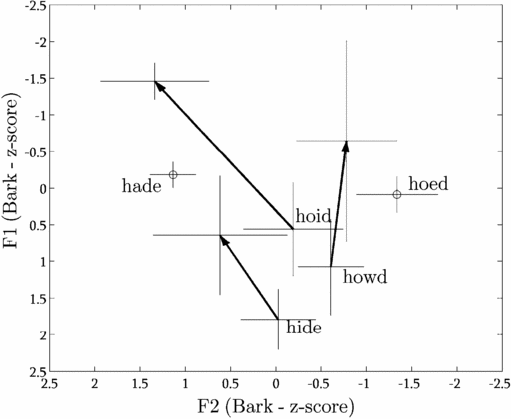
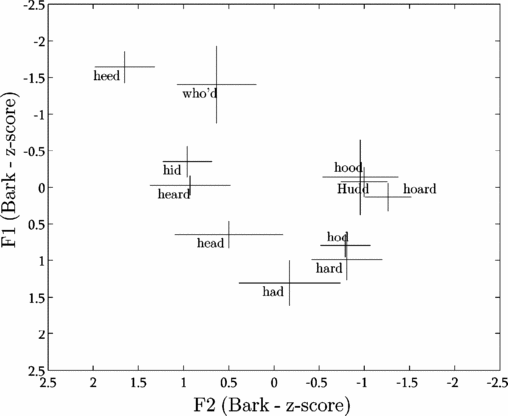
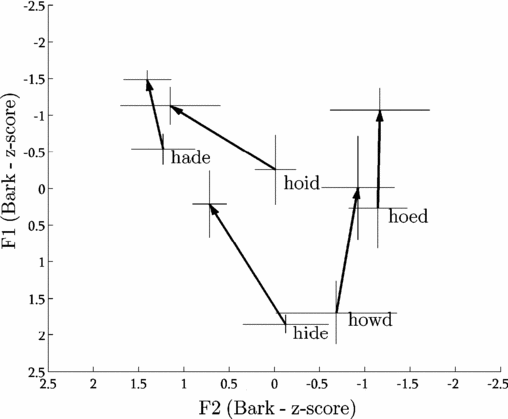
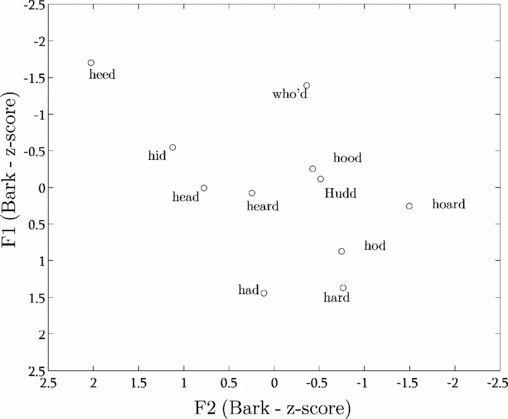
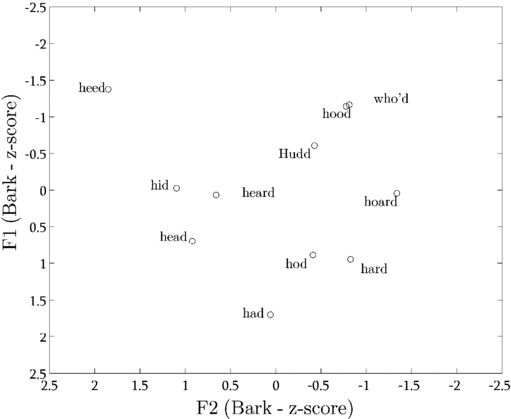
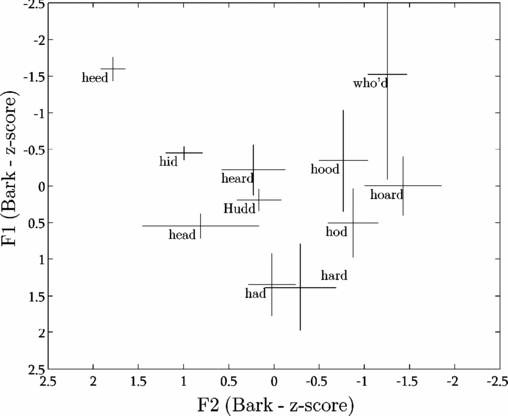
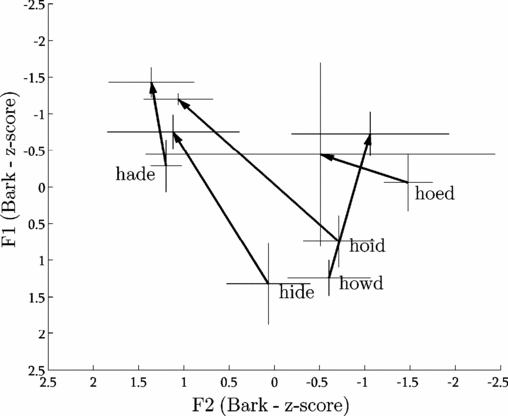
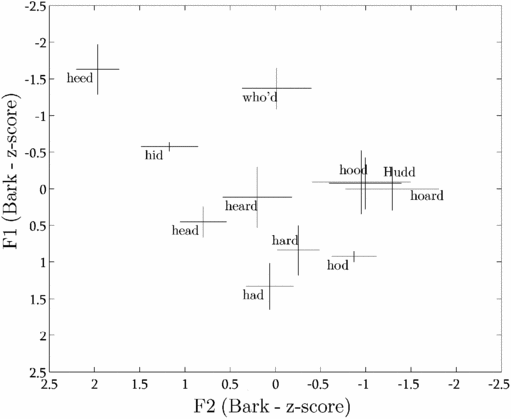
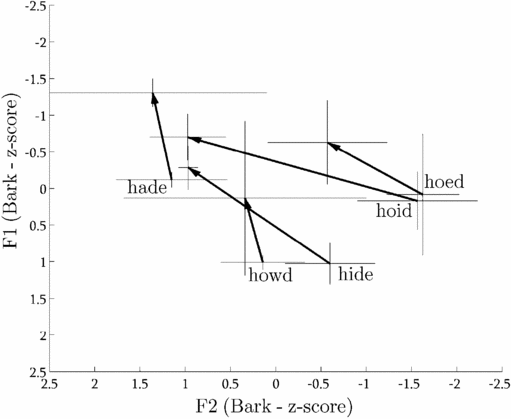
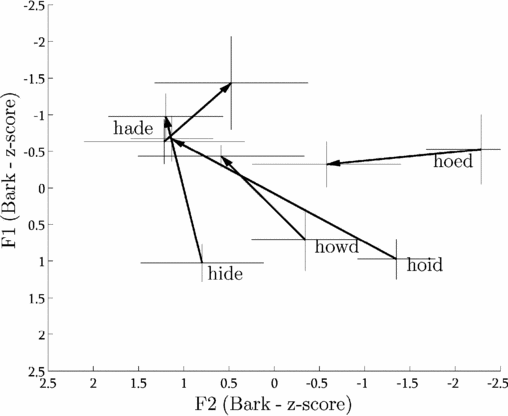
The resulting F1/F2 plots are presented below for each accent. Sse appears first, and then all remaining accents are presented in alphabetical order. Given that only two speakers could be analyzed acoustically in crn and ncl, it was decided that one plot for each speaker would be provided in these accents. The z-scored Bark-transformed F1/F2 values plotted for the monophthongs were measured at the temporal midpoint. On account of large within-dialect differences in phonetic realization, the median and the interquartile ranges were used as estimators of central tendency and spread, respectively, rather than the arithmetic mean and the standard deviation. For the closing diphthongs, the arrows represent the initial and final (arrow head) median F1 and F2 values with error bars spanning the interquartile range. The actual measurements were made at 2/13 and 11/13 of the duration of the vowel in an attempt to minimize the impact of coarticulation. Centring diphthongs are not plotted in the F1/F2 plane, mainly because of their within-dialect variability and especially due to the inconsistencies elicited by the ill-suited test-word hured (see Discussion). Nevertheless, some of them will be illustrated with spectrograms.
A complete description of each and every vowel for all 13 accents would indeed be extremely tedious. Instead, we will focus on a restricted set – varying from one dialect to the next – of the most notable phenomena.
3 Results
3.1 Standard Southern English (sse)
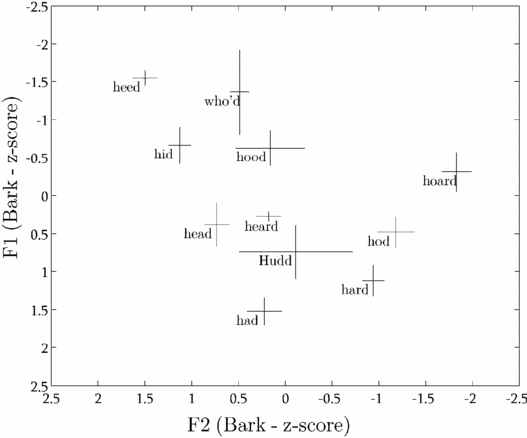
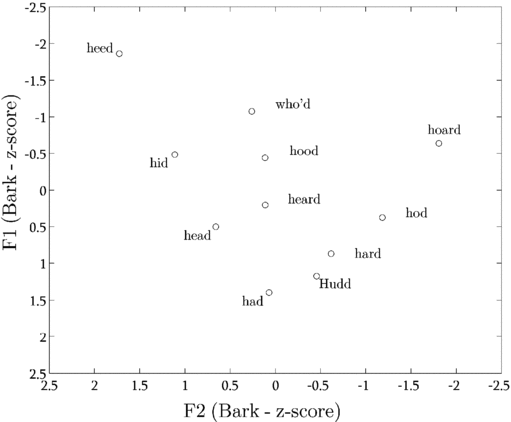
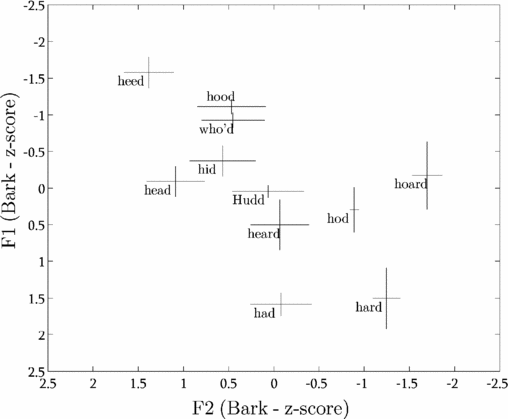
The accent sse serves as a reference against which the remaining accents are compared. It has been described in detail in many publications (Nolan Reference Nolan1998, Jones Reference Jones, Roach, Hartman and Setter2003, Upton Reference Upton2004, Hawkins & Midgley Reference Hawkins and Midgley2005, Wells Reference Wells2008, etc.). As figure 3 shows, the vowels of who'd and hood (which are supposed to instantiate the goose and foot sets, respectively) are more front than recent pronunciation dictionaries suggest (Jones Reference Jones, Roach, Hartman and Setter2003, Wells Reference Wells2008). This finding is however in accordance with up-to-date acoustic–phonetic descriptions (Hawkins & Midgley Reference Hawkins and Midgley2005, McDougall & Nolan Reference McDougall and Nolan2007).
Median and interquartile range for the 11 monophthongs produced by six male speakers of sse.

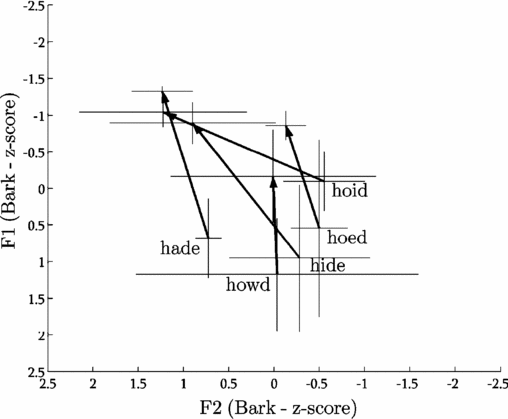
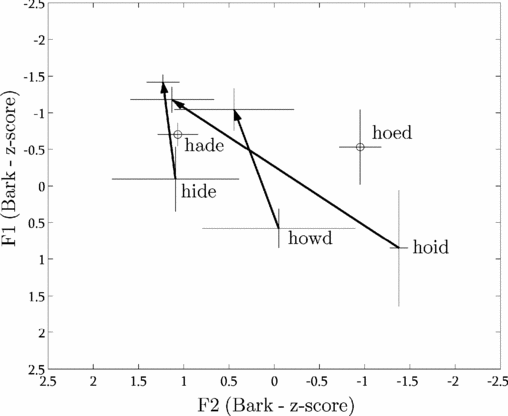
As far as closing diphthongs are concerned, figure 4 shows that the vowel of price has a rather back starting element while that of mouth is rather front, the difference being audibly perceptible. In earlier descriptions, O'Connor (Reference O'Connor1973) and Gimson (Reference Gimson1980) used the symbols /a/ and /ɑ/ for the starting element of price and mouth, respectively. Nowadays, although Jones (Reference Jones, Roach, Hartman and Setter2003) and Wells (Reference Wells2008) use a single symbol for the first vowel of price and mouth, the vowel plots provided in these dictionaries (Jones Reference Jones, Roach, Hartman and Setter2003: viii; Wells Reference Wells2008: xxiii) explicitly show that the authors keep considering that the first element in mouth is slightly more back than that of price. In contrast to the latter, other recent publications have symbols for price and mouth that are much more in line with our findings. Upton (Reference Upton2004) records two variants for price: [aɪ] in traditional RP and [ʌɪ] in contemporary RP. He, however, notes just one possibility for mouth: [aʊ]. Olausson & Sangster (Reference Olausson and Sangster2006) also use [ʌɪ] (price) and [aʊ] (mouth). In a review of vowel symbols in dictionaries, Windsor Lewis (Reference Windsor Lewis2003: 147) comments on the use of [ʌɪ] instead of [aɪ]: according to the author, ‘[t]he apparent Upton suggestion that /aɪ/ and /aʊ/ have now reversed their relative starting positions in mainstream usage is not supported by my observations and I know of no-one else of such an opinion’. Windsor Lewis goes so far as to claim that the symbols [aɪ] and [ɑʊ] (for price and mouth) would still be totally defensible. In others words, he seems to reject any possible phonetic development in the pronunciation of these two vowels. He also reminds the reader that when Gimson (in the fourteenth edition of the English pronouncing dictionary, in 1977) departed from earlier versions of Jones's dictionary by dropping [ɑʊ] in favour of [aʊ], it was for the sake of simplicity, and it certainly did not reflect any phonetic change.
Median starting and end point for the 5 closing diphthongs produced by six male speakers of sse.

Now, focusing on the question of a potential reversal between the starting points of price and mouth (and not on the precise phonetic quality of the former), our analyses, both acoustic and auditory, suggest that the speakers in our sample do have such a reversal. Whether it is the result of an evolutionary process is still debatable and would need more thorough research (e.g. with a greater sample), but other factors come into play in this controversy. Firstly, the answer can be influenced by how conservative the definition of the accent is. For instance, Upton (Reference Upton2004: 219) aims at describing a ‘kind of modern, “diluted” Received Pronunciation’, Jones (Reference Jones, Roach, Hartman and Setter2003: v) describes the pronunciation of BBC newsreaders, and Wells (Reference Wells2008: xix) provides transcriptions that ‘cover very much more than a narrowly defined RP’. As far as our sse sample is concerned, the assessment by a British phonetician (see section 2.2) yielded typicality and homogeneity scores of 3/5; which suggests that our definition of sse (which we equate with what others label RP) is indeed quite lax.
Secondly, most of the references (especially dictionaries) quoted here target learners of English as a second language and non-specialist native speakers. As a consequence, the transcriptions reflect a compromise between phonetic accuracy and simplicity. In such books, distinguishing only between [aɪ] and [aʊ] makes perfect sense in terms of parsimony; besides, symbols are mere conventions. So this is another reason why we will guard against inferring potential phonetic changes from symbols used in broad transcriptions.
So, from our sse sample, we have no means of knowing whether the rather back position of the first element of price (relative to that of mouth) is the result of a historical process, and we cannot tell to what extent our sample matches the population whose pronunciation is described in dictionaries. Wells (Reference Wells1982: 310) recorded this phenomenon (which he calls price–mouth Crossover) in the Popular London accent; given that our subjects have all been recorded in London, it may well be that their type of Standard English is influenced by local features such as the price–mouth Crossover.
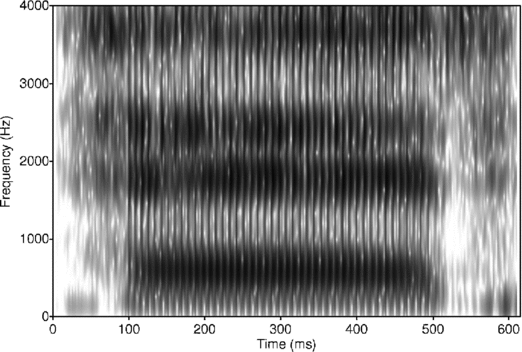
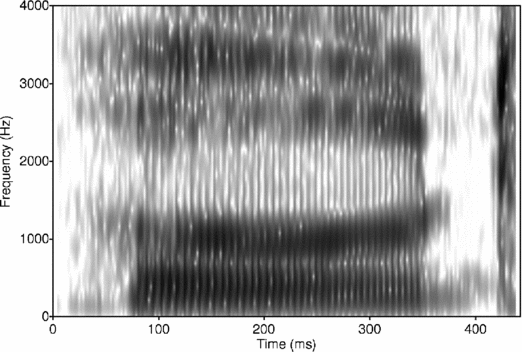
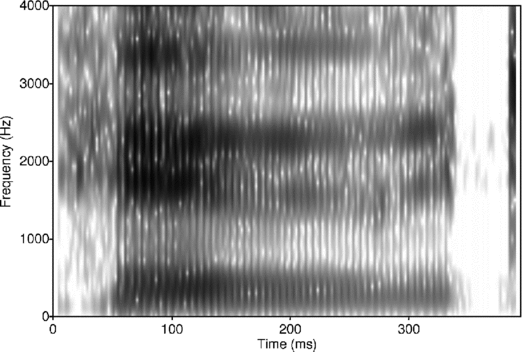
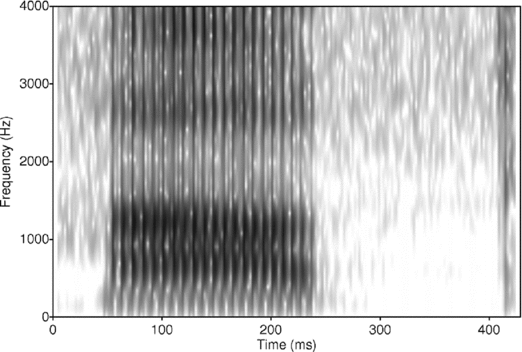
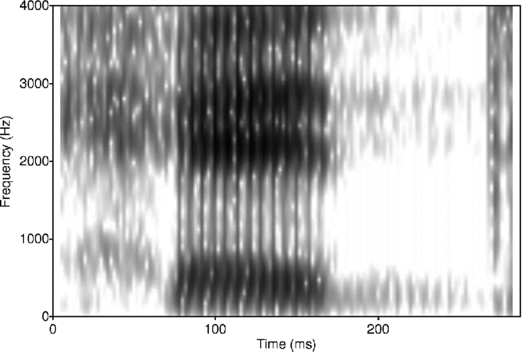
In our sample, the vowel of hared is most often a monophthong (figure 5), and more rarely a monophthong followed by a short offglide towards the centre of the F1/F2 space. This again supports the transcription used by Upton (Reference Upton2004) and Olausson & Sangster (Reference Olausson and Sangster2006) (i.e. [ɛː]) and somewhat contradicts Jones Reference Jones, Roach, Hartman and Setter2003 and Wells Reference Wells2008, who suggest that the square vowel is a centring diphthong (Upton Reference Upton2004: 226 claims that the diphthong characterizes traditional RP).
Spectrogram of hared produced by the speaker DME from sse.

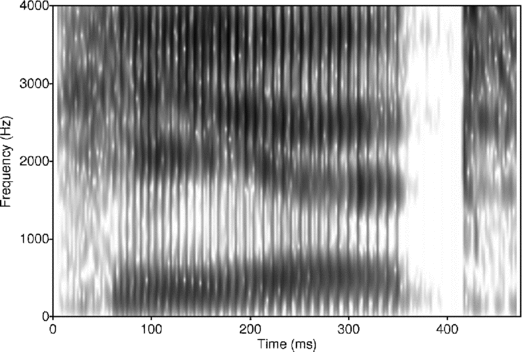
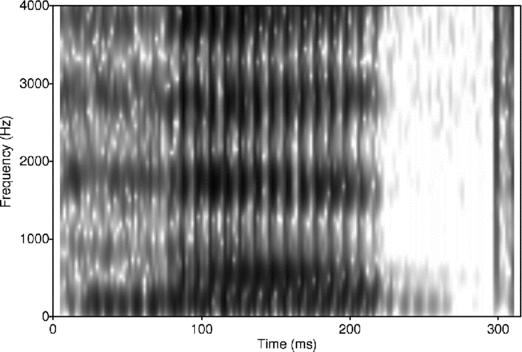
Unlike the square vowel, the most frequent variant for the heered vowel is a centring diphthong (figure 6); but monophthongs are not uncommon. The diphthongal notation can be found unanimously in Jones (Reference Jones, Roach, Hartman and Setter2003), Upton (Reference Upton2004), Olausson & Sangster (Reference Olausson and Sangster2006) and Wells (Reference Wells2008).
Spectrogram of heered produced by the speaker HAK from sse.

The test-word hured was quite problematic: it very frequently yielded, within the same accent, between- and also within-speaker variation. Given the apparent lack of agreement as to how the speakers phonologically interpreted this word, we decided to exclude it from the rest of our analysis.
3.2 Birmingham (brm)
The accent of Birmingham (brm) is generally thought to pattern with the northern English accents, partly because neither the foot–strut split nor the trap–bath split is said to have occurred in typical brm (Clark Reference Clark2004). But, according to Wells (Reference Wells1982: 354), ‘many educated northerners . . . would not be caught dead doing something so vulgar as to pronounce strut words with [ʊ]’; thus, sociolinguistic variation must be expected. This suggests that, since sociolinguistic factors have not been controlled in the corpus, the average formant values for foot and strut may be misleading in that they potentially reflect the pronunciation of both speakers with and speakers without the foot–strut split.
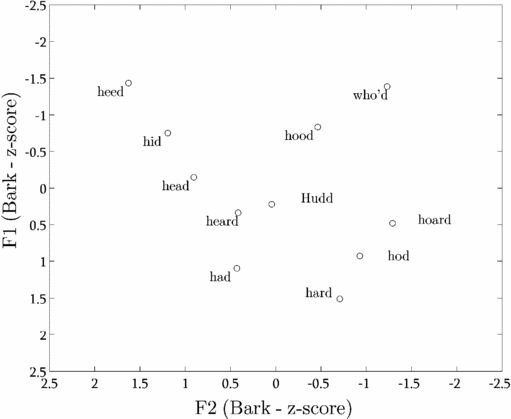
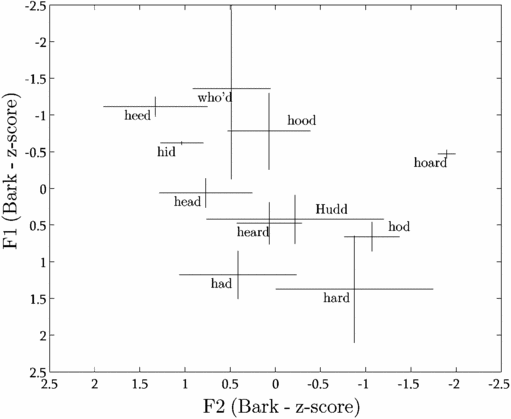
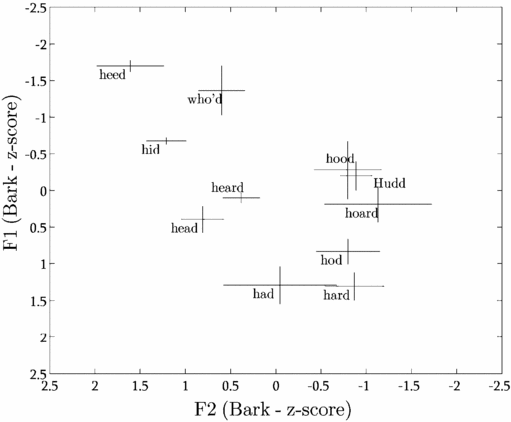
Figure 7 displays the monophthongs of the male speakers of brm. Given that the distributions of hood and Hudd only slightly overlap, it can be thought that the majority of speakers likely have two phonemes here. An auditory analysis actually reveals that only half of the 20 (male and female) speakers from the brm sample have a perfect homophony between hood and Hudd, which exemplifies why computing averages on formant values may prove misleading. In some speakers whose system has separate vowels for foot and strut, the strut vowel is very close to that of nurse (heard), to the extent that duration seems to be the only reliable cue to distinguish them. Relative to sse, where strut has a rather open quality, the brm vowel is closer to the centre of the vowel space. This central quality for strut is typical of educated and mobile northerners, as evidenced in a perceptual study by Evans & Iverson (Reference Evans and Iverson2004): when asked to find best exemplars of strut words in a carrier sentence spoken in southern English, northern subjects living in London adjust their representation while northerners still living in the north do not normalize for accent. However, the perceptual adjustment performed by mobile northerners does not match vowels actually produced by southerners; it only comes close to a schwa-like quality.
Median and interquartile range for the 11 monophthongs produced by six male speakers of brm.

Now, turning to the diphthongs of brm (figure 8), the starting quality of price appears slightly less open than in sse. Actually, an auditory inspection including all speakers reveals that it is noticeably back and close. We have found no evidence supporting a potential merger involving price and choice (this possibility is mentioned by Wells Reference Wells1982: 363–364), although in some speakers the two vowels are perceptually very close to each other. The test-word hared has a long monophthong for all speakers; heered, a centring diphthong.
Median starting and end point for the five closing diphthongs produced by seven male speakers of brm.

3.3 Cornwall (crn)
According to Wells (Wells Reference Wells1982), the accent of Cornwall (crn) clusters with the accents of the south-west of England, although it has a different linguistic tradition from surrounding counties. Crn is rhotic, which means that the graphic 〈r〉 in the test-words has a phonetic equivalent. The influence of a realized /r/ on the preceding vowel manifests itself in different ways: for instance, in some realizations of heard, F3 collapses abruptly towards the middle of the automatically extracted signal portion, which indicates that the vowel and the /r/ occur in succession, while other vowel tokens display a stable low F3 throughout, suggesting that the vowel is r-coloured throughout.
Figure 9 and figure 10 show the monophthongs produced by each of the two crn speakers. Auditorily, the goose vowel is particularly variable; back vowels (figure 11), comparatively front qualities (figure 12) and diphthongized variants are attested.
Median F1/F2 for the 11 monophthongs produced by speaker MJM of crn.

Median F1/F2 for the 11 monophthongs produced by speaker RPG of crn.

Spectrogram of a back variant of who'd produced by speaker RPG from crn.

Spectrogram of a front variant of who'd produced by speaker MJM from crn.

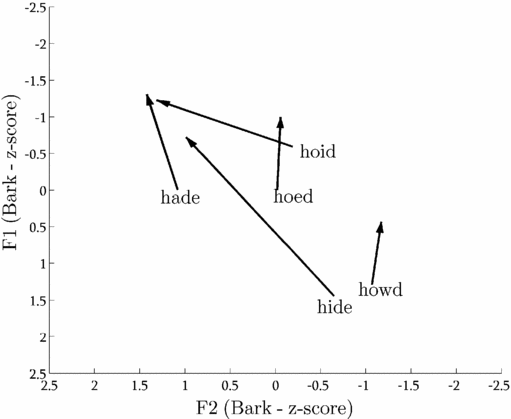
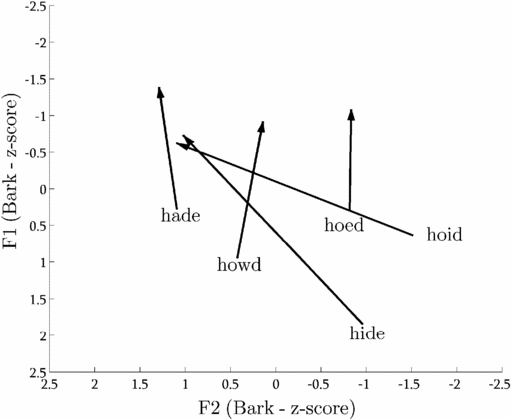
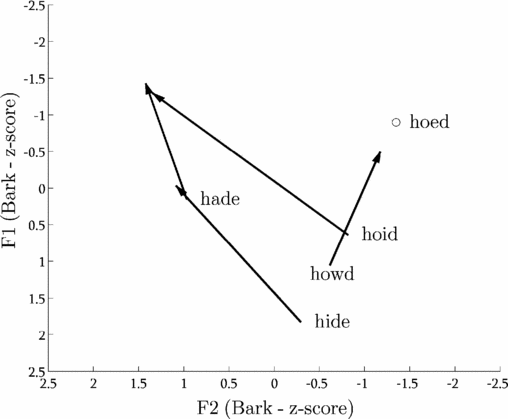
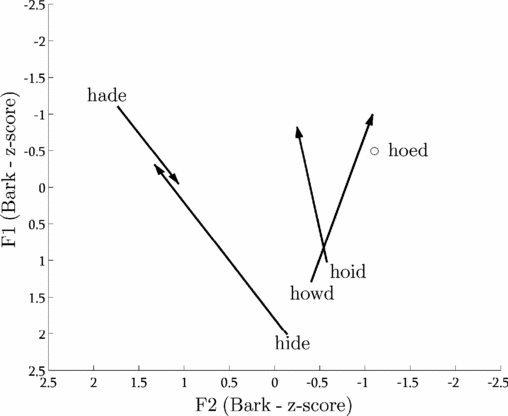
As figure 14 suggests, the starting quality of mouth (howd) for speaker RPG is not as open as in sse, while speaker MJM (figure 13) has a comparatively back starting point. The mouth (howd) and goat (hoed) diphthongs tend to point to the same direction, which was not the case in sse (figure 4) where howd pointed to hoard, while hoed pointed to hood.
Median starting and end point for the five closing diphthongs produced by speaker MJM of crn.

Median starting and end point for the five closing diphthongs produced by speaker RPG of crn.

The vowel of hared is either a long monophthong (sometimes r-coloured) or a monophthong followed by an approximant. From the auditory analysis of all crn speakers, heered is almost unanimously realized as a monophthong plus approximant.
3.4 East Anglia (ean)
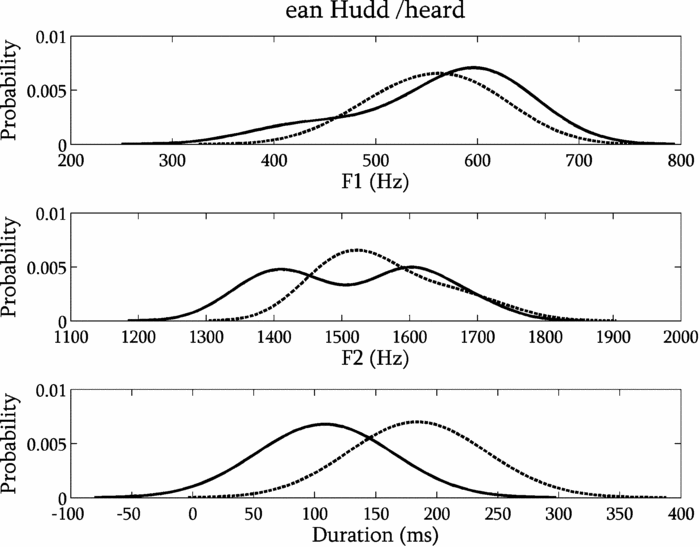
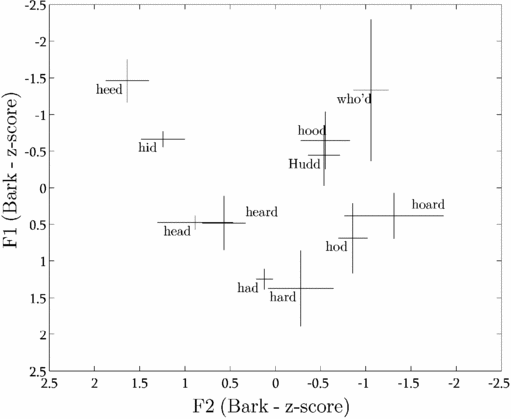
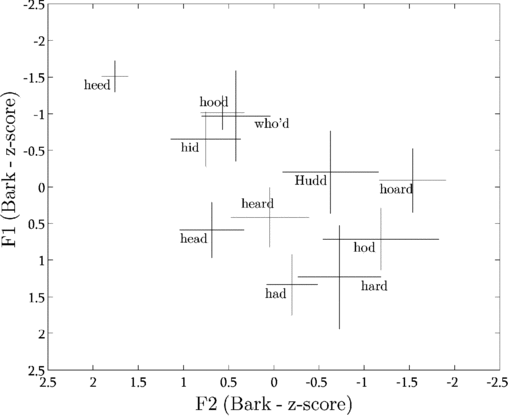
The vowel system of the East Anglia (ean) sample from the ABI corpus is very much like that of sse. As a preliminary remark, note that, in figure 15, the vowels of fleece and goose have been treated as monophthongs, although Trudgill (Reference Trudgill1999: 129) refers to them as diphthongs. It is true that many realizations deviate from perfectly steady formant contours (as is also the case in other accents, e.g. sse). However, for the sake of consistency in the presentation, and following our auditory impression that the degree of diphthongization in heed and who'd was far from matching that of hade or hide (etc.), we decided not to regard the vowels of heed and who'd as diphthongs. As figure 15 shows, the vowels of heard (nurse) and Hudd (strut) are conspicuously close to one another. An alternative representation of these two vowels can be found in figure 16, where the estimated probability densities of F1, F2, and duration are plotted. The dashed line stands for the nurse vowel and the solid line represents strut. The estimated densities for duration show some overlap, but, on average, nurse is almost twice as long as strut. The asymmetry of the F1 curve and the bimodality of the F2 curve for strut (solid line) tend to suggest that the variation found here is not a mere consequence of random fluctuation around the mean. Our hypothesis – after auditory assessment – is that some speakers have a robust spectral distinction between the two vowels (strut being slightly more open and back), while others produce vowel qualities that are closer to one another (although perceptibly not homophonous), and they may therefore rely more heavily on duration to implement the distinction.
Median and interquartile range for the 11 monophthongs produced by seven male speakers of ean.

Probability density estimates for Hudd (solid line) and heard (dashed line) by ean male speakers (F1, F2, and duration).

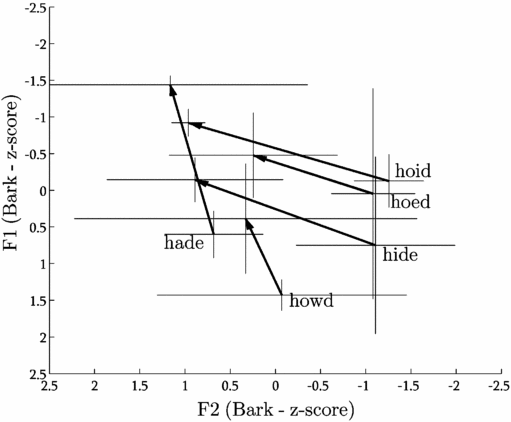
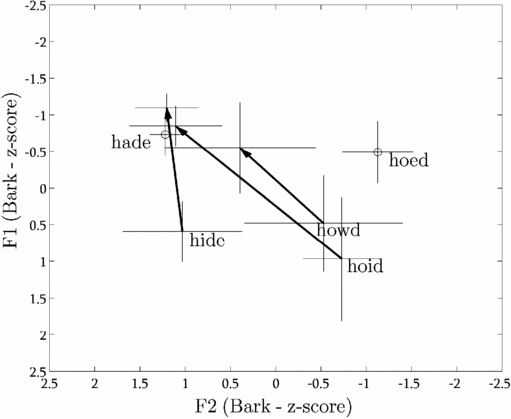
In figure 17 we can see that the starting qualities of price (hide) and choice (hoid) are comparatively close vowels, while goat (hoed) has a rather back starting point. The vowel of hared shows an exclusively monophthongal realization as do most realizations of heered.
Median starting and end point for the five closing diphthongs produced by five male speakers of ean.

3.5 East Yorkshire (eyk)
The accent of Hull has been described in Williams & Kerswill (Reference Williams and Kerswill1999). As a typical northern accent, neither the foot–strut split nor bath-broadening has occurred. The nurse–square merger is common (Williams & Kerswill Reference Williams and Kerswill1999: 146). East Yorkshire English is not rhotic.
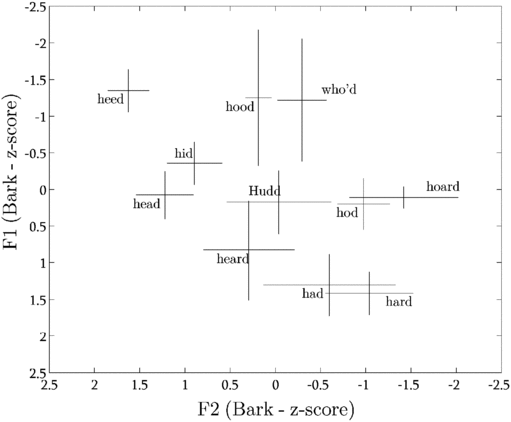
The monophthongs of the East Yorkshire (eyk) sample are shown in figure 18. Compared to most of the systems we describe in this paper, eyk retains comparatively back qualities for the vowels of goose and foot–strut (the latter two being clearly one single phoneme). The proximity between trap and start is confirmed by auditory analysis: it even seems that some speakers realize the contrast using duration only. A final remarkable point regarding figure 18 lies in the overlapping distributions of head and heard on the F1 and F2 dimensions. The median duration values are 166 ms and 281 ms, respectively: the two vowels cannot therefore be said to be phonetically (and probably phonologically) identical, but it seems that some speakers only rely on duration to distinguish the two.
Median and interquartile range for the 11 monophthongs produced by eight male speakers of eyk.

The face (hade) and goat (hoed) vowels are monophthongs (figure 19) although some closing diphthongs are attested. The price (hide) vowel shows narrower formant movements (from about [a] to [e]) with a definite front vowel as its starting point. Some monophthongal realizations can also be heard; according to Williams & Kerswill (Reference Williams and Kerswill1999: 146) this variant is restricted to cases where the vowel is not followed by a voiceless consonant, and it is found in working-class speech only. Hared has a monophthong for most speakers, in which case it rhymes with heard. Heered has a centring diphthong (sometimes nearly monophthongal).
Median starting and end point for the five closing diphthongs produced by six male speakers of eyk.

3.6 Glasgow (gla)
The accent of Glasgow (gla) is rhotic; but, as recent publications have shown (Stuart-Smith Reference Stuart-Smith2007, Scobbie Reference Scobbie2007), there is evidence supporting an ongoing change possibly leading to the loss of /r/ in coda position. From our data, the realizations of /r/ vary quite a lot (alveolar flap or approximant, schwa-like vowel, or no acoustic equivalent). By way of example, figure 20 is a spectrogram of a non-rhotic version of hard produced by the speaker WNH of gla. As far as we can tell, there does not seem to be any spectral cue supporting the presence of a phonetic event corresponding to /r/, which confirms our auditory impression.
Non-rhotic version of hard produced by the speaker WNH from gla.

Typical vowel systems of Scottish English have generally undergone the foot–goose merger and the lot–thought merger (Stuart-Smith Reference Stuart-Smith1999, Reference Stuart-Smith2004). In addition, the opposition between north and force is generally preserved (Wells Reference Wells1982: 408). Unfortunately, except for the first one just mentioned, these phenomena could not be tested due to the lack of appropriate test-words. Also typical of Scottish English is the lengthening of some morpheme-final vowels when followed by a suffixal /d/ as part of the Scottish Vowel Length Rule (Wells Reference Wells1982: 400–401; Scobbie, Hewlett & Turk Reference Scobbie, Hewlett and Turk1999). The vowel in who'd can therefore be expected to be longer than its counterpart in hood. As figure 21 shows, the foot–goose merger seems to be supported by acoustic (spectral) evidence. However, the difference in median duration between hood and who'd (163 ms and 244 ms, respectively) suggests that, as we anticipated, the Scottish Vowel Length Rule applies to who'd here. This raises the possibility that the vowels of hood and who'd are actually separate phonemes (we return to this in the Discussion).
Median and interquartile range for the 11 monophthongs produced by seven male speakers of gla.

One of the most striking realizational features of gla is exemplified by the test-word hid: the kit vowel is indeed quite retracted to the extent that it can be said, for descriptive purposes, to cluster with central – rather than front – vowels. This feature agrees well with previous findings by Eremeeva & Stuart-Smith (Reference Eremeeva and Stuart-Smith2003).
As far as diphthongs are concerned, figure 22 shows the typically Scottish [ɛj] realization of the price (hide) vowel. Face (hade) and goat (hoed) are monophthongs. Hared has a monophthong of the [e] or [ɪ] type, followed by a /r/. The starting element of heered is the same vowel as in heed, and it is also followed by /r/.
Median starting and end point for the five closing diphthongs produced by seven male speakers of gla.

3.7 Lancashire (lan)
The accent of Lancashire (lan) belongs to the linguistic north of England. More specifically, according to the typology of English dialects by Hughes, Trudgill & Watt (Reference Hughes, Trudgill and Watt2005), the town of Burnley is part of the Central Lancashire area, which is rhotic, although this peculiarity is receding. In fact, almost all speakers in our lan sample are non-rhotic. Wells (Reference Wells1982: 367–368) already noted that, although Lancashire accents were popularly thought to be rhotic, this feature was restricted to an ever shrinking number of areas.
As can be seen on figure 23, the absence of foot–strut split is well attested. Contrary to what has been observed for eyk (figure 18), the goose vowel has a relatively front quality. The vowels of had and hard are on average further apart than in eyk, although partial overlap is visible.
Median and interquartile range for the 11 monophthongs produced by 10 male speakers of lan.

The diphthongs in figure 24 follow approximately the same pattern as in eyk: face (hade) and goat (hoed) are realized as monophthongs, the quality of the latter being perceptibly more back than the average eyk realization. Some speakers have a perfect homophony between hoed and hoard. As in eyk, price (hide) shows rather narrow formant movements, but here, the monophthong is more frequent. Hared is a long monophthong and most occurrences of heered are centring diphthongs.
Median starting and end point for the five closing diphthongs produced by nine male speakers of lan.

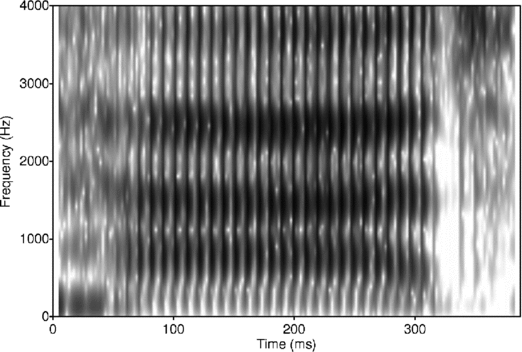
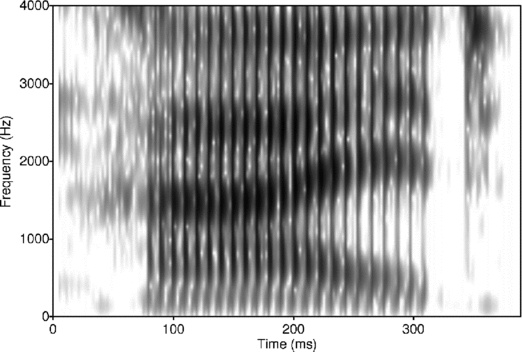
Figure 25 and figure 26 show spectrograms of a monophthongal and a diphthongal realization of hide produced by the same speaker. These figures illustrate that within-accent variation occurs both between speakers and within one single speaker.
Monophthong version of hide produced by the speaker PDK from lan.

Diphthong version of hide produced by the speaker PDK from lan.

3.8 Liverpool (lvp)
The Liverpool accent (lvp) is also typically northern (in terms of vowel system) although it has salient distinctive pronunciation features of its own. Much of its phonetic specificity seems to stem from the massive intake of Irish immigrants during the 19th century (Wells Reference Wells1982: 371). As Knowles (Reference Knowles and Trudgill1978: 80) remarks, ‘[it is] an interesting hybrid: on the phonological level, it remains similar to the dialects of neighbouring northern towns, but phonetically it has been heavily influenced by Anglo-Irish’.
The most typical systemic feature, especially in working-class speech, is the nurse–square merger (Beal Reference Beal2004: 125). The foot–strut split has not taken place and bath-broadening is attested from the middle classes upwards (Watson Reference Watson2006: 57).
Figure 27 shows, among other things, the absence of a foot–strut split, the proximity of hod and hard, and that of hid and heard. The auditory analysis confirms the small spectral distance between hod and hard; but the distinction is nevertheless rendered by differences in duration. Note also that, while the vowel of hood/Hudd remains back, who'd is clearly front. Heard has a long monophthong whose quality is similar to that of hid.
Median and interquartile range for the 11 monophthongs produced by eight male speakers of lvp.

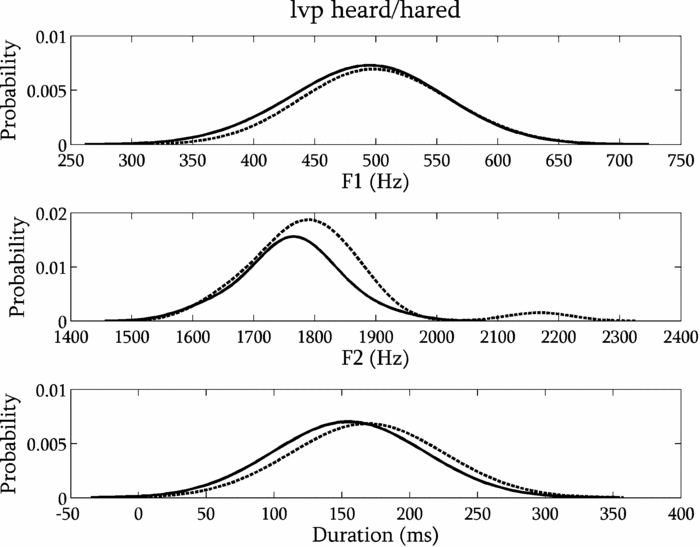
As figure 28 shows, lvp, contrary to most northern accents, has phonetic closing diphthongs in face (hade) and goat (hoed). Incidentally, here again, the first element of hoed is more back in men than in women. Hared is a long monophthong, and it is homophonous with heard: the nurse–square merger can be seen more clearly in figure 29.
Median starting and end point for the five closing diphthongs produced by five male speakers of lvp.

Probability density estimates for heard (solid line) and hared (dashed line) by lvp male speakers (F1, F2, and duration).

3.9 Newcastle (ncl)
Newcastle (ncl) clusters with northern English accents. In accordance with previous descriptions (Watt & Allen Reference Watt and Allen2003), the nurse vowel is rather front and close; an auditory assessment confirms that, for most speakers, this vowel lies in the region between [ø] and [œ]. Figure 30 and figure 31 show a complex pattern for Hudd, hood, and who'd. In most speakers, the lack of foot–strut split is evident but some speakers – including speaker TXR in figure 31 – rhyme hood with who'd: we therefore listened to potential foot words in the read passage of the ABI corpus in order to make out whether the homophony of hood and who'd was the consequence of a hypothetical foot–goose merger or the outcome of fluctuating lexical incidence. If the latter were true, it would mean that hood belongs to the goose set for many speakers in our ncl sample. Wells (Reference Wells1982: 362) indicates that the goose set may include some words with the spelling 〈-ook〉 in the north. As it turned out, the auditory analysis showed that the vowels in took, cook, looked and foot were perceptibly different from that of who'd. It therefore seems that the homophony between hood and who'd is a result of hood patterning with goose in many ncl speakers, which emphasizes how crucial the choice of test-words that are meant to elicit the structure of vowel systems can be.
Median F1/F2 for the 11 monophthongs produced by speaker GGC of ncl.

Median F1/F2 for the 11 monophthongs produced by speaker TXR of ncl.

In figure 32, speaker GGC produces a closing diphthong in face (hade) and a monophthong in goat (hoed ). Speaker TXR (figure 33) has a centring diphthong in hade and a monophthong in hoed. The vast majority of male speakers in our ncl sample (i.e. according to our auditory judgement based on the whole ncl sample, prior to the screening that left us with just two speakers) have a centring diphthong in face. Hared has a long monophthong and heered, a centring diphthong.
Median starting and end point for the five closing diphthongs produced by speaker GGC of ncl.

Median starting and end point for the five closing diphthongs produced by speaker TXR of ncl.

3.10 North Wales (nwa)
According to Penhallurick (Reference Penhallurick2004: 98–100), accent geography in Wales has been to a great extent fashioned by the two dialects of the Welsh substratum (north-west vs. mid-south), the varying degrees of resistance to anglicization, and the influence of pronunciation features typical of neighbouring English counties. Welsh English is usually considered non-rhotic (Wells Reference Wells1982: 378); but, in traditional Welsh-speaking areas (i.e. the west) or regions close to rhotic English counties, /r/ can be systematically realized in all positions (Penhallurick Reference Penhallurick2004: 110–111). As far as vowels are concerned, both Wells (Reference Wells1982: 380) and Penhallurick (Reference Penhallurick2004: 103) mention the possibility of strut being merged with schwa. In the north-east – recall from table 1 that our sample was recorded in Denbigh – some strut words have the typical foot vowel as in the nearby accents of the north of England.
Figure 34 shows that, in contrast with many systems dealt with in this paper, the goose vowel is clearly back. All the pairs consisting of two vowels separated by a small spectral distance in the figure are easily distinguishable by ear: out of the 20 speakers in the nwa sample, 13 apparently rely solely on duration to separate had from hard, whereas the remaining 7 use both duration and the front/back axis.
Median and interquartile range for the 11 monophthongs produced by seven male speakers of nwa.

Figure 35 shows the diphthongs of nwa. It should be noted that some speakers have a monophthong in hade and hoed. Hared has a long monophthong and heered, a centring diphthong.
Median starting and end point for the five closing diphthongs produced by seven male speakers of nwa.

3.11 Republic of Ireland (roi)
From Wells's account of Irish English it seems that the accent of English spoken in Southern Ireland has remained particularly impermeable to Anglo-English and American innovations (Wells Reference Wells1982: 418). The political independence of the Republic of Ireland is paralleled linguistically by the fact that Received Pronunciation is considered an ‘extra-national norm not aspired to’ (Hickey Reference Hickey1999: 265). Irish English is usually thought to be rhotic, and in some cases, this rhoticity surfaces as an r-colouring spanning the whole of the preceding vowel. However, according to Hickey (Reference Hickey1999: 272), rhoticity varies even within Dublin, the more rhotic speakers being associated with higher prestige. Turning to vowels, the best-known systemic phenomenon is probably the nurse–square merger, which is, according to Wells (Reference Wells1982: 421), not a stigmatized feature (unlike in Liverpool). More details on phonological and phonetic phenomena can be found in Hickey (Reference Hickey1999, Reference Hickey2004).
Figure 36 illustrates the monophthongs of roi. The overlap of Hudd and hood tends to support the lack of foot–strut split. According to Hickey (Reference Hickey2004: 91), this feature characterizes ‘Popular Dublin’ as opposed to ‘Fashionable Dublin’.
Median and interquartile range for the 11 monophthongs produced by seven male speakers of roi.

The diphthongs are plotted in figure 37. Some realizations of hade are monophthongal. Depending on the speaker, the starting quality of hide is either front or back. The vowel in the test-word hoed ranges from a quasi-monophthong to a diphthong. In many speakers, the final element of howd is clearly [ʉ].
Median starting and end point for the five closing diphthongs produced by six male speakers of roi.

3.12 Scottish Highlands (shl)
The town of Elgin is situated at the eastern end of the Scottish Highlands. Scottish Gaelic is still sporadically spoken in this area, hence the influence of Gaelic phonology – especially consonantal phenomena – on the variety of English spoken there (Wells Reference Wells1982: 412–414; Stuart-Smith Reference Stuart-Smith2004: 50). Contrary to gla, rhoticity is maintained in our shl sample by all speakers; some of them have a trill rather than an approximant.
The vowel in hid is not as centralized as its gla counterpart; in addition, the centralized variant is not as frequent as in gla (see figure 38 for a close variant and figure 39 for a central variant).
Spectrogram of a close variant of the vowel in hid by speaker CNB from shl.

Spectrogram of a central variant of the vowel in hid by speaker GDW from shl.

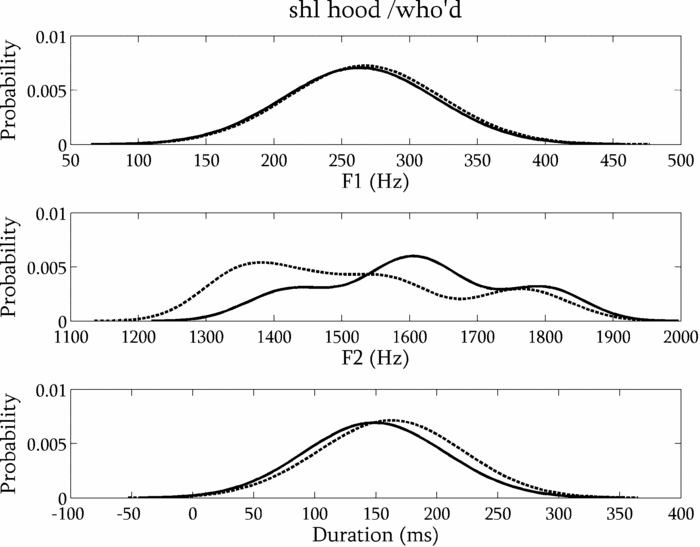
Contrary to what we expected from a Scottish accent, figure 40 does not seem to support a potential foot–goose merger. A closer look at this pair (figure 42) shows that hood and who'd have similar F1 and duration values, but the distributions of F2 values do not overlap. So, at least some speakers have an acoustic difference in the F2 dimension. From the duration distributions, it can be concluded that contrary to what we have observed for gla, who'd is not a candidate for the Scottish Vowel Length Rule. Actually, an auditory assessment shows that the realizations of hood and who'd are not homogeneous across speakers. While most of them produce identical vowels, others have a spectral difference.
Median and interquartile range for the 11 monophthongs produced by 11 male speakers of shl.

Although hod and hoard are very close to each other in spectral quality, the /r/ in hoard still marks the difference. But the proximity between the two vowels leads us to think that at least some speakers have a lot–thought merger (which, of course, could not be elicited for want of an adequate test-word).
The face vowel (figure 41) is unanimously monophthongal, and so is goat; both are particularly close, to the extent that hoed in shl (and gla) probably has the vowel that comes closest to cardinal [u] in the whole corpus. The vowel in hide is of the [ɛj] type.
Median starting and end point for the five closing diphthongs produced by 11 male speakers of shl.

Probability density estimates for hood (solid line) and who'd (dashed line) by shl male speakers (F1, F2, and duration).

3.13 Ulster (uls)
Even though the province of Ulster belongs to the same geographical entity as the Republic of Ireland, Ulster English shares many pronunciation features with Scottish English, mainly on account of an important influx of Scots settlers in the 17th century (Hickey Reference Hickey2004: 68). The accent is rhotic; /r/ is generally realized as a retroflex approximant (Wells Reference Wells1982: 446). The vowel system and the phonetic quality of vowels (as described in Wells Reference Wells1982: 438–440) share a number of features with Scottish English. For instance, vowel length plays a restricted systemic role. foot and goose are one single phoneme, and so are (potentially) lot and thought.
The monophthongs of uls are plotted in figure 43. Among the most notable features is the overlap between foot (hood) and goose (who'd) and the retracted quality of kit (hid). The foot and goose vowels seem to be more front than their shl counterparts; the lengthening of who'd is not unanimous.
Median and interquartile range for the 11 monophthongs produced by six male speakers of uls.

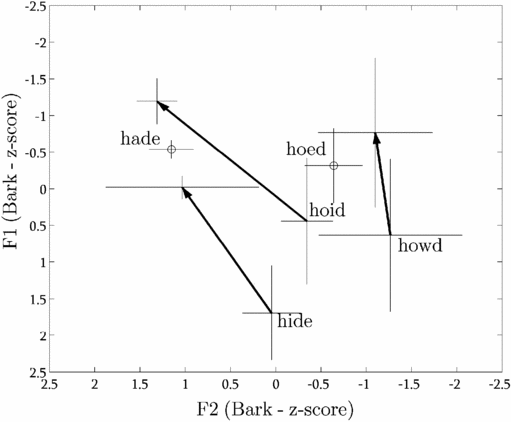
In figure 44, the arrow corresponding to hade points towards the top of the plot: this is probably an artefact due to the multiple variants produced by the speakers in the sample. The general (auditory) picture suggests that the main variant is a centring diphthong; monophthongs and closing diphthongs can also be found. The first element of the hoid vowel is also quite variable. As figure 44 suggests, it is quite open for most speakers. Hared and heard are homophonous in 14 (out of 20, men and women inclusive) speakers (hence the nurse–square merger is attested for half of the speakers). The vowel is either realized as [ɜ] or [ɛ].
Median starting and end point for the five closing diphthongs produced by five male speakers of uls.

3.14 Summary
The F1/F2 plots above illustrate the vowel systems (derived from acoustic data) of 13 accents of the British Isles. But these graphs should be generalized with caution. The spectrograms and probability density plots that have been included here clearly illustrate that within-dialect variation occurs both at the inter- and intra-individual level. Now, had we carried out a qualitative analysis, it would have been easier to show how many speakers of an accent produce such or such variant of a given phoneme. But in our case – i.e. with quantitative formant data – measures of central tendency without prior qualitative assessment can lead to computing averages over formant data emanating from very different phonetic events. For instance, computing average formant values over the three variants of the face vowel in ncl (monophthong, centring and closing diphthong) without distinguishing each variant a priori is not really informative. But from what degree of formant instability should we consider that the vowel under study is a diphthong rather than a monophthong? Should we trust our judgement as trained phoneticians, or ask naïve native speakers; in which case, should they just be native speakers of English or of Tyneside English?
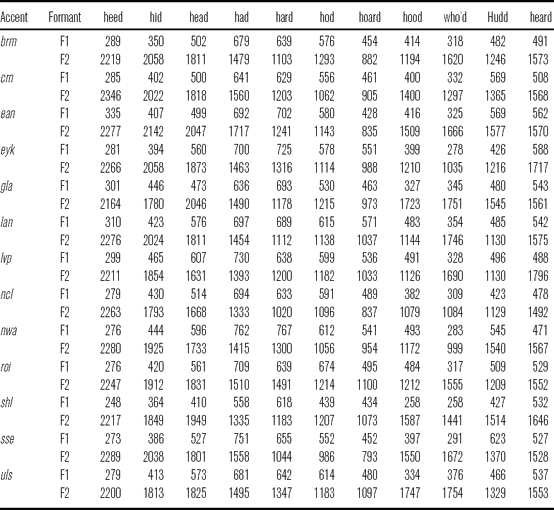
Despite this weakness, the median formant values for each monophthong in each dialect are shown in table 3. The values are in Hertz since it seems to us that it is the most widely used frequency scale, and it therefore makes comparisons with other publications easier.
Median formant values for the 11 monophthongs (Hz).

4 Discussion
Following our twofold goal, this section first provides a discussion of the findings and then tackles some methodological issues.
Overall, on the systemic level, our findings agree well with previous descriptions. However, in some accents, considerable variation between speakers can be observed. For instance, as we have seen, the brm sample is equally divided between speakers with, and speakers without, the foot–strut split. According to Wells (Reference Wells1982: 352), in the West Midlands area, all speakers have two phonemes here, but the opposition may be neutralized in some cases, and lexical incidence is uncertain. The list of /hVd/ words did not allow us to test potential neutralizations or problems of lexical incidence, but it is clear from our data that, if the strut vowel is the key criterion for telling the English linguistic north from its southern counterpart, then, Birmingham can probably be seen as a transitional area. The other accents of the north of England represented in the ABI corpus are, in this respect, undoubtedly northern.
The nurse–square merger is the norm in the following samples: eyk, lvp, roi, and uls. From our data, the foot–goose merger seems to hold, at least partially, for gla, shl, and uls. In gla, the vowels of hood and who'd are spectrally identical but the latter is systematically longer, as a consequence of the Scottish Vowel Length Rule. In shl, the lengthening of who'd is not systematic, and there seems to be a difference in F2. In uls, there is no spectral difference between the two vowels, and lengthening occurs in many speakers. The difference between the median duration of who'd and that of hood in gla, shl, and uls are 81 ms, 32 ms, and 32 ms, respectively. This clearly shows that the manifestation of the Scottish Vowel Length Rule through vowel lengthening caused by suffixal /d/ is probably more typical of Glasgow than the other two.
Throughout the article, hood and who'd have been used as typical members of the foot and goose sets. We saw in our ncl sample the possibility that hood may actually be a member of goose for some speakers, which is simply a consequence of fluctuating lexical incidence. A more challenging situation arises when it comes to using who'd as a typical member of goose in those accents were the Scottish Vowel Length Rule applies. The vowel in who'd can be interpreted as part of a subset of goose words whose vowel is long due to morphological conditioning. In order to facilitate dialectological analysis, it may be a good idea to signal the distinction by using a different key word (e.g. brewed) as is common practice when the phonology of an accent requires it (Foulkes & Docherty Reference Foulkes and Docherty1999: 7; for an example of lexical sets adapted to local needs, see e.g. Stuart-Smith Reference Stuart-Smith2004: 53–56). As for the inclusion of this vowel in the phonemic inventory, hood and who'd can be seen as a minimal pair in gla, and their difference in median duration (81 ms) is probably sufficient to maintain a viable phonological opposition (By way of comparison, the difference in median duration for the duration-only based contrast between had and hard in eyk is 106 ms). So, surely, the vowel in brewed words is a good candidate for phonemic status but, quite circularly, it all depends on how gradient the phonological analysis used to interpret this phenomenon is (see Chitoran & Cohn, to appear, for an overview of gradient vs. categorical phonology).
Turning to notable phenomena on the realizational level, the quality of the goose vowel is particularly variable across accents. But, as we have shown elsewhere (Ferragne Reference Ferragne2008: 295–296), it does not constitute a reliable accent indicator because between-accent variation is compensated by huge within-accent variability. The general trend shows an increasingly frequent fronted quality in goose. In some accents, this is the result of a recent change (e.g. sse: Hawkins & Midgley Reference Hawkins and Midgley2005, McDougall & Nolan Reference McDougall and Nolan2007), while in others (e.g. gla: Wells Reference Wells1982: 402; Stuart-Smith Reference Stuart-Smith2004: 58–59), it is a long-established diagnostic trait. Some of the accents in our dataset are rather conservative with respect to goose fronting: crn, eyk, ncl, nwa, roi (not fully back, though), and shl (as opposed to gla, but not systematically). Where goose fronting occurs, it is hard to see or foresee the consequences of this phenomenon, and it is difficult to tell whether this could lead to genuine chain shifting. Labov's third principle of vowel shifting states that back vowels move to the front (Labov Reference Labov1994: 116ff.); as it happens, the principle agrees well with foot and goose in our data for many accents (especially sse and ean). Note, however, that in lan and lvp, goose fronting is not accompanied by foot fronting. It may well be that our data show three different stages of a potential partial chain shift: (i) neither goose nor foot seems to have moved from its back position (typically in eyk) – incidentally there is nothing in our data that tells us that the change will ever apply here; (ii) only goose, but not foot, has moved to a fronter position (lan and lvp); and (iii) both goose and foot are rather front (typically in sse and ean).
Chain shifting normally implies that the moving entity in the system either ‘drags’ or ‘pushes’ adjacent phonemes. Concerning a potential push-chain mechanism, this seems very unlikely, for two reasons. Firstly, from our data, the fleece vowel does not seem to depart to any noticeable degree from its position in previous studies. Secondly, vowel systems in the world's languages can easily ‘handle’ two front close vowels – one rounded, the other, not – as in French, German, Norwegian, etc. (24 out of 451 languages have the two phonemes in the UCLA Phonological Segment Inventory Database (UPSID); Maddieson Reference Maddieson1984, Maddieson & Precoda Reference Maddieson and Precoda1990). Thus, not only is there no evidence showing a possible movement of fleece, but also, there is no intrinsic reason why the current position of fleece should be threatened by the fronting of goose. Now, a drag-chain mechanism – which would cause hoard, or monophthongal hoed, to move one step higher – remains possible, all the more so as, according to Labov's second principle, long vowels rise in chain shifts (Labov Reference Labov1994: 116ff.). If we contrast ean and sse – two accents where goose and foot are comparatively front – with eyk and nwa – two accents where goose and foot are comparatively back, it appears that hoard is clearly more close in the former, which is consistent with a drag-chain mechanism. However, only a longitudinal study would shed light on this. For the time being, the data on RP in Hawkins & Midgley (Reference Hawkins and Midgley2005) do not support our tentative hypothesis: their results show that, while F2 in who'd moved from 994 Hz on average (male over 65 years old) to 1616 Hz (male between 20 and 25 years old), F1 in hoard remained constant (391–392 Hz).
Rhoticity constitutes another important aspect of accent variation, which may have dramatic consequences on vowel systems. Our results tend to confirm ongoing changes. Contrary to our expectations, our lan sample is virtually not rhotic. The loss of /r/ here is probably just a continuation of the well-known change initiated in RP in the eighteenth century. This change has been associated with high prestige in England, notably because, according to Trudgill (Reference Trudgill1990: 53), BBC newsreaders adopted non-rhoticity very early. But clearly, the fact that non-rhoticity correlates with high social status in England does not necessarily apply to neighbouring countries. For example, in her review of rhoticity in Scottish English, Stuart-Smith (Reference Stuart-Smith2004: 62–63) shows that the ongoing loss of /r/ is mainly a working-class phenomenon. Note, incidentally, that derhoticization in Glasgow (Stuart-Smith Reference Stuart-Smith2007) is a gradient phenomenon in that the total absence of a phonetic event (as shown in figure 20) is not the only possibility. Besides, a mere perceptual analysis may not be sufficient: Scobbie (Reference Scobbie2007) used ultrasound tongue imaging to show that his acoustically and auditorily ‘derhoticized’ subject retained a covert rhotic-like tongue gesture.
The consequences of derhoticization on vowel systems have been especially well documented in RP (see, among others, Wells Reference Wells1982: 213–222). Our sse data suggest that the monophthonging of centring diphthongs – which Wells saw as a potential subsequent development (centring diphthongs in RP being the result of /r/ loss) – seems to be the norm for the test-word hared, but not for heered. To what extent the former result may be interpolated to other members of the square set, we do not know – bear in mind, though, that Upton (Reference Upton2004: 226) encourages the use of a monophthong symbol for the whole lexical set – but if monophthonging goes on to affect all centring diphthongs (as it already does the cure vowel – Wells Reference Wells1982: 361), phonological length will become an increasingly important parameter in the RP system. Post-/r/-loss monophthonging is attested in our data in some accents to various degrees: monophthongal hared can be heard in all non-rhotic accents and, very often, the monophthong is more frequent than the diphthong. So if these accents follow the same path as RP, then increasing importance of duration as a phonological feature may well affect them too.
Now we turn to methodological issues. Except for the semi-automatic procedure whereby formant values were computed, the method we have used in this description is fairly classic and consensual. However, it involves a number of shortcomings which we would like to comment upon, namely, the bias caused by z-scoring the data, and the weaknesses of the word list.
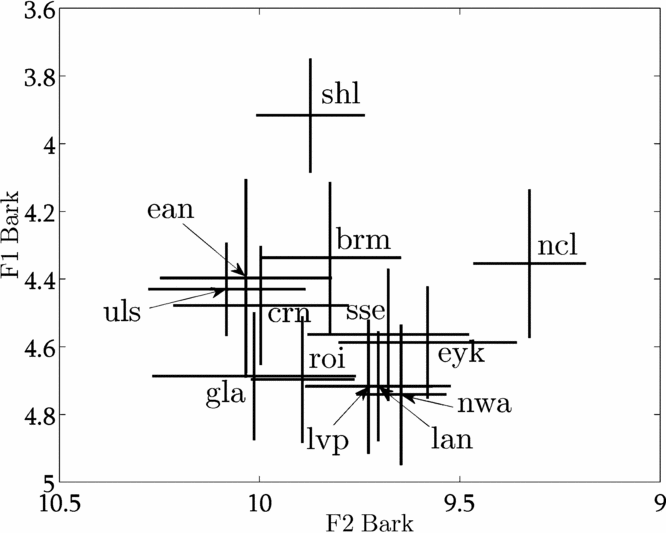
The z-score transform is expected to reduce within-dialect variability by playing down the impact of variable vocal tract sizes between speakers. In fact, the transform alters all individual F1/F2 plots so that they have similar mean and spread. While this is convenient for within-accent normalization (in some way, we want speakers of the same accent to be as similar as possible), it also erases potential between-accent differences. It is generally acknowledged that permanent features – subsumed under generic headings such as ‘voice quality’ and ‘articulatory settings’ – play an important role in accent distinction (see, inter alia, Stuart-Smith Reference Stuart-Smith1999: 211ff.), and some of these features may well be reflected in vowel-space centroid and spread, i.e. exactly the information that has been lost after the z-score transform. As a preliminary check, figure 45 shows means and 95% confidence intervals of vowel system centroids per accent in the F1 and F2 dimensions for the male speakers. Mean F1 and F2 values in Bark were first computed for each type of monophthong, yielding 11 F1 and 11 F2 values per speaker. Then individual centroids were calculated by averaging these 11 values. Finally, the mean and standard deviation for each accent were obtained by computing mean individual centroids.
Mean and 95% confidence intervals for male speakers.

The results in the figure tend to suggest that there are differences in centre of gravity between dialects. Now, whether this is a mere consequence of a sampling bias or a genuine difference, we cannot tell. But if it could be shown that the difference is reliable, then it definitely should be taken into account. This could be achieved, for instance, by computing centroids for all accents, and adding the appropriate accent centroid values to a speaker's F1 and F2 z-scored values.
Now, let us consider the word list, and, in particular, its comprehensiveness. The word list used for the ABI corpus is meant to elicit the phonemes of what we have called Standard Southern English (sse). Relevant quasi-phonemic contrasts (e.g. trap–bath) cannot be elicited. What is more, when recorded by speakers from other regions, the list allows for testing if the speakers have fewer vowel phonemes (than sse), but it is unfortunately inadequate if one wants to address the question of a potential greater number of phonemes (or standard lexical sets). For instance, it seems that there is a distinction in some accents in the north of England between the vowels of 〈wait〉 and 〈weight〉 ([eɪ] and [ɛɪ], respectively; Beal Reference Beal2004: 123). The phonetic value of the price vowel in ncl has been shown to be conditioned by the following consonant: [ɛɪ] before voiceless stops and fricatives, [aɪ] elsewhere (Watt & Milroy Reference Watt and Milroy1999: 28–29). In addition, in working-class speech, the price vowel in Hull (eyk) is a diphthong before voiceless consonants and a monophthong elsewhere (Williams & Kerswill Reference Williams and Kerswill1999: 146). The Scottish Vowel Length Rule (Scobbie et al. Reference Scobbie, Hewlett and Turk1999) also generates dialect-specific pronunciations, both in terms of duration and spectral quality. A final example, taken from Wells (Reference Wells1982: 421), shows that in (southern) Irish English, the words 〈pair〉, 〈per〉 and 〈purr〉 can have three or two separate phonemes or just one single phoneme depending on the specific accent. It follows from these chosen examples that such variation, whatever its linguistic status – i.e. whether it is phonemic, quasi-phonemic, lexical-incidental, allophonic, etc. – does play an indexical role and should therefore be elicited through appropriate test-words.
Another key element related to the word list lies in that some test-words were likely not well-suited to elicit the intended lexical set. As mentioned at the beginning of the article, the test-word hured proved problematic on account of great within-accent variation, both across speakers and within a single speaker. This turned out to be quite frustrating since the cure set is known – as a result of an ‘all-England trend’ (Wells Reference Wells1982: 361) – to have undergone a phonological change in recent years. By way of example, the results of an opinion poll on pronunciation preferences in Wells (Reference Wells2008: 628) show that 74% of people surveyed favoured /pɔː/ rather than /pʊə/ (26%) in 〈poor〉; and the difference appears to be correlated with age. Now why hured triggered so much variation and hesitation remains unclear. Rarity or obsolescence cannot count as the only factors since other equally rare (or non-existent) test-words (heered, hoid, etc.) elicited the intended lexical set perfectly well. A tentative answer would be that it seems here that the spelling-to-pronunciation correspondence is not as straightforward as in other words; but, surely, other test-words (cure, poor, Ruhr, etc.) would be needed to check if somebody uses /ɔː/ in cure words and whether their cure set has been totally or only partially affected.
5 Conclusion
Our goal has been to provide an up-to-date acoustic description of the vowels of 13 accents of the British Isles. For each accent, F1/F2 graphs for monophthongs and diphthongs with z-scored Bark frequencies have been discussed with particular focus on pairs of vowels whose two members were conspicuously close to each other. Some such pairs were inspected more closely with the help of probability density estimate plots. Spectrograms were also included in order to exemplify the extent of within-dialect individual – and sometimes within-speaker – variation. A table containing formant frequencies at temporal midpoint for the 11 monophthongs in the 13 accents has also been provided so as to facilitate comparison with other studies.
Overall, the study was complicated by individual variation, which would have probably been reduced (though supposedly not eliminated) by a stratified sampling strategy involving fine-grained criteria (age, social factors) leading to clustering speakers into more homogeneous sub-accents (see e.g. Labov Reference Labov2001). The second main obstacle arises from the use of automatic formant extraction. As stated previously, formant measurements generally necessitate human intervention, which raises reproducibility issues. On the contrary, our method is entirely reproducible but it led to significantly reducing the number of vowels and speakers and, despite the use of robust estimators and smoothing techniques, some frequency values were definitely erroneous. While the first drawback mentioned (lack of serious sampling for speaker recruitment) can hardly be overcome without recording another corpus, our future efforts will concentrate on other frequency parameters whose extraction is totally automatic.
Acknowledgements
The authors would like to thank John Esling, Francis Nolan, Jane Stuart-Smith and two anonymous reviewers for their invaluable help.