Introduction
Microbial mat communities are the most conspicuous biological features in the McMurdo Dry Valleys (MDV) of Antarctica, and factors controlling their habitat-scale distribution and activity have been studied for decades (Howard-Williams & Vincent Reference Howard-Williams and Vincent1989, Alger et al. Reference Alger, McKnight, Spaulding, Tate, Shupe and Welch1997, Taton et al. Reference Taton, Grubisic, Brambilla, de Wit and Wilmotte2003, Stanish et al. Reference Stanish, Nemergut and McKnight2011). Microbial mats consist primarily of filamentous cyanobacteria of the genera Nostoc, Phormidium and Oscillatoria. They are widely distributed throughout the MDV, occupying intermittently saturated meltwater environments including riparian zones of streams and lake margins (Alger et al. Reference Alger, McKnight, Spaulding, Tate, Shupe and Welch1997, Taton et al. Reference Taton, Grubisic, Brambilla, de Wit and Wilmotte2003, Wood et al. Reference Wood, Rueckert, Cowan and Cary2008, Pointing et al. Reference Pointing, Chan, Lacap, Lau, Jurgens and Farrell2009, Kohler et al. Reference Kohler, Stanish, Crisp, Koch, Liptzin, Baeseman and McKnight2015). These cyanobacteria-dominated habitats are hotspots of biodiversity and productivity and are sentinels of environmental change, including both climate variation and human disturbance (Esposito et al. Reference Esposito, Horn, McKnight, Cox, Grant and Spaulding2006, Stanish et al. Reference Stanish, Nemergut and McKnight2011, Sokol et al. Reference Sokol, Herbold, Lee, Cary and Barrett2013, Kohler et al. Reference Kohler, Stanish, Crisp, Koch, Liptzin, Baeseman and McKnight2015).
Presently, investigators with the McMurdo Dry Valleys Long Term Ecological Research (MCM LTER) Project predict that 1) increased glacial melt and permafrost thaw associated with climatic warming will increase homogeneity in biogeochemical cycling and community composition across the landscape as water and species are mobilized, and 2) a more homogeneous landscape will amplify the ecosystem responses to anticipated increases in the frequency of extreme climate events (e.g. high stream flow and rapid lake-level rise) (Gooseff et al. Reference Gooseff, Barrett, Adams, Doran, Fountain and Lyons2017). These environmental changes will probably affect the distribution of microbial mats at the landscape scale, particularly in the transitional areas between aquatic and terrestrial environments such as the margins of streams and lakes (Barrett et al. Reference Barrett, Gooseff and Takacs-Vesbach2009). Responses of microbial mat communities to a climate regime of warmer summer temperatures and enhanced melt in the MDV may include increased mat coverage and productivity, decreased diversity of highly adapted endemic organisms and an overall homogenization of these communities as the ‘new normal’ (Esposito et al. Reference Esposito, Horn, McKnight, Cox, Grant and Spaulding2006, Stanish et al. Reference Stanish, Nemergut and McKnight2011, Gooseff et al. Reference Gooseff, Barrett, Adams, Doran, Fountain and Lyons2017). Such changes could fundamentally transform the energy balance and productivity of the MDV ecosystem.
In order to understand how environmental changes result in changes to ecosystem dynamics and productivity, characterization of microbial mat dynamics and estimations of their productivity at the scale of individual basins and valleys is required. However, at > 4500 km2 in size (Levy Reference Levy2013), it is impossible to perform systematic field investigations over the entirety of the MDV for an entire field season and over multiple years. While the MCM LTER Project has generated a record of critical environmental and ecosystem properties since 1993, the harsh polar environment and general inaccessibility of the MDV restrict such field investigations to either grab-sample approaches or to patch-scale surveys (~1–10 m2) where detailed measurements can be made at regular intervals (i.e. seasonal to annual) (McKnight et al. Reference McKnight, Niyogi, Alger, Bomblies, Conovitz and Tate1999, Reference McKnight, Tate, Andrews, Niyogi, Cozzetto and Welch2007). Without a more complete and integrated view of the MDV ecosystem and environment, however, it is difficult to extrapolate the patchy distribution of microbial communities (resulting from fine-scale environmental drivers) to estimates of current standing stocks of biomass as well as changes in biomass through time. These landscape-scale properties are essential for applying fundamental ecological theories (e.g. resistance, resilience) to the dominant primary producers in the ecosystem. Moreover, such information is becoming increasingly relevant to the signatory nations of the Antarctic Treaty, who set management policies and goals in addition to establishing Antarctic Specially Protected Areas for this region of Antarctica (Priscu & Howkins Reference Priscu and Howkins2016).
In this study, we investigate whether high-resolution orbital multispectral imagers can be used for 1) identifying microbial mat communities in the Fryxell basin of Taylor Valley, 2) isolating and characterizing their spectral signatures, and 3) estimating their distribution, coverage, abundance and changes throughout the landscape. We utilize spectral parameters and linear unmixing models to show that the spectral signatures of these biological communities can be identified and studied remotely in support of (and in conjunction with) more detailed ground-based measurements. Previous investigations have studied the distribution and relative abundance of lichen, mosses and grasses on the Antarctic Peninsula using low-resolution satellite data (e.g. Haselwimmer & Fretwell Reference Haselwimmer and Fretwell2009, Fretwell et al. Reference Fretwell, Convey, Fleming, Peat and Hughes2011, Casanovas et al. Reference Casanovas, Black, Fretwell and Convey2015, Kotta et al. Reference Kotta, Valdivia, Kutser, Toming, Rätsep and Orav-Kotta2018), while others have studied the spectral signatures of microbial mat communities in non-polar environments (e.g. Andréfouët et al. Reference Andréfouët, Hochberg, Payri, Atkinson, Muller-Karger and Ripley2003). While these previous studies have demonstrated the utility of remote-sensing data for both Antarctic and non-polar microbial mat characterization, our investigation is the first to apply similar techniques systematically to the ecological communities of the Fryxell basin of Taylor Valley, Antarctica. The ability to characterize the spatial and temporal variability of microbial mat communities using orbital data would be transformative to the field of Antarctic ecology and would help to constrain broader ecosystem dynamics by documenting the distribution and activity of microbial mat communities at the landscape scale. While this study aims to determine whether identifying and estimating key properties of microbial mats is possible, additional efforts to validate these techniques, to acquire in situ spectral data and to develop new methods and spectral relationships are left to future investigations.
Background and study region
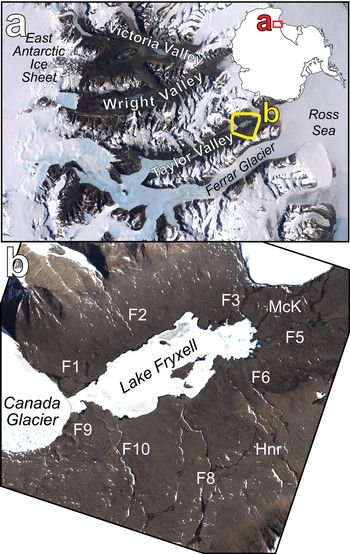
The Fryxell basin in Taylor Valley, Antarctica (Fig. 1), is centred on Lake Fryxell, a 7 km2 permanently ice-covered lake located between Commonwealth and Canada glaciers. Lake Fryxell is a closed-basin lake with no outlet channels, making the primary mechanism for water loss sublimation of the permanent ice cover (McKay et al. Reference McKay, Clow, Wharton and Squyres1985, Aiken et al. Reference Aiken, McKnight, Harnish and Wershaw1996) and possibly deep groundwater (Mikucki et al. Reference Mikucki, Auken, Tulaczyk, Virginia, Schamper and Sørensen2015). While the cold Antarctic temperatures result in frozen conditions for much of the year (mean annual temperature of -20.2°C at Lake Fryxell, with an average of only 25.5 degree days above freezing) (Doran et al. Reference Doran, McKay, Clow, Dana, Fountain, Nylen and Lyons2002), localized melting of nearby glaciers results in ephemeral meltwater streams that drain into Lake Fryxell during the warmest weeks of the summer. These ephemeral streams support photosynthetic microbial mat communities, especially along the wetted stream margins, which are well adapted to the harsh environmental conditions found in the Antarctic (Schwarz et al. Reference Schwarz, Green and Seppelt1992, McKnight et al. Reference McKnight, Niyogi, Alger, Bomblies, Conovitz and Tate1999). While these biological communities are present throughout the MDV, the Fryxell basin supports the greatest density and areal coverage due to the abundance of glacial melting and subsequent ephemeral runoff during the summer months (McKnight et al. Reference McKnight, Niyogi, Alger, Bomblies, Conovitz and Tate1999). Unlike other basins in Taylor Valley, the Fryxell basin hosts relatively shallow slopes flanking Lake Fryxell, allowing for these ephemeral streams to meander across the landscape and run for longer distances than streams in other basins.
a. Landsat mosaic of the McMurdo Dry Valleys with the location of the Fryxell basin outlined in yellow. b. The Fryxell basin of Taylor Valley. Labelled are individual stream channels using the original US Geological Survey naming convention from the 1990–91 field season: F1 (Canada Stream), F2 (Huey Creek), F3 (Lost Seal Stream), F5 (Aiken Creek), F6 (Von Guerard Stream), F8 (Crescent Stream), F9 (Green Creek) and F10 (Delta Stream). ‘McK’ (McKnight Creek) and ‘Hnr’ (Harnish Stream) are also indicated. Both images are true-colour representations. Imagery © 2013 DigitalGlobe, Inc.

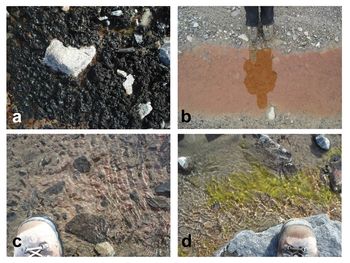
Microbial mats are the most abundant biota within the Fryxell basin, consisting primarily of cyanobacteria, but also including assemblages of chlorophytes, diatoms, bryophytes and bacteria (Fig. 2) (Alger et al. Reference Alger, McKnight, Spaulding, Tate, Shupe and Welch1997, Kohler et al. Reference Kohler, Stanish, Crisp, Koch, Liptzin, Baeseman and McKnight2015). Researchers have identified and described four primary microbial mat types that dominate distinct habitats within streams throughout the MDV (Alger et al. Reference Alger, McKnight, Spaulding, Tate, Shupe and Welch1997) based on mat colour, which reflects differences in accessory pigment compositions of the dominant mat organisms. Green mats occur in small patches or as streamers attached to rocks (~10-2 m in length) and are dominated by the chlorophyte genus Prasiola (Alger et al. Reference Alger, McKnight, Spaulding, Tate, Shupe and Welch1997). Orange and red mats are filamentous cyanobacteria from the families Oscillatoriaceae and Leptolyngbyaceae and can form cohesive benthic mats up to 5 mm thick and ≤ 102 m2 in areal extent within the main channel of streams (Vincent et al. Reference Vincent, Downes, Castenholz and Howard-Williams1993, Alger et al. Reference Alger, McKnight, Spaulding, Tate, Shupe and Welch1997, Niyogi et al. Reference Niyogi, Tate, McKnight, Duff, Alger, Lyons, Howard-Williams and Hawes1997). Black mats are dominated by Nostoc and are found primarily along stream margins (Alger et al. Reference Alger, McKnight, Spaulding, Tate, Shupe and Welch1997). Black mats composed primarily of Nostoc are by far the most areally extensive (up to 102 m2 in areal extent) microbial mat type present in the Fryxell basin (Alger et al. Reference Alger, McKnight, Spaulding, Tate, Shupe and Welch1997). Minor components that co-occur with all of the various mat types include diatoms, chrysophytes, microinvertebrates and mosses (Seppelt et al. Reference Seppelt, Green, Schwarz and Frost1992, Adams et al. Reference Adams, Bardgett, Ayres, Wall, Aislabie and Bamforth2006, Esposito et al. Reference Esposito, Horn, McKnight, Cox, Grant and Spaulding2006, Simmons et al. Reference Simmons, Wall, Adams, Ayres, Barrett and Virginia2009). Microbial mats can reach dense coverage within the stream channels as well as along the wetted stream margins known as the hyporheic zone (Alger et al. Reference Alger, McKnight, Spaulding, Tate, Shupe and Welch1997, Kohler et al. Reference Kohler, Stanish, Crisp, Koch, Liptzin, Baeseman and McKnight2015). While locally measured primary productivity is low, high standing microbial biomass is possible in these ephemeral channels largely because of the perennial nature of the mats and because macroinvertebrate grazing losses are essentially non-existent (McKnight & Tate Reference McKnight and Tate1997, McKnight et al. Reference McKnight, Niyogi, Alger, Bomblies, Conovitz and Tate1999).
The diversity of microbial communities found in the Fryxell basin of Taylor Valley. a. Black mat, b. orange mat, c. red mat and d. green mat. A reproduction of fig. A1 from Kohler et al. (Reference Kohler, Stanish, Crisp, Koch, Liptzin, Baeseman and McKnight2015), © Springer Science+Business Media New York 2014.

Microbial mat communities have adapted to the extreme Antarctic environmental conditions, which include low temperatures, highly variable water availability and high exposure to ultraviolet radiation (McKnight et al. Reference McKnight, Niyogi, Alger, Bomblies, Conovitz and Tate1999). These communities are able to survive long periods of desiccation, surviving in a dormant state for many years and then reactivating within 10–20 min of exposure to liquid water (Hawes et al. Reference Hawes, Howard-Williams and Vincent1992, McKnight et al. Reference McKnight, Niyogi, Alger, Bomblies, Conovitz and Tate1999, Reference McKnight, Tate, Andrews, Niyogi, Cozzetto and Welch2007). Studies have shown that these communities also develop mechanisms of coping with the high doses of ultraviolet radiation that are typical in the Antarctic by reducing the concentration of photosynthetic pigments and increasing the concentration of photoprotective pigments at the surface of the mats. The mats simultaneously concentrate photosynthetic pigments at deeper depths where they are protected by the overlying photoprotective pigments (Vincent et al. Reference Vincent, Downes, Castenholz and Howard-Williams1993, Vincent & Quesada Reference Vincent and Quesada2013, Robinson et al. Reference Robinson, Kolber and Sullivan1997, Hannach & Sigleo Reference Hannach and Sigleo1998, Hawes & Howard-Williams Reference Hawes and Howard-Williams1998). Vincent et al. (Reference Vincent, Downes, Castenholz and Howard-Williams1993) reported that the majority of microbial mats that occupy stream channels consist of orange-coloured mats at the surface (enriched in photoprotective accessory pigments) with more photosynthetic chlorophyll a-dominated green-coloured mats located below the mat surface. Because black mats contain such high abundances of photoprotective pigments, they are able to grow sub-aerially without the ultraviolet protection provided by liquid water.
Methods
Remote data and processing
We used eight-band multispectral data from the WorldView-2 and WorldView-3 spacecraft (WV2 and WV3, respectively) owned and operated by DigitalGlobe, Inc. These instruments collect data between 0.42 and 0.92 μm in eight spectral bands (Fig. 3 & Table I) at spatial resolutions between 1.5 and 3.5 m per pixel, depending on viewing geometry. This wavelength range and the band centres on both WV2 and WV3 are ideal for the identification of photosynthetic materials, which exhibit deep and broad absorptions at visible wavelengths (0.4–0.7 μm) due to the presence of pigments including chlorophyll, followed by a dramatic increase in reflectance at near-infrared (NIR) wavelengths known as the ‘red edge’ (> 0.7 μm) (Fig. 3) (Tucker Reference Tucker1979).
Three spectra from the US Geological Survey Spectral Library (Kokaly et al. Reference Kokaly, Clark, Swayze, Livo, Hoefen and Pearson2017) demonstrating the spectral range of the WorldView-2 and WorldView-3 instruments as well as the locations and full widths at half-maximum of each spectral band. The bacterial mat was composed of Chloroflexus aurantiacus and Synechococcus lividus from Yellowstone National Park. Sample IDs are DW92-4 (Russian Olive Tree), GDS91 (Lawn Grass) and YNP-B1 (Bacterial Mat).

Basic information on the WorldView-2 and WorldView-3 instruments.

a Band centres are defined as the weighted median of the corresponding bandpass filter.
b FWHM values are defined using the instrument bandpass filter data in order to determine the spectral width of ≥ 50% transmission for each band.
FWHM = full width at half-maximum, NIR = near-infrared.
Images were acquired by DigitalGlobe, Inc., and obtained from the Polar Geospatial Center (PGC) through a cooperative agreement between the National Science Foundation and the National Geospatial Intelligence Agency. In total, 304 eight-band multispectral WV2 and WV3 scenes were acquired of the Fryxell basin between December 2009 and the end of the 2017–18 summer. Of these 304 scenes, a total of 175 were marked as having < 20% cloud cover, with at least six acquired in each field season since 2009 (Table II). Orbital data were converted from digital number (DN) to top-of-atmosphere spectral radiance (W m-2 μm-1 sr-1) using the following equation from Updike & Comp (Reference Updike and Comp2010):
 $$L_{{\rm \lambda }\comma {\rm Pixel}\comma {\rm Band}} = \lpar {K_{{\rm Band}} \times q_{{\rm Pixel}\comma {\rm Band}}} \rpar /\Delta {\rm \lambda }_{{\rm Band}}$$
where L λ,Pixel,Band is the top-of-atmosphere spectral radiance at each wavelength, pixel and band, K Band is the absolute radiometric calibration factor for each band (W m-1 sr-1 count-1), q Pixel,Band is the radiometrically corrected DN in each band (counts) and ΔλBand is the effective bandwidth for each band (μm). Scenes were then atmospherically corrected to surface radiance (W m-2 μm-1 sr-1) using the Dark Object Subtraction and Regression (DOS-R) method shown to be successful in the Antarctic (Salvatore et al. Reference Salvatore, Mustard, Head, Marchant and Wyatt2014, Salvatore Reference Salvatore2015). Additional information regarding DOS-R can be found in the Supplemental Data file associated with this manuscript.
Number of eight-band WorldView-2 and WorldView-3 visible/near-infrared images classified as having < 20% cloud cover acquired during each summer.

Surface radiance data were converted to surface reflectance (the percentage of solar radiance reflected back to a sensor divided by the total incident solar radiance) using the following equation modified from Updike & Comp (Reference Updike and Comp2010):
 $$\eqalign{{\rm \rho }_{{\rm \lambda }\comma {\rm Pixel}\comma {\rm Band}} &= \lpar {L_{{\rm \lambda }\comma {\rm Pixel}\comma {\rm Band}} \times d_{{\rm ES}}{^2} \times {\rm \pi }} \rpar \cr & \quad /\lpar {Esun_{{\rm \lambda }\comma {\rm Band}} \times sin\lpar {{\rm \theta }_{\rm S}} \rpar } \rpar $$
where ρλ,Pixel,Band is the surface reflectance at a given pixel in a given band, L λ,Pixel,Band is the previously calculated surface radiance, d ES is the distance between the Earth and the Sun on the date of image acquisition (in astronomical units), Esun λ,Band is the mean exoatmospheric solar irradiance calculated for each band (W m-2 μm-1) and θS is the solar elevation angle at the time of image acquisition (degrees). The band-specific mean exoatmospheric solar irradiance values were calculated using the WV2 and WV3 bandpass information and the exoatmospheric solar irradiance standard maintained by the World Meteorological Organization (Fehlmann et al. Reference Fehlmann, Kopp, Schmutz, Winkler, Finsterle and Fox2012).
Remotely identifying and modelling microbial communities
Once each scene was calibrated to surface reflectance, we used the Normalized Difference Vegetation Index (NDVI) to identify the distribution of photosynthetic communities throughout the Fryxell basin (Rouse et al. Reference Rouse, Haas, Schell and Deering1973, Reference Rouse, Haas, Schell and Deering1974, Tucker Reference Tucker1979). The NDVI is a simple spectral parameter that can be rapidly applied to multispectral satellite data calibrated to surface reflectance. It has been shown to be highly sensitive to subtle variations in chlorophyll concentration (Wu et al. Reference Wu, Niu, Tang and Huang2008), although saturation of NDVI has been observed at high chlorophyll contents. This parameter takes advantage of the spectral properties associated with most photosynthetic species, which preferentially absorb solar radiation at visible wavelengths (due to the presence of photosynthetic pigments) and reflect solar radiation at NIR wavelengths. NDVI is defined as:
 $${\rm NDVI} = \left( {\left[ {{\rm NIR}} \right]{\rm } - \left[ {{\rm Red}} \right]} \right)/ \left( {\left[ {{\rm NIR}} \right] + \left[ {{\rm Red}} \right]} \right)$$
where [NIR] and [Red] are the measured surface reflectance values at NIR and red wavelengths, respectively. Values range between -1 and +1, with higher NDVI values consistent with a steeper increase in reflectance between red and NIR wavelengths. This region of increased spectral slope is known as the ‘red edge’ in most photosynthetic materials. Few natural materials have strong absorption features at red wavelengths relative to NIR wavelengths similar to those of photosynthetic pigments (e.g. chlorophyll a), making the NDVI a widely used parameter for the rapid identification of photosynthetic species. We use Band 7 (~0.82 μm) and Band 5 (~0.66 μm) in WV2 and WV3 data to represent the NIR and red bands, respectively, in our calculation of NDVI.
Linear least-squares spectral unmixing was also used to estimate the relative abundances of soil and microbial mat materials throughout the Fryxell basin. This technique linearly combines endmember spectra provided by the user in an input library to best match the derived spectrum at each pixel within an image or spectral dataset (Ramsey & Christensen Reference Ramsey and Christensen1998). While it is possible to have up to nine endmember spectra in our unmixing library (one plus the total number of spectral bands), for simplicity we only used five endmember spectra (Fig. 4): one of average Taylor Valley soil (from Levy et al. Reference Levy, Nolin, Fountain and Head2014), one of a scene-derived geological surface to account for spectral characteristics or artefacts potentially related to the atmospheric correction (derived from the northern wall of Taylor Valley near 77.598°S, 163.052°E), one of healthy black microbial mat material (provided by Joseph Levy, Colgate University), a ‘dark’ endmember consisting of 0% reflectance at all wavelengths and a ‘bright’ endmember consisting of 100% reflectance at all wavelengths. The dark and bright endmembers are meant to account for illumination and topographical differences in the scene without contributing unique spectral features or influencing the relative abundances of the various geological and biological endmembers. While water was not included as an endmember, it acts to attenuate the spectral signature of its underlying substrate to such a degree that it is possible to identify when water is having a significant influence on our model through an increased root mean square (RMS) error. The RMS error is a mathematical measure of the goodness of fit of the model to the input spectrum of interest; it is not a measure of the accuracy of the derived endmember assemblage relative to the actual surface composition. More information regarding the linear unmixing technique used in this manuscript, the generation of the spectral endmember library and the interpretation of RMS errors can be found in the Supplemental Data.
The five endmember spectra used in our linear unmixing model. Spectra are offset for clarity. Field data were provided by J. Levy, Colgate University, and can be seen behind the down-sampled spectra.

Results
Our study shows that both spectral parameters and linear unmixing models are able to provide valuable insights into the spatial distribution and temporal variability of microbial mat communities within the Fryxell basin. We will first discuss our ability to identify the distribution of photosynthetic signatures, including how variations in the strength of these observed signatures may be related to the abundance of these photosynthetic communities and/or other key biological properties. We will then demonstrate observed intra- and inter-annual temporal variability in these signatures that we attribute to changes in community and photosynthetic activity.
Description of endmembers and spectral signatures observed from orbit
The spectral endmembers used in our unmixing algorithm provide critical insights into the spectral signatures observed from orbit (Fig. 5). Both the field-derived soil and scene-derived surface spectra exhibit a concave-down increase in reflectance until 0.82 μm, followed by a downturn at the longest wavelengths (e.g. Fig. 4). After down-sampling these data to orbital spectral resolutions, the field-derived soil spectrum exhibits an NDVI value of +0.02, while the scene-derived surface spectrum exhibits an NDVI value of +0.18. This difference is due to the steeper increase in reflectance of the scene-derived spectrum out to 0.82 μm relative to the field-derived soil spectrum. While the ‘flattening’ of the field-derived spectrum results in a lower NDVI value, the scene-derived surface spectrum does not contain any indication of photosynthetic signatures, indicating that this increase in NDVI value is probably related to non-biological spectral properties. Similarly, surfaces dominated by soils, sediments and bedrock in the orbital scene exhibit spectral shapes with either linear or concave-down increases in reflectance, with peak reflectance values at either 0.72 or 0.82 μm and decreasing at the longest wavelengths. The exact location of this reflectance maximum is related to the presence of broad ~1 μm Fe2+ and Fe3+ crystal field absorptions present in both primary and secondary Fe-bearing minerals, respectively. While different lithologies will result in minor variations in this spectral shape (e.g. minor kinks or shifts in local minima/maxima), this general spectral shape is consistent throughout the Fryxell basin. This consistency gives us confidence in our detection of photosynthetic communities within stream channels in the Fryxell basin, as their spectral signatures deviate significantly from the barren geological landscapes found throughout the basin. Our library spectra provide key insights into the nature of these unique spectral features. The healthy black microbial mat reference spectrum exhibits low reflectance values until 0.60 μm, followed by a narrow absorption feature at 0.66 μm and then a rapid increase in reflectance through 0.91 μm. This spectral behaviour is consistent with the presence of dark photosynthetic and sunscreen pigments and the accompanying red edge moving into the NIR wavelength range. After down-sampling, this field-derived microbial mat spectrum exhibits an NDVI value of +0.62, significantly higher than the geological endmembers and observed geological landscapes throughout the basin.
Spectral signatures derived from orbital and field analyses. Field spectra were down-sampled to orbital bandpasses and then linearly combined to produce the 50%-50% mixture spectrum shown in pink. This spectrum was compared to an orbital spectrum from the Canada flush (blue spectrum). A ratioed orbital spectrum is also shown (in green) in order to highlight the spectral similarity between orbital and field measurements.

In comparison with one of the most densely vegetated regions of the Fryxell basin, a flat wetland portion of the Canada Stream system known as the ‘flush’, the spectral influence of photosynthetic microbial mats is clear to see. Spectral signatures derived from the Canada flush show a nearly linear increase in reflectance from shorter to longer wavelengths, with a local minimum near 0.66 μm (Fig. 5). This signature is dissimilar to those of any known geological endmembers found in or around the Fryxell basin. Instead, this signature is only consistent with a spectral mixture of local soils and black mats, confirming that the signatures we are seeing are indeed due to the presence of microbial mat communities. A combination of 50% barren soil and 50% black mat closely matches the spectral signature derived from the Canada flush, including the near-linear increase in reflectance and the local reflectance minimum near 0.66 μm (Fig. 5). In addition, a simple ratio between the spectrum acquired from the flush and nearby low-NDVI regions outside of the stream channel provides additional confirmation that the observed spectral signatures are due to photosynthetic microbial mat communities. As can be seen in Fig. 5, the result of this spectral ratio is consistent with the black mat spectral endmember, confirming the presence of this spectral contributor in the flush of Canada Stream, supporting earlier studies and validating the capability of these multispectral orbital data to identify the spectral signatures of photosynthetic microbial communities.
Both open-water and highly vegetated regions of the Fryxell basin appear dark at visible wavelengths, making it difficult for the naked eye to identify significant abundances of photosynthetic materials within active stream channels. Fortunately, the NIR spectral response of open water, saturated or inundated soils and microbial materials are significantly different from one another and are unmistakable. For example, Fig. 6 shows spectra from three locations within the Fryxell basin that exhibit approximately the same visible signatures yet significantly different NIR signatures reflective of their different spectral origins. The grey spectrum is from the margins of Crescent Stream, which shows a steady increase in reflectance into the NIR range that is consistent with a mixture of microbial mats and soils (see Fig. 5). The brown spectrum is from the upper stretches of Aiken Creek, which exhibits a low NDVI value and has a spectral shape that is consistent with dark soil, suggesting that this spectrum is representative of saturated or shallowly inundated soils. The blue spectrum is from a deep pond near Many Glaciers Pond in the eastern Fryxell basin and shows a characteristic deep-water spectrum, which peaks in reflectance in or near visible wavelengths and exhibits steadily decreasing reflectance through the NIR range due to the highly absorbent NIR properties of water. Photosynthetic communities and their strong red edge and high NIR reflectance are the only naturally occurring materials in the Fryxell basin that result in an increasing reflectance through all WV2 and WV3 NIR wavelengths. These three spectra, despite their similar appearances at visible wavelengths, demonstrate how photosynthetic communities, wet or inundated soil and open water can be easily distinguished using the multispectral capabilities of these orbital assets.
The spectral influence of inundation and standing water in the Fryxell basin. Shown are the saturated stream margin of Crescent Stream (grey) showing an increase in reflectance at longer wavelengths due to photosynthesis and the photosynthetic red edge, a saturated or inundated soil from Aiken Creek (brown) showing little obvious spectral influence from liquid water and open water from near Many Glaciers Pond (blue) showing the characteristic decreasing of reflectance at longer wavelengths due to the strong absorption of liquid water in the near-infrared range. Data from WorldView-2 image 103001003ED2B400.

Distribution and strength of photosynthetic signatures
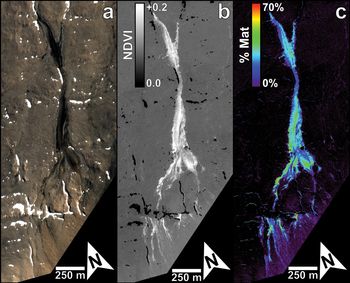
With confidence that microbial mats are contributing significantly to the spectral signatures of the Fryxell basin derived from orbit, we can use parameters like the NDVI on WV2 and WV3 data to provide a useful means of estimating the distribution of photosynthetic communities throughout the basin (e.g. Fig. 7). The mean NDVI for geological surfaces throughout the Fryxell basin (derived from the calibrated WV2 image 103001003ED2B400) is +0.079 with a standard deviation of 0.010, which is consistent with a mixture of our field- and scene-derived geological endmembers discussed above. The percentage of pixels in the Fryxell basin that correspond to NDVI values > 2 standard deviations above this mean value is 2.56%, which is equivalent to a total of 0.82 km2. This result suggests that, when viewed from orbit, a significant portion of the Fryxell basin exhibits spectral contributions consistent with the presence of photosynthetic materials. However, our scene-derived geological endmember had a measured NDVI value of +0.18, which is > 10 standard deviations above this mean NDVI value calculated for geological surfaces throughout the Fryxell basin. Considering this observed complication of NDVI in predicting the surface coverage of photosynthetic materials, it appears that simple spectral ratios such as NDVI are not ideal means of determining the distribution and abundance of photosynthetic microbial mat communities throughout the Fryxell basin. Instead, characterizing the unique spectral shape of microbial mats and their contributions to the spectrum of each pixel is likely to be the most effective means of estimating the distribution and abundance of these communities, which is why we turn to linear unmixing models.
Crescent Stream in the Fryxell basin, as imaged by the WorldView-2 instrument on 22 January 2015 (image 103001003ED2B400). a. A true-colour visible image. b. A Normalized Difference Vegetation Index (NDVI) map, highlighting the distribution of photosynthetic signatures. c. Results from a linear unmixing algorithm, identifying mat abundances up to ~70% in some locations within Crescent Stream. Imagery © 2015 DigitalGlobe, Inc.

Modelled abundances of photosynthetic communities
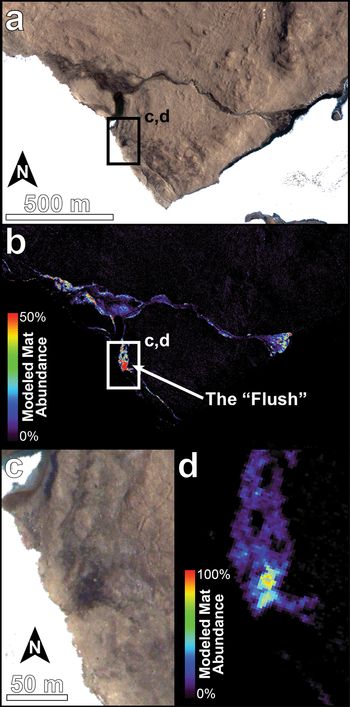
The results of our linear unmixing model in the Crescent Stream and Canada Stream regions of the Fryxell basin are shown in Figs 7c and 8, respectively, and they provide strong evidence for significant spectral contributions from photosynthetic microbial mat communities. The modelled abundance of microbial mat communities in Crescent Stream approaches 70% ground cover in some locations, with the majority of the channel exhibiting mat abundances between 30% and 40%. The highest percentages of mat cover were found in the flush of Canada Stream, which modelled mat abundances up to 86%. Overall, the unmixing model is able to adequately characterize the spectral shape of surfaces within the Fryxell basin. The mean RMS error for the Fryxell basin (not including areas of open water, snow or ice, which were removed using the methods described in Salvatore et al. (Reference Salvatore, Mustard, Head, Marchant and Wyatt2014) and Salvatore (Reference Salvatore2015), and are provided in the Supplemental Material) is 0.21%. These surfaces were removed because they were not included in the endmember library, resulting in very high RMS errors that are not representative of true model performance. Some stream channels (e.g. Von Guerard Stream) exhibit concentrated regions with RMS errors reaching 0.4%, which is nearly double the mean RMS error values found across most surfaces throughout the basin. These high RMS errors may indicate a contribution from remnant open water or potentially different microbial mat communities (e.g. orange mats) that were not well modelled using the single black mat spectrum input into the unmixing model.
Map of modelled microbial mat abundance within the Canada Stream Antarctic Specially Protected Area (ASPA 131). a. Visible image of Canada Stream north of Lake Fryxell and east of Canada Glacier. b. Microbial mat abundance modelled using WorldView-2 imagery. c. A high-resolution visible image of the ‘flush’ of Canada Stream. d. A high-resolution view of the modelled mat abundance in the ‘flush’. Imagery © 2015 DigitalGlobe, Inc.

The results from this unmixing model also allow us to compare the spectral signatures and the modelled results from each pixel in the scene (Fig. 9). For example, a pixel from the barren area on the northern shore of Lake Fryxell is modelled at 99.86% soil (a combination of the scene- and field-derived endmember spectra) and 0.14% black mat, with an RMS error of 0.14%. Visualization of this model result overlain on the actual spectral signature shows an extremely good fit, suggesting that the model (and the predicted small, if any, contribution from black mats) satisfies the observed surface spectrum. Alternatively, a pixel from the Canada flush is modelled at 61.39% black mat and 38.61% combined scene- and field-derived soils, with an RMS error nearly double that of the barren area. While the modelled fit still appears to be good, the higher RMS error is a result of the slightly poorer fit near 0.55 and 0.66 μm. This higher RMS error indicates that the spectral endmembers used to unmix this pixel were insufficient to satisfy the actual observed spectrum, which may potentially have contributions from standing water or other microbial mat communities. Future work to refine the endmember library and image calibration techniques will help to minimize RMS errors.
Spectral signatures derived from two pixels in WorldView-2 image 103001003ED2B400 (black) and the modelled results (green) from the linear unmixing model. The derived abundances of the various endmembers (excluding the ‘dark’ and ‘bright’ endmembers) and the root mean square (RMS) errors are also reported.

Observed interannual variability of microbial mat signatures
While the NDVI was shown not to be the best means of quantifying microbial mat abundances throughout the Fryxell basin, it is still a valuable tool for identifying relative changes across a landscape, as geological surfaces (regardless of their inherent contribution to the derived NDVI) should not change over time. Microbial mat communities and their photosynthetic character, however, have been known to significantly change over time as a result of desiccation or scouring (e.g. McKnight et al. Reference McKnight, Niyogi, Alger, Bomblies, Conovitz and Tate1999). The NDVI is also less sensitive to imperfect atmospheric correction than linear unmixing models that have yet to be validated in the field, as the NDVI is a simple spectral ratio and does not try to match unique spectral shapes that require comparability to field-derived spectra. Therefore, we chose to utilize NDVI parameter maps in our identification of temporal variability in microbial mat signatures.
The nearly decade-long record of high-resolution multispectral data over the Fryxell basin allows us to investigate interannual variations in the spatial distribution of observed microbial mat communities in addition to variability in the strength of these observed spectral signatures. In order to demonstrate these capabilities, we highlight three images acquired on 6 January 2013, 18 January 2015 and 20 January 2018. Each was first calibrated to surface reflectance before NDVI parameters were calculated for each image. In order to minimize any potential differences in NDVI resulting from differing atmospheric conditions (and their incomplete removal using the DOS-R technique), the NDVI data were normalized to each other using invariant geological surfaces common to all three images. This normalization ensures the ability to compare observed signatures and patterns between images.
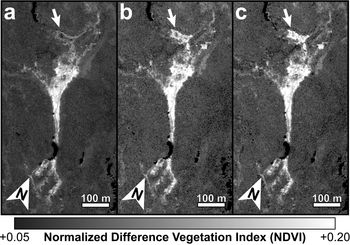
A subset of these three images is shown in Fig. 10, which highlights variations observed within the Crescent Stream system. Flow from Crescent Stream ponds and pools in shallow depressions in this portion of the channel and the high NDVI signatures and results from our linear unmixing models indicate that this portion of the Crescent Stream system hosts abundant microbial mat communities. Significant spectral variability is observed both within the standing ponds and in the channels that feed and drain these ponds, as indicated with white and black arrows, respectively, in Fig. 10. Given the geological and biological stability of these landscapes, the observed interannual variability is most probably due to changes in water availability and flow as determined by annual climatic variations and short-term meteorology (Doran et al. Reference Doran, McKay, Clow, Dana, Fountain, Nylen and Lyons2002). Microbial mat communities rapidly respond to rehydration (McKnight et al. Reference McKnight, Tate, Andrews, Niyogi, Cozzetto and Welch2007), resulting in photosynthetic activity and increasing NDVI values. Unfortunately, stream gauge data published through the MCM LTER are only available for when the first image was acquired (0.77 cubic feet per second), while the gauge was not operating correctly when the second image was acquired. Data from 2018 are not yet published.
Three orbital images of a section of Crescent Stream acquired in a. 2013, b. 2015, and c. 2018. Areas of significant change between these years are highlighted by both black and white arrows, showing significant interannual variability in the hydrological and/or microbial properties of this stream. a. WorldView-2 image 103001001D642400, b. WorldView-3 image 1040010006B14C00 and c. WorldView-2 image 1030010077755100. Imagery © 2013, 2015, 2018 DigitalGlobe, Inc.

Observed intra-seasonal variability of microbial mat signatures
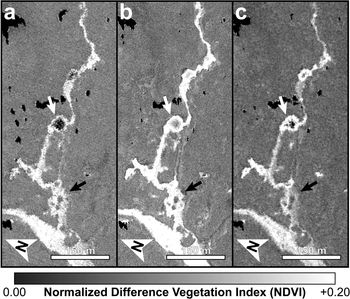
While Fig. 10 shows how the spectral signatures associated with photosynthetic microbial communities can vary over several years, we can also observe and characterize variations seen over much shorter timescales. For example, Fig. 11 shows significant spectral changes that occurred in the Relict Channel of Harnish Creek over 7 days in January 2015. The white arrows in Fig. 11 highlight a flat and shallow depression that fills with water only during peak seasonal flow. A desiccated microbial mat is known to be present within this depression throughout the year, yet it only activates and photosynthesizes when water is available. There are no obvious spectral variations in the main channel and channel margins during this 7 day period, indicating that the hydrological activity in the main channel and hyporheic zone is sufficient to maintain near-constant levels of photosynthetic and biological activity. The shallow depression to the north of this channel (Fig. 11, white arrows), however, is observed to significantly increase in NDVI over this 7 day period. This observation highlights the relationship between biological activity in these microbial mat communities and the availability of water, and it also demonstrates the sensitivity of remote-sensing data for capturing these rapid changes in biological processes in response to hydrological changes.
Three orbital images of a section of the Relict Channel of Harnish Stream acquired on a. 18 January 2015, b. 22 January 2015 and c. 24 January 2015. Over the 7 days in which these images were acquired, an obvious increase in NDVI can be seen in a broad and flat offshoot of the channel (white arrows), indicating a significant change in biota and/or hydrology over the course of a single week. a. WorldView-3 image 1040010006B14C00, b. WorldView-2 image 103001003ED2B400 and c. WorldView-2 image 103001003CD3ED00. Imagery © 2015 DigitalGlobe, Inc.

Discussion
Broader implications and applications of ecological remote sensing in the MDV
This remote-sensing study is among the first efforts in the MDV to link patch-scale ecological processes to landscape-scale microbial dynamics and responses to environmental and hydrological variability. Once validated in the field, these methods can be used to examine the fundamental controls over the distribution and activity of the dominant organisms of the MDV and their response and resilience to environmental change. By extrapolating the local observations pioneered and carried out annually by the MCM LTER Project to broader spatial and temporal scales, this work can lead to a more thorough and complete understanding of the ecological systems in the MDV in the past, at present and into the future.
Once quantitative relationships between remote spectral signatures and key biological and ecological properties are established, calibrated and validated, additional field efforts will not be required to extrapolate these relationships to all archived and future multispectral data. This will help to limit the environmental impact of ecological research in the MDV, as the surveying and sampling of these microbial communities is destructive and these systems are exceptionally slow to recover (e.g. Hawes et al. Reference Hawes, Howard-Williams and Vincent1992). Human disturbances can also have long-lasting effects on both the geology (Campbell et al. Reference Campbell, Claridge and Balks1998) and the microbial soil communities (Bollard-Breen et al. Reference Bollard-Breen, Brooks, Jones, Robertson, Betschart and Kung2014) in areas not dominated by microbial mats, highlighting the fragility of this landscape. The logistical efforts and operational costs to the National Science Foundation, the US Antarctic Program, all contractors working with these organizations and all participating nations of the Antarctic Treaty can all be reduced through increased use of satellite imagery for such ecological studies. For these reasons and in these capacities, our work highlights a promising avenue for future ecological studies in the MDV and beyond.
Factors influencing observations of photosynthetic materials
The remote detection and characterization of photosynthetic communities in Antarctica can be complicated by several factors that warrant additional discussion and require more research. Before spectral analysis or cross-comparison with other orbital data, the data must be calibrated to surface reflectance, which is an inherent property of a surface that is invariant regardless of illumination, observation geometry or atmospheric properties. Calibrating to surface reflectance requires the identification and removal of atmospheric properties within each image, including the effects of atmospheric scattering. We performed the DOS-R atmospheric correction on each image analysed in this study, which derives an atmospheric scattering spectrum for each image using scene-derived spectral signatures. These corrections, however, have not been validated using ground-control spectra or synoptic atmospheric measurements, and so the relative and absolute performance of these atmospheric corrections are not fully quantified. While an imperfect atmospheric correction may alter the derived surface reflectance and the absolute values of derived spectral parameters, it would not influence the relative spectral differences between regions within a single image. It could, however, preclude the ability to compare spectral signatures between images if they are not normalized to invariant surfaces, which would limit the ability to monitor the distribution and activity of photosynthetic communities over space and time. Work to acquire calibration data in the field is ongoing and will minimize errors resulting from the DOS-R atmospheric correction procedure by measuring absolute surface reflectance of invariant geological surfaces, which can then be used to derive atmospheric spectral information and remove those contributions from the scene.
Other sources of uncertainty in orbital signatures are biological in nature, resulting from our assumption that the hyperspectral signature of black microbial mats utilized in this investigation is representative of all photosynthetic communities observed throughout the Fryxell basin. This assumption does not account for variations in spectral signatures associated with other microbial communities (e.g. orange and green mats) or communities with greater bryophyte (i.e. moss) abundance, whose spectral signatures may differ significantly and may influence our ability to identify and estimate their abundances. In addition, it is unclear how the desiccation of microbial mat and bryophyte communities influences their spectral signatures. Assuming that the NDVI values of these communities decrease as a result of desiccation and inactivity, mapping of microbial mat distribution and activity as well as estimations of biomass derived from such remote-sensing efforts would undoubtedly result in a considerable underestimate.
Lastly, the influence of inundation by standing and flowing water on the observed spectral signatures is unconstrained. Although the spectral influence of deep water can be easily recognized, relatively shallow water, which is prevalent in seasonal landscape features of the MDV, acts as a partially transparent spectral contributor to the observed signatures. Stream systems throughout the Fryxell basin typically lack long stretches of standing or flowing water greater than a few centimetres in depth for sustained periods of time due to high soil porosity, relatively low stream discharges and steep gradients. However, even shallow water can have large influences on the observed spectral signature of materials due to the scattering and attenuation of sunlight (Fig. 6). This attenuation is greater at longer wavelengths (e.g. NIR light) than at shorter wavelengths (e.g. visible light), which is why water depth has a significant influence on parameters such as the NDVI, where longer and shorter wavelength ranges are compared relative to one another. As a result, the spectral signatures and NDVI values observed throughout the Fryxell basin may be significant underestimates of mat distribution and activity.
The influence of water depth on derived NDVI signatures can be tested by observing the many small ponds associated with Delta and Crescent streams to the south of Lake Fryxell (Aiken et al. Reference Aiken, McKnight, Harnish and Wershaw1996). These ponds typically exhibit moderate microbial mat coverages (typically greater than the stream systems themselves) and are only a few tens of centimetres in depth, serving as standing pools of water that accumulate during high flow and drain during low flow (Aiken et al. Reference Aiken, McKnight, Harnish and Wershaw1996). The interiors of these ponds routinely exhibit lower NDVI values than the pond margins that, if microbial mat coverage is homogeneous throughout the ponds, would demonstrate the influence of water depth on the NDVI and other derived spectral parameters. For example, one pond in Crescent Stream (located at 77.634°S, 163.227°E and seen in the centre of Fig. 10) has a calculated mean NDVI value of +0.137 ± 0.035 near the centre of the pond, while its margin has a mean NDVI value of +0.213 ± 0.040. Assuming that the microbial mat coverage in this pond is relatively homogeneous across its entire bottom (which has been previously described; e.g. Reddy et al. Reference Reddy, Aggarwal, Matsumoto and Shivaji2000), this observed reduction in NDVI probably represents the influence of water depth on the observed spectral signature, as NIR reflectance is more attenuated than visible reflectance. Additional work is necessary in order to confirm and quantify the relationships between water depth, spectral signatures and microbial mat cover in these ponds.
Ongoing and future work
In order to extend this work beyond the unvalidated orbital and spectral analyses performed here, it is necessary to validate the methods of image calibration and spectral parameterization, as well as to collect additional spectral endmembers and field data. This is particularly true for both areas of high and low biological productivity in order to understand the upper and lower limits of such spectral investigations. These activities are currently ongoing. Specifically, efforts to identify and measure spectrally homogeneous and invariant plots to serve as calibration grids are being measured in the Fryxell basin, along with vegetated stream channels that do show intra- and inter-seasonal variations. Geological and biological spectral endmembers are also being identified and recorded for use in future unmixing models.
Once spectral signatures are quantitatively linked to key biological properties, including percentage mat coverage, ash-free dry mass and the composition and concentration of pigments, it will be possible to test the efficacy of linear and non-linear unmixing models such as those used in this study. It will also be possible to quantitatively associate these spectral unmixing results with estimates of areally integrated biomass. These capabilities will be a critical step towards estimates of net primary productivity (NPP) of the MDV and understanding how NPP changes over time in response to climatic and hydrological variability. In this regard, our initial efforts here demonstrate how remote sensing may be an invaluable tool in the characterization of MDV ecosystems, particularly in the context of ongoing and future climate change.
Conclusions
In this study, we demonstrated how the unique spectral signatures of microbial mat communities can be observed, mapped and characterized using high-resolution multispectral satellite data. Simple spectral parameters such as the NDVI are shown to be effective at identifying the distribution of microbial mat signatures across a polar desert landscape, but more complex spectral unmixing is required in order to fully characterize the influence of these mat communities on the shapes of the observed spectral signatures, which can also be used to estimate the spectral contributions and abundances of mat communities across this landscape. Additional validation of these techniques and collection of spectral endmembers in the field is required to validate these spectral techniques. Once validated through additional and synergistic fieldwork, orbital imaging and laboratory analyses, more informative ecological parameters, including estimates of total biomass and NPP, could be estimated remotely using the techniques and relationships described above.
Importantly, these techniques can be used to complement ongoing efforts by the MCM LTER Project to understand the connections between the geological, hydrological, environmental and biological systems over time in the MDV. The remote detection and characterization of these landscapes can minimize the human footprint on this fragile environment to help preserve it for future generations. Once validated, these data could also be used to identify and characterize these communities remotely, safely and requiring minimal logistics or costly resources, which would help researchers and governmental organizations alike.
Acknowledgements
The authors would like to thank the McMurdo Dry Valleys Long-Term Ecological Research Program for their support and assistance as well as the use of freely available data via their website (www.mcmlter.org). The authors would also like to thank Mike Cloutier and the Polar Geospatial Center for geospatial and satellite image support, DigitalGlobe, Inc., and the National Science Foundation for access to these orbital data, in addition to two anonymous reviewers for their helpful comments that significantly improved this manuscript.
Author contributions
MRS calibrated, processed and interpreted all remote-sensing data and wrote the bulk of the manuscript. SRB assisted with data comparison and manuscript editing. JEB, ERS, LFS and SNP consulted on the ecological and biogeochemical interpretation of these data and products. PM is the Principal Investigator of the Polar Geospatial Center and assisted with image acquisition and processing.
Financial support
This work was funded by US National Science Foundation OPP awards 1758224 (Antarctic Earth Science) and 1745053 (Antarctic Organisms & Ecosystems) to M. Salvatore.
Details of data deposit
All orbital data used in this investigation are archived at the Polar Geospatial Center at the University of Minnesota through a cooperative agreement between the US National Science Foundation and the National Geospatial Intelligence Agency and are available upon request to all federally funded investigators. Spectral data are available both through the US Geological Survey Spectral Library (Kokaly et al. Reference Kokaly, Clark, Swayze, Livo, Hoefen and Pearson2017) and the Supplemental Data associated with this manuscript.
Supplemental material
A description of the methods used and two supplemental figures will be found at https://doi.org/10.1017/S0954102020000176.