Nomenclature
- AR
-
aspect ratio
- A p
-
total projection area of lifting members, mm 2
- A w
-
total wetted area of members (per unit chord), mm
- b, c
-
span and chord of the grid fin members, mm
- C L , C D , C m
-
coefficient of lift, drag and pitching moment
- C L /C D
-
aerodynamic efficiency
- (C L /C D ) max
-
maximum aerodynamic efficiency
- C N
-
normal force coefficient
- C A
-
axial force coefficient
- C Lα
-
lift versus angle-of-attack slope, deg –1
- C mα
-
pitching moment versus angle-of-attack slope, deg –1
- C Lmax
-
maximum lift coefficient
- C Do
-
drag coefficient at zero deg. angle-of-attack
- C p
-
pressure coefficient
- CFD
-
computational fluid dynamics
- D
-
diameter of missile body, m
- g
-
gap between the grid fin members, mm
- g avg
-
average gap between the grid fin members, mm
- h
-
height of grid fin, mm
- l m
-
total length of blunt leading edge of members, mm
- Ma
-
free stream Mach number
- Re
-
Reynolds number
- s
-
cell size, mm
- t
-
web thickness, mm
- U ∞
-
freestream velocity, m/s
- UAV
-
unmanned aerial vehicles
Greek symbol
- α
-
angle-of-attack, deg.
- αstall
-
stalling angle-of-attack, deg.
- α (CL/CD)max
-
α at which maximum value of (CL/CD), deg.
- ρ
-
density of air, kg/m 3
- δ
-
inclination angle, deg.
1.0 Introduction
Missiles, rockets and UAVs are highly advanced guided weapon systems engineered to deliver payloads or warheads precisely to their pre-determined targets. These systems comprise four main subsystems that are the propulsion system, warhead or payload, control surfaces and guidance system. The guidance system plays a crucial role by providing commands to the control system, which subsequently induces requisite forces through the deflection of aerodynamic control surfaces. This allows the air vehicle to manoeuver according to mission requirements. Aerodynamic characteristics of an air vehicle’s control surfaces significantly impact its overall aerodynamic performance and control effectiveness. In guided flight vehicles, such as missiles and rockets, the assessment of aerodynamic performance predominantly revolves around aerodynamic efficiency and controllability at high angles of attack. However, achieving optimal controllability often involves trade-offs that can reduce aerodynamic efficiency and the overall performance. These trade-offs may result in higher thrust requirements and reduced payload capacity, posing operational constraints. Additionally, the control actuator system, responsible for maintaining the control surfaces at the required deflection, adds considerable weight to the air vehicle. Therefore, selecting and designing control surfaces requires careful consideration of factors such as aerodynamic efficiency, hinge moment, stall characteristics, weight actuator requirements and controllability. By addressing these factors, the performance of control surfaces can be optimised for maximum effectiveness. Among the various types of control surfaces being used world-wide, grid fins stand out as a compelling option due to their distinct advantages.
Grid fins have a compact structure with smaller intersecting lifting members arranged within an outer frame (Fig. 1b). Control surfaces (grid fins) are mostly situated at the aft end of missile bodies and other airborne vehicles and aligned perpendicular to the airflow (Fig. 1a), facilitating smooth passage of air through their structure. As airflow traverses through the grid fins, aerodynamic forces are produced, generating moments that modify the vehicle’s orientation and spatial alignment.
Schematic of grid fin configuration: (a) with missile body; (b) isolated.

Grid fins have been adopted in aerospace vehicles [1] for over five decades due to their unique characteristics and advantages. Notable examples include their usage on the air-to-air missile [2] Vympel R-77 and the American-borne guided bomb [3] Massive Ordnance Air Blast. In recent years, grid fins have been used to enhance precision landing, as demonstrated by their application on the SpaceX’s Falcon-9 reusable launch vehicle [4] in November 2014 and the North Korean test flight of the Musudan cruise missile [Reference Savelsberg and Kiessling5] in 2016. The Long March-8 [Reference Jones6] (LM 8) reusable launch vehicle in China also utilised grid fins for its first-stage landing in 2020. Grid fins demonstrate superior overall performance at higher speeds (especially at supersonic) and higher α, surpassing planar fins [Reference Munawar7]. By leveraging these distinct attributes and considering them within a wider context of missile and rocket design, engineers and researchers can achieve further advancements in aerodynamic performance, manoeuverability and stability, pushing the boundaries of what is achievable in diverse operating conditions and flight regimes. Their small chord length enables incidence angle alteration with minimal hinge moment requirements [Reference Washington and Miller8], leading to a reduction in the size and weight of both the control actuator, and hence the missile itself. One defining attribute of grid fins is their exceptional packaging capability, allowing for efficient stowage. The internal structure of grid fins consists of smaller grid cells, whose precise shape significantly influences the grid fin’s structural strength and aerodynamic characteristics. The cells within the intricate structure of grid fins present a significant challenge because they cause airflow getting choked at transonic speeds. This phenomenon leads to flow blockage, and hence increased drag leading to reduced aerodynamic efficiency and degraded control effectiveness [Reference Cai9]. Previous investigations have presented increased influence of arrangement, size and shape of the grid fin cells on the overall aerodynamic performance of grid fins [Reference Tripathi, Mahesh and Misra10–Reference Misra15]. At transonic speeds, choking is the most common phenomena and is characterised by the formation of a detached normal shockwave upstream of the grid fins [Reference Cai9, Reference Dan and Yong16, Reference Miller and Washington17]. As speed increases, this shockwave transitions into a weaker oblique shock, resulting in decreased drag, enhanced aerodynamic efficiency and control effectiveness [Reference Cai9, Reference Debiasi, Yan and Chng18]. Extensive studies, both experimental and CFD, have been conducted to address the issue of drag reduction upwards of transonic speeds. These investigations aimed at optimising grid fin designs enabled enhancement of their performance by reducing drag and improving aerodynamic efficiency and controllability. Diverse configurations, such as swept back (SB), swept forward (SF), sharp leading-edge, sharp leading-edge with SB and SF, and locally swept (peak-type and valley-type) configurations, have been meticulously examined in these efforts [Reference Cai9, Reference Dan and Yong16, Reference Miller and Washington17, Reference Washington, Booth and Miller19–Reference Debiasi22].
Numerous experimental and CFD studies have been carried out to investigate how the geometric critical parameters of grid fins (or its cell) affect their aerodynamic, stability and control characteristics. The studies have shown that these geometric parameters play a crucial role in determining the aerodynamic characteristics and overall performance of grid fins [Reference Tripathi, Mahesh and Misra10, Reference Tripathi, Sucheendran and Misra11, Reference Ghosh, Misra and Ghosh23]. Extensive investigations have thoroughly explored the impact of the grid’s external frame shape and the shape of its internal grid cells on the overall performance of the grid fins [Reference Theerthamalai12–Reference Dinh, Dinh and Pham14, Reference Mohankumar, Premkumar, Ravichandran, Aravindkumar and Raagavendhar24]. However, fewer studies have specifically examined the effect of geometrical parameters on grid fin aerodynamics in subsonic flow. Key geometrical parameters that influence grid fin (specially cascade fin [Reference Ghosh, Misra and Ghosh23]) aerodynamic characteristics in subsonic flow include the number of lifting members, cell spacing, chord, span, thickness of lifting member, cross-section of lifting members, aspect ratio of members and pattern of grid cell [Reference Tripathi, Mahesh and Misra10, Reference Tripathi, Sucheendran and Misra11, Reference Ghosh, Misra and Ghosh23, Reference Tripathi, Sucheendran and Misra25–Reference Bisht, Yadav and Joshi30]. Analysing these parameters independently will be crucial for effective grid fin design optimisation. By understanding the impact in flow field associated with each parameter and pattern of grid cells, designers can optimise grid fin geometry for maximum lift, optimal aerodynamic efficiency and better control effectiveness. Experimental investigations have been carried out in the past to comprehend the effect of different grid patterns (cell’s shape) on the aerodynamic characteristics of grid fins integrated with missile body [Reference Hiroshima and Tatsumi13],which focused on the aerodynamic characterisation related to grid fin-missile body configurations across different flow regimes (especially at transonic and supersonic) for limited angle-of-attack. In an another experimental study, the aerodynamic characteristics of various isolated grid fins configurations were compared, which were designed by using different gaps between the lifting members in diamond and triangular cell patterns under lower subsonic conditions [Reference Tripathi, Sucheendran and Misra11].
This research presents a comprehensive numerical investigation into the intricate subsonic aerodynamic characteristics of four distinct isolated grid fin configurations: square, diamond, triangular and hexagonal pattern. Viscous CFD simulations were conducted across a wide range of angles of attack (0o to 45o) and subsonic Mach numbers (0.1, 0.3, and 0.5). The detailed analysis focuses on high angle-of-attack performance, emphasising the unique aerodynamic behaviour and efficiency of each configuration. The depth and scope of this study highlight the novelty and significance of its contributions to understanding the aerodynamic performance of grid fins with different internal complex patterns. This comprehensive analysis facilitates a detailed comparative evaluation of grid fin variants, highlighting their strengths and limitations. By critically examining factors such as lift generation, drag reduction, pitching moment, aerodynamic efficiency and flow-field variations across various operational conditions, engineers can develop optimised grid fin designs tailored to specific mission requirements. The study reveals that the diamond cell pattern is the most aerodynamically efficient configuration, delivering heightened lift generation but with a higher drag penalty. The square pattern achieves the lowest drag and hinge moment, making it ideal for applications requiring optimal weight reduction. The hexagonal grid fin excels in stall delay and post-stall performance, offering enhanced stability and manoeuverability, albeit at the cost of increased pitching moments. The triangular pattern demonstrates balanced aerodynamic performance, with moderate lift, drag and pitching moments, and high efficiency at lower speeds, making it suitable for specific applications.
This numerical study could serve as a design recommendation tool for advancing grid fin control surfaces, to optimise their overall aerodynamic performance in subsonic regime and contribute to the development of more efficient, precise manoeuverability, inherent stability and reliable aerial vehicles for various applications within the corporate sector and defense industries. Future studies could explore the design of a hybrid grid fin configuration, combining best aspects of each pattern to enhance overall aerodynamic efficiency and performance.
2.0 Numerical Approach
2.1 Grid fin configurations
The grid fin configurations analysed in this study, excluding those integrated with the missile body, were developed by making slight modifications to the configurations previously explored in the theoretical and experimental investigations carried out in Refs 12, 17 and 31. By maintaining certain geometric parameters of Ref. configurations, four standalone grid fin configurations with different grid patterns have been designed for this investigation. Based on the shape of the grid cells (with different average gap [Reference Tripathi, Sucheendran and Misra11]), they have been named square, diamond, triangular and hexagonal grid fins (as shown in Fig. 2). To ensure a comprehensive comparative analysis, certain geometrical parameters across all four configurations were maintained as equal, that is geometric attributes such as the area of each cell, number of cells (N), chord length (c), thickness of the outer frame web (t o ) and thickness of the inner web (t i ).
Four distinct grid fin configurations: (a) diamond grid fin; (b) square grid fin; (c) triangular grid fin; (d) hexagonal grid fin; (e) isometric view of diamond grid fin; (f) average gap of different cells (defined in Ref. (Reference Tripathi, Sucheendran and Misra11)).

These grid fins have the same cross-sectional shape (rectangular) of the small lifting surfaces. The square grid fin configuration adopts square cells, while the diamond grid fin arrangement derives diamond-shaped cells by altering the orientation (with respect to centre axis of cell along with chord) of the square cells. Similarly, equilateral triangle and hexagon cells were utilised in the design of triangular and hexagonal grid fin configurations, respectively. The detailed geometric data are tabulated in Table 1.
Configurations geometry parameters details

1Dimensions in mm
2Dimensions in m
3Non- dimensional
4in degrees.
2.2 Computational mesh generation
Good quality mesh generation is vital for accurate and reliable numerical simulations. It creates a discrete geometric domain divided into small, interconnected cells where fluid flow and heat transfer equations are solved [Reference Frey and George31]. In this study, the FLUENT meshing module was utilised to generate the computational mesh. To ensure an appropriate mesh configuration, the model within the rectangular cuboid representing the fluid domain was positioned at a distance of 10c from the upstream inlet and 20c from the downstream outlet, as illustrated in Fig. 3a. For validation purposes, simulations were conducted on both the entire model and a half portion of model, utilising symmetry of the model. To achieve an unstructured mesh, tetrahedral cells were utilised within the fluid domain, along with prism layers near the grid fin surfaces. Additionally, a subdomain approach was employed to generate refined mesh (as seen in Fig. 3b) close to the grid fin model, to appropriately capture relevant flow gradients. The prism layers (as shown in Fig. 3d) was implemented on the model surfaces to ensure appropriate boundary layer resolution, necessary to capture boundary layer flow gradients in subsonic flow regimes. The first layer height within prism layer was set to 0.00022098c, corresponding to a targeted y + value of 1, thereby facilitating the capture of the viscous sub-layer region [Reference Ariff, Salim and Cheah32]. The prism layer consisted of 18 layers with a growth factor of 1.2. Furthermore, a refined mesh was specifically applied to the grid fin surface (Fig. 3c), utilising an element size of 0.55 mm. The mesh element size on the grid fin surface has been set to 0.012 times the global mesh size. The total number of cells employed in the computational mesh was 9 to 10 million, with a corresponding number of nodes amounting to 110,000.
Mesh details: (a) mesh domain; (b) mesh refinement near grid fin; (c) dense mesh element on grid fin surfaces; (d) prismatic layers close to walls.

2.3 Governing equations and flow solver
Modeling flow within the grid fin cells presents a formidable challenge, particularly due to the intricate interaction of shock waves generated at the blunt leading edges of lifting members of each cell, which give rise to complex flow phenomena. The mathematical description of flow within a continuum, which simulates the flow conditions, involves a set of five non-linear, differential and coupled three-dimensional equations. These equations encompass a continuity equation, three momentum equations, and an energy conservation equation. Together, they are known as the Navier-Stokes equations (NS), which are described as follows. The NS equations provide a fundamental framework for understanding and analysing fluid flow phenomena for three-dimensional, unsteady, compressible and turbulent flows.
Continuity equation
 \begin{align}\frac{{\partial \rho }}{{\partial t}} + \frac{\partial }{{\partial {x_j}}}\left[ {\rho {u_j}} \right] = 0 \end{align}
Momentum equation
 \begin{align}\frac{\partial }{{\partial t}}\left( {{\rm{\;}}\rho {u_{i{\rm{\;}}}}} \right) + \frac{\partial }{{\partial {x_j}}}\left[ {\rho {u_i}{u_j} + p{\delta _{ij}} - {\tau _{ji}}} \right] = 0,{\rm{\;}}i = 1,2,3 \end{align}
Energy conservation
 \begin{align}\frac{\partial }{{\partial t}}\left( {\rho {e_0}} \right) + \frac{\partial }{{\partial {x_j}}}\left[ {\rho {u_j}{e_0} + {u_j}p + {q_j} - {u_i}{\tau _{ij}}} \right] = 0 \end{align}
Where,
 $ {u_j} $
is flow density, t is time,
 $ {u_j} $
is j
th
component of velocity vector,
 $ {x_j} $
is j
th component of position vector, i is index,
 $ {\tau _{ij}} $
is viscous shear stress tensor, p is pressure,
 $ {\delta _{ij}} $
=1 for i = j and zero otherwise,
 $ {e_0} $
is total energy,
 $ {q_j} $
is heat flux.
Where
 $ {e_0} = e + \frac{{{u_i}{u_j}}}{2} $
Here, e is internal energy calculated by
 $ e = \frac{p}{{\left[ {\left( {\gamma - 1} \right)\rho } \right]}} $
 $ {q_j} = - \left( {{\rm{\;}}\frac{\mu }{{{P_{rL}}}} + \frac{{{\mu _T}}}{{{P_{rT}}}}} \right)\frac{{\partial h}}{{\partial {x_j}}} $
Here,
 $ h = e + \frac{p}{\rho } $
,
 $ {\rm{\;}}{P_{rL}} $
and
 $ {P_{rT}} $
are the laminar and turbulent Prandtl number, respectively.
 \begin{align*}{\tau _{ji}} = 2\mu \left( {{S_{ij}} - \frac{1}{3}\frac{{\partial {u_k}}}{{\partial {x_k}}}{\delta _{ij}}} \right) + {\tau _{ij}} \end{align*}
 \begin{align*}{\tau _{ij}} = 2{\mu _T}\left( {{S_{ij}} - \frac{1}{3}\frac{{\partial {u_k}}}{{\partial {x_k}}}{\delta _{ij}}} \right) - \frac{2}{3}\rho k{\delta _{ij}} \end{align*}
In this simulation, compressible flow is defined using the ideal gas assumption and the three-coefficient Sutherland law. According to this, kinetic viscosity is defined as follows:
 \begin{align}\mu = {\mu _{ref\;}}{{T \over {{T_{ref}}}}^{\;{3 \over 2}}}\,{{{T_{ref}}\; + S} \over {\;T\; + \;S}} \end{align}
where μ is dynamic viscosity, T is static temperature,
 $ {\mu _{ref}} $
is reference value,
 $ {T_{ref}}\; $
is the reference temperature and S is the Sutherland constant.
The commercial CFD software called Ansys FLUENT was selected as the preferred tool to accurately compute flow behaviour during the simulations. To solve the governing equations, the finite volume method [Reference Eymard, Gallouët and Herbin33] was employed, utilising an unstructured grid. In order to capture the turbulent nature of the flow, the realisable k-ε two-equation turbulent model [Reference Pope34] was utilised. To ensure accurate numerical results, a second-order, upwind discretisation scheme was implemented for both the flow variables and the turbulent viscosity. This selection of this discretisation scheme helps maintain the stability and accuracy of the computations. To tackle the challenges posed by high-speed compressible flow, an implicit, density-based solver was adopted. This solver can efficiently handle the complex interactions occurring within the flow, allowing for accurate and robust simulations. The numerical simulations were performed using workstation equipped with an Intel Core i7-12700K, CPU operating at 3.6 GHz with 20 cores and 40 threads, which enables efficient parallel processing. The system has 128 GB DDR4 of memory, ensuring smooth handling of large mesh files and complex simulation data. Additionally, it includes a dedicated NVIDIA Quadro P5000 graphics processing unit to accelerate computational tasks related to visualisation and post-processing. The simulations were conducted on an operating system Windows 11 64-bit environment, with licensed FLUENT software.
2.4 Flow and boundary conditions
Numerical study was carried out at several free stream Mach number of subsonic regime (Ma = 0.1, 0.3 and 0.5) with Re (based on chord length) ranging from 2.24 × 10⁴ to 1.12 × 10⁵ at 0o to 45o angle-of-attack. The flow simulation was conducted under standard ambient flow conditions, with static pressure of 101,325 Pa and a temperature of 288 K. To ensure accurate representation of the flow behaviour at compressible flow, far-field pressure boundary conditions were applied at the outer boundaries. On the other hand, at incompressible flow, velocity inlet, pressure outlet conditions were applied for the inlet and outlet boundaries, respectively. Symmetry conditions were imposed on the symmetry surfaces, and non-slip conditions were enforced on all solid surfaces.
To normalise the aerodynamic force and moment coefficients, the reference area was taken as the cross-sectional area (0.01266786 m2), while the reference length was defined as the diameter (0.127 m) of the cylindrical missile body throughout the simulations.
3.0 Results and Discussion
3.1 Qualitative analysis of mesh configurations and validation
3.1.1 Qualitative analysis of mesh configurations
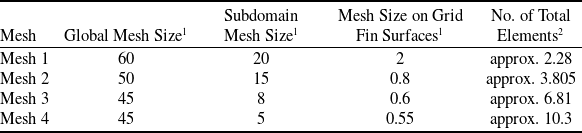
Qualitative analysis of mesh configuration was conducted by progressively obtained the CDF results of C N across varying mesh densities for the same grid fin geometry of isolated grid fin configuration G13 (as seen within graph in Fig. 4) As taken from reference study [Reference Theerthamalai12]. This analysis was performed at different α at Mach 0.35, and the CFD results were compared with available experimental data [Reference Theerthamalai12, Reference Washington and Miller35]. Using four different mesh configurations (as listed in Table 2), each with a desirable grid refinement factor (ratio of fine to coarse mesh elements) greater than approximate 1.5. Notably, mesh refinement was achieved by varying the mesh element size of global mesh, subdomain mesh and over grid fin surfaces with constant growth rate of 1.35. Total number of mesh elements correspondingly to the different mesh configurations are listed in Table 2.
CN vs. α plot: comparison between experimental result and present CFD data for G13 configuration of different mesh density at Mach 0.35.

Different mesh configurations with corresponding total mesh element counts

1Dimensions in mm
2Count in millions
The prismatic layers configuration remained the same for all the mesh configurations with the same first layer height corresponding to y + = 1. In this grid independence study, CFD results (C N ) corresponding to each mesh resolutions are compared with experimental results in Ref. (12).
Clearly from graph (see in Fig. 4), all mesh configurations showed minor deviations in C N up to 20o; however, beyond this α, they exhibited notable deviations, especially at higher α. This indicates that a fine mesh can more accurately capture the nonlinear characteristics of aerodynamic behaviour. Mesh 3 showed a deviation within of 7.4% in C N compared to the experimental results, whereas the coarser meshes (Mesh 1 and Mesh 2) demonstrated greater discrepancies, at higher α where flow separation became more significant. However, for Mesh 4, the C N demonstrates better agreement with the experimental data compared to the other meshes, at low α and especially at higher α (beyond 25o), where it accurately captures the nonlinear effects with a relative error of only within 2.8%. at the lower α (0o to 20o), all mesh configurations exhibit minimal deviation in C N , with a relative error of within approx. 9.8% compared to exp. results and within about 3% compared to theoretical predictions (more accurate in the linear range). Given that Mesh 4 contains a higher number of elements than Mesh 3, it necessitates substantially more computational resources and time. However, due to its enhanced ability to more accurately capture nonlinear aerodynamic behaviour at higher α, and its reliability in delivering consistent results, the Mesh 4 configuration was selected for further simulations.
3.1.2 CFD results validation
The numerical simulation conducted in this study has undergone a thorough validation process to ensure its accuracy and reliability. The validation was carried out by comparing the present CFD results with obtained data from a reference study [Reference Theerthamalai12, Reference Washington and Miller35]. The validation is carried out including C N and C A results for various grid fin configurations both integrated with the missile body (G2 and G15 configurations) and as standalone fins (G13 configuration) at various Mach numbers 0.35, 0.5, and 0.7. To calculate the relative error, following formula was used:
 \begin{align*}{\rm{Error}} = \frac{{{{\rm{C}}_{\rm{X}}}\left( {{\rm{sim}}} \right) - {{\rm{C}}_{\rm{X}}}\left( {{\rm{exp}}} \right)}}{{{\rm{max}}\left( {{{\rm{C}}_{\rm{X}}}\left( {{\rm{exp}}} \right)} \right)}} \times 100. \end{align*}
where CX (sim) = simulated CX, CX (exp) = experimental CX and max(CX (exp)) = maximum value of experimental CX.
Figure 5 illustrates the comparison of C N vs. α trends between the current simulation and the reference experimental and theoretical data of G2 and G13 configurations. As observed in Fig. 5a (validation plot of the G13 configuration at Mach 0.35), the CFD results, consistent with other methods, demonstrates an increase in C N with increasing α. However, beyond a critical α (α stall ), C N begins to decrease, indicating that the simulation enables capturing the flow separation phenomena. At lower α (α < 15o), the CFD results closely align with the theoretical predictions (error within 3.6%). However, C N shows a slight deviation from the experimental results, with a maximum error of 9.8%. At higher α (15o < α < 45o), experimental results indicate significant flow separation and complex flow behaviour, which CFD effectively captures, including nonlinear effects, with C N values showing only a 3.1% error. In contrast, theoretical predictions tend to overestimate C N . These C N trends demonstrate a satisfactory level of agreement between the CFD results and experimental data reported in Ref. (12) with a discrepancy of less than 9.8 %. Thus, the study successfully validated the C N data of grid fin alone configuration (G13), achieving an error less than 9.8% compared to the experimental data and theoretical predictions [Reference Theerthamalai12].
CN & CA vs. α trends of previous experimental study and current study: (a) CN data of configuration G13 (grid fin alone) at Mach 0.35; (b) CN data of configuration G2 (with missile body) at Mach 0.5; (c) CN data of configuration G15 (with missile body) at Mach 0.7; (d) CA data of configuration G15 at Mach 0.7.

Additionally, for the grid fin with a missile body configuration (G2), the normal force coefficient (C N ) was validated within 7.5 % error with the experimental data. Furthermore, for robust validation, the C A and C N data of another grid fin with missile body configuration (G15) were validated (comparison demonstrate in Fig. 5c and 5d) within a 8.4 % error with experimental results [Reference Theerthamalai12] at Mach 0.7. Hence, subsequent investigations made use of this validated CFD setup to carry out the necessary numerical simulations.
3.2 Comparative analysis of aerodynamic coefficients (CL, CD, CL/CD, Cm) of various grid patterns at Mach 0.5, 0.3, 0.1
3.2.1 Lift coefficient (CL)
In this section we analyse the CFD results related to lift coefficient (C L ) as a function of angle-of-attack (α) at various Mach numbers (Ma = 0.1, 0.3 and 0.5) for four distinct grid fin configurations under varying α as illustrated in the Figs 6 and 7.
CL vs. α graphs: comparison of configurations; (a) at Mach 0.5; (b) at Mach 0.3; (c) at Mach 0.1.

CL vs. α graph, comparison of individual configuration at various Mach numbers: (a) diamond (b) square (c) triangular (d) hexagonal grid fin.

Figure 6 illustrates variation of C L for different configurations at Mach 0.5, 0.3 and 0.1. For all patterns, C L increases linearly up to a specific α range (≈ 8o to 10o), corresponding to the stall angle typical of planar fins. However, due to the complex multiple lifting surfaces geometry of grid fins, the lift continues to increase beyond this α. This is accompanied by a slight reduction in the lift curve slope (C Lα ), attributed to an increase in flow separation. To understand the deviation in C L behaviour of these configurations, it is important to consider the cascade effect [Reference Tripathi, Sucheendran and Misra36]. The cascade effect, inherent to multiple lifting surface geometries, occurs due to interaction between the flows around adjacent lifting members. This interaction reduces the pressure difference between the upper and lower surfaces of individual lifting members, leading to a decrease in lift per member (compared to individual members). Despite this, the cascade phenomena also help in delaying the stall (higher value of α stall ) by accelerating leading edges flow within cells (or between lifting members) and mitigating the adverse pressure gradient. At lower α in the linear region, the C L curves align across all patterns and investigated Mach numbers due to minimal cascade effect. Furthermore, the diamond and triangular patterns exhibit a wider linear range compared to the hexagonal and square patterns because increasing the area of lifting surface (projected area) can postpone deviations from linearity. As α increases, flow separation intensifies, enhancing the influence of the cascade effect due to variations in g avg across different patterns, resulting in deviation of C L at higher α.
Figure 6 clearly demonstrates that the diamond grid fin consistently exhibits the highest C L , while the square grid fin shows the lowest C L across all Mach numbers and α. The former is attributed to the larger projection area of lifting surfaces pertaining to the diamond pattern [Reference Tripathi, Misra and Sucheendran26]. At lower Ma = 0.1 (as seen in Fig. 6c), the diamond grid fin closely follows the C L vs. α trends of the triangular grid fin. As the speed reduces, cascade effect pertaining to the all the patterns increase leading to mitigated lift values. However, due to the smaller g avg for the diamond pattern, this effect is more prominent, and hence the plots of the diamond pattern converge with the plots pertaining to higher g avg like the triangular grid pattern. Interestingly, the hexagonal configuration exhibits a smoother variation in C L (see Fig. 6), with a flattened stall region, making it the most favourable option for post-stall behaviour compared to other patterns (which display a steeper drop in lift). This enhanced manoeuverability across all investigated Mach numbers is attributed to the increased cascade effect and inclination effect [Reference Tripathi, Sucheendran and Misra11] (explained latter in next section) on the lowest horizontal member of the hexagonal grid fins, which reduces the flow separation and delays stalling. Additionally, the presence of inclined members (with large inclination angle) within the cell, especially the members attached to the lowermost plate, restrains the flow that further contributes to the increased lift.
The square pattern (in Fig. 6) also exhibits trends similar to the hexagonal pattern (delayed stall and a steeper drop in lift at higher angles) compared to the other two configurations. The overall structure embodies, no inclined members attached with the lowermost member, leading to reduced cascade effect influence, and hence the steeper drop in lift.
Figure 8 presents a bar graph comparing the C L across various α for all configurations at different Ma. At a lower α (α = 10o) (as seen in Fig. 8a), the diamond grid fin exhibits the highest C L at Ma = 0.1 due to the higher A p at such lower α and speeds. The square and hexagonal grid fins demonstrate comparable performance at lower Mach numbers (minor influence of g avg ). However, the square pattern achieves slightly higher C L at higher Mach numbers due to its high g avg , which reduces the cascade effect influence, leading to higher lift. Due to influence of the same effect, the triangular pattern (comparatively higher g avg ) marginally outperforms the diamond pattern at higher Mach numbers. As α increases (α = 20o and 30o: Fig. 8b and 8c), the diamond configuration maintains its higher C L value with the highest C L. This is associated with the increased influence of highest A p value especially at lower Mach. Other configurations demonstrate the combined influence of A p and g avg on C L trends, showing higher values at α = 30o with similar trends observed at α = 20o.At a higher angle-of-attack (α = 45°), the hexagonal fin demonstrates gradual C L drop, showcasing the best post-stall characteristics, thereby surpassing square and triangular fins, especially at higher Mach numbers. This is attributed to its balanced impact of moderate A p and g avg at such high α. These C L results at higher α indicate that the diamond and hexagonal grid fin configurations reveal enhanced manoeuvering characteristics, making them well-suited for highly manoeuverable flight vehicles.
Comparison of CL at 10, 20, 30 and 45 degrees α of all configurations at various Mach numbers.

Figure 7 illustrates the variation of C L with α, providing a Mach number-wise comparison for each individual configuration. All grid fins exhibit a progressive increase (start with linearly and then nonlinearly) in C L with α across all Mach numbers, peaking at different points depending on the grid pattern and flow conditions (physics discussed earlier). As the Mach number increases, C L also rises with increasing α, exhibiting significant deviation particularly at moderate α (stall region), across all patterns. These trends are attributed to the increase in Reynolds number, which leads to higher turbulence, enhancing flow separation especially at higher α. This, in turn, increases the pressure difference across the members, resulting in higher C L .
The triangular pattern demonstrates (as seen in Fig. 7c) minimal variation in lift capability with changes in flow speed while maintaining sufficient lift at lower Mach numbers. This is associated with the fact that the lift is influenced by flow separation at the blunt leading edges as it exhibits the highest l m leading to increased influence of the blunt leading edges. Thus, the overall deviation between different Mach numbers attributed to cascade effect and increased flow speeds is reduced leading to subdued variation between the different plots. At Mach 0.1, the C L decreases gradually at higher α compared to its trend at higher Mach numbers, while its lift-generating capability remains similar to that at Mach 0.3.
To analyse how effectively lift increases with a change in α for each grid pattern, a comparison bar chart of the lift curve slope (C Lα ) calculated using linear range between α = 0o to 9o is plotted in Fig. 9 for all the investigated patterns across various Mach numbers. The diamond fin exhibits a higher lift curve slope compared to other configurations at higher Mach numbers, which decreases with reducing Mach number. This highlights its superior lifting capabilities, as previously discussed. The square and triangular configurations exhibit approximately identical C Lα at higher Mach numbers, while the triangular pattern demonstrates slightly higher values at lower Mach numbers. The reason behind this behaviour is that the square pattern has the smallest A p (responsible for lower lift) but the largest g avg (responsible for higher lift), while the triangular configuration has a larger A p but a smaller g avg . This combined effect results in similar C Lα characteristics. However, at lower Mach numbers, l m becomes more dominant than g avg in generating lift, particularly at lower ranges of α. The hexagonal pattern represents the lowest C Lα characteristics, with minimal variation across all Mach numbers. This behaviour is attributed to the combined influence of moderate A p , g avg , and the lowest l m (reduced separation at blunt leading edge) resulting in lower C L value increment for α enhancement within applicable α range.
Comparison of CLα variations for all grid patterns at various Mach numbers.

3.2.2 Stall characteristics
The aforementioned results indicate the stalling characteristics and maximum C L values of different grid fin patterns at various Mach numbers and is presented in Figs 10 and 11. A delayed stall behaviour (higher α stall ) in grid fins enhances the flight vehicle’s manoeuverability, making this parameter essential for efficient control surface design and selection. In complex grid fin geometries, the topmost lifting member’s stalls first without affecting lift, while the lowermost member’s stall governs the overall grid fin stall behaviour (established in Ref. (27)). All grid fin patterns showcase (as illustrated in Fig. 10) stall behaviour at α ranging between 28 and 35 degrees, which is significantly higher compared to conventional fins. However, hexagonal configuration exhibits the best stall (α stall ≈ 35°), and post-stall behaviour while the diamond pattern demonstrates, earliest stall (α stall ≈ 28° at Mach 0.5) among all Mach numbers. This behaviour is primarily attributed to the inclined members (in complex geometry of grid fin) on the lowermost member. As the inclination angle (δ = 120o for hexagonal and δ = 45o for diamond), increases the pressure differential across the inclined member rises, enhancing the inclination effect. This results in elevated flow downwash on the lowermost members, leading to a higher stall angle. The square pattern (no inclination) exhibits delayed stall characteristics, which is almost comparable (equal at lower Mach) to the hexagonal pattern, due to similar reasons discussed earlier. Notably, the triangular pattern (which have δ = 30o) and diamond patterns exhibit similar stall behaviour, being identical at lower Mach 0.1, while the triangular pattern shows slightly higher stall angles at higher Mach numbers.
Comparison of stall angle (in deg.) for all configurations at various Mach numbers.

Comparison of maximum CL values for all configurations at various Mach number.

This behaviour is attributed to the diamond configuration geometry, where all members connected with lowermost member (which is more responsible for grid fin stall) are inclined at a 45o inclination angle. However, in the case of the triangular grid fin, some members have a lower inclination (δ = 30o), while others have no inclination. This results in an equivalent inclination effect at lower speeds, leading to similar stall characteristics. However, at higher speeds, the vertical members connected in the lowermost member of the triangular pattern mitigate this inclination effect, demonstrating a delayed stall. The deviation in C Lmax (Fig. 11) for different patterns is primarily attributed to variations in the projection area of lifting members (A p ) and gaps in the geometries of the grid fins. As the gap decreases, the cascade effect (disscused earlier) increases, leading to a reduction in the pressure differential between the upper and lower surface of members [Reference Tripathi, Sucheendran and Misra36]. Consequently, this results in a reduction of C Lmax . As clearly observed in Fig. 11, all grid patterns showcase higher C Lmax values at higher Mach numbers, which decrease with reducing flow speed. This behaviour is due to the higher Reynolds numbers leading to higher potential lift, and hence the higher C Lmax values. The diamond configuration consistently exhibited the highest C Lmax values among all the configurations due to higher A p, which highlights its superior ability to generate higher lift (C Lmax ), especially at higher subsonic speeds. In contrast, the square configuration demonstrated the lowest C Lmax values due to the lowest A p , starting at 0.27 for Mach 0.5 and decreasing to 0.25 at Mach 0.1. The triangular and hexagonal patterns exhibited moderate performance in generating C Lmax , with the triangular pattern achieving slightly higher C Lmax than the hexagonal pattern due to its larger projected area.
3.2.3 Drag coefficient (CD)
Numerical results comprehensively outline the drag coefficient (C D ) for different grid fin configurations, across a range of Mach numbers 0.1 ≤ Ma ≤0.5 and α, as shown in Figs. 12 and 15. At subsonic flow regimes, aerodynamic drag is attributed to the combined effect of skin friction, pressure drag due to flow separation at blunt edges, and adverse pressure gradients at high α, as well as interference drag due to wake interaction flow at interference nodes (or junction) of lifting member. The C D vs. α trends for the hexagonal and square patterns demonstrate an almost linear variation (Fig. 12) at higher α (beyond 10o) compared to the other grid patterns. This behaviour is attributed to the higher g avg , which reduces the overall cascade influence, leading to a decrease in non-linear variations. At α = 0o, C D is predominantly influenced by skin friction (higher for large A w ) and base drag due to blunt leading edges, which further depends on the number of junctions (N j ) and length of the blunt leading edges (l m ). The C D results demonstrate highest drag for triangular cells (due to the highest A w , l m and small internal angle) and the least for square cell pattern (due to smaller A w , l m and large internal angle) at higher Mach (as shown in Fig. 13). The hexagonal pattern exhibits lower drag compared to the diamond and triangular patterns due to its minimal wetted area (closely resembling a circular shape, which reduces the wetted area), higher internal angles, and the shortest total edge length of its members, resulting in reduced drag values. However, the diamond pattern generates higher drag at α = 0° (C D0 ) than the triangular pattern at lower Mach numbers (Fig. 13) due to the dominance of interference drag (because of number of junctions) over skin friction drag (attributed to the total area of members) at such lower speeds. This deviation in C D becomes increasingly pronounced at high α values.
CD vs. α graphs, comparison of all configurations: (a) at Mach 0.5 (b) at Mach 0.3 (c) at Mach 0.1.

Comparison of CD at zero deg. angle-of-attack of all configurations at various Mach numbers.

As α increases, flow separation becomes more significant (beyond α ≈25o). The bluntness of the lifting member’s leading edge (rectangular in shape) has the greatest impact on drag. More edges lead to greater leading-edge flow separation. The cascade effect between neighbouring fins accelerates the flow, leading to reattachment and reduced flow separation, which reduces the drag value. Therefore, a more open pattern results in higher flow separation and higher drag [Reference Tripathi, Sucheendran and Misra36]. At range of lower α, the triangular pattern shows higher drag (explained earlier in this section), but at higher α (beyond α ≈20o), the diamond pattern exceeds it across all Mach numbers. This is attributed to the diamond pattern having a greater number of junctions, which dominate at higher α, leading to increased interference drag.
A similar trend is observed with the hexagonal pattern (higher N j and g avg ), which exhibits higher or closer drag at higher α >40o (lower drag at lower α) compared to the triangular pattern (less N j and g avg ). This increased drag in the hexagonal pattern is attributed to more open cells (higher g avg ), which promotes greater flow separation and hence the increased pressure drag at higher angles.
Drag at α = 0° associated with these patterns is analysed and compared in Fig. 13, which illustrates the results using a histogram plot. As discussed earlier, the diamond and triangular patterns exhibit higher drag values compared to the square and hexagonal patterns. This is primarily attributed to increased skin friction, influenced by the surface area of the members, and greater pressure drag, driven by the blunt leading edges. The square and hexagonal patterns exhibit nearly identical C D0 at higher Mach numbers due to their comparable total surface areas of members, resulting in equivalent combined effects of A w and N j . However, for lower Mach numbers, the square pattern demonstrates the lowest drag, while the hexagonal pattern experiences higher drag. This deviation is primarily caused by influence of interference drag, with the hexagonal pattern (featuring a higher N j ) incurring higher drag, being closer to the triangular pattern value at lower speeds. For the same reason, at lower Mach number, the diamond pattern (more N j ) experiences an increase in drag, while the triangular pattern (least N j ) exhibits an even greater decrease compared to its drag at higher Mach numbers.
Figure 14 illustrates the % change in C D0 for square, triangular and hexagonal grid fins relative to the diamond grid fin.
Percentage change in CDo of other three configurations relative to diamond grid fin at various Mach numbers.

CD vs. α graph, comparison of individual configuration at various Mach numbers: (a) diamond grid fin (b) square grid fin (c) triangular grid fin (d) hexagonal grid fin.

The square configuration consistently displays reduced drag, with a decrement of 5.92%, 6.15%, and 13.99% at Mach numbers 0.5, 0.3 and 0.1, respectively, highlighting its ameliorated drag performance, especially at lower speeds. The hexagonal configuration also showed the highest reduction of 7.11% drag at Mach number 0.1. In contrast, the triangular configuration increased drag by 8.04% and 8.56% at Mach 0.5 and 0.3, but decreased by 4.73% at Mach 0.1, indicating speed-dependent drag characteristics. These findings emphasise that square and hexagonal configurations exhibit the lowest drag characteristics, thereby reducing the thrust requirements during flight. All patterns consistently demonstrate drag reduction with Mach number reduction (as illustrated in Fig. 15) at all angles. However, the triangular patter at steep angles displays subtle deviation from this trend and emphasises a lower drag value for the Mach 0.3 at high angles.
In fact, this pattern presents very little variation between the different plots pertaining to various Mach number variations (Fig. 15c). This can be attributed to the reduction in flow turbulence as the flow speed decreases, which subsequently reduces the skin friction drag and hence the drag reduces for lower Mach numbers. As a result, at lower Mach 0.1, the triangular pattern exhibits C D values closely aligned with those of the diamond pattern. Notably, the square pattern demonstrates a sharper reduction in C D with decreasing Mach number compared to other patterns (as shown in Fig. 15b).
3.2.4 Aerodynamic efficiency (CL/CD)
Aerodynamic efficiency (ratio of C L /C D ) pertaining to square, diamond, triangular and hexagonal grid fins for different Mach numbers (Ma = 0.5, 0.3, 0.1) at different angles of attack (α), are presented in the Figs 16 and 17. These graphs indicate that the operational angle-of-attack range for these patterns, when integrated with the flying vehicle, is approximately 5o to 20o. Within this range, the configurations achieve aerodynamically efficient flight, supporting high payload capacity with reduced thrust requirements. The C L /C D value increases rapidly at lower α, peaks between approximately 9o and 11o and then exhibits a sharp decline as α increases further. Finally, it stabilises at a C L /C D value of 1. All configurations exhibit this behaviour consistently across different tested Mach numbers. This behaviour is attributed to the dynamics of lift and drag at varying α. At lower α, lift increases rapidly, exceeding drag, which changes more gradually. At a certain α, the difference between lift and drag reaches its maximum, corresponding to the peak C L /C D value. Beyond this point, as α increases further, drag begins to dominate over lift. At higher α, lift starts to decrease, while drag continues to increase gradually, eventually converging. Deviations in C L /C D are observed only at the peak values due to distinct geometric parameters of the patterns. However, no significant changes are observed at smaller α (α < 5o) and higher α (α > 30o) across all pattern variants and Mach numbers. The diamond pattern exhibits the highest (C L /C D ) max value compared to other patterns, attributed to its ability to generate higher lift at Mach 0.3. The triangular pattern demonstrates a higher aerodynamic efficiency due to its ability to generate higher lift and lower drag at lower angles of attack (α) at Mach 0.1. Interestingly, the diamond pattern configuration exhibits a more gradual decline in C L /C D compared to other patterns, making it potentially suitable for efficient manoeuvrability at higher Mach numbers (see in Fig. 16a and 16b). A similar behaviour is exhibited by the triangular pattern, closely aligning with the C L /C D – α curve of the diamond pattern at lower Mach numbers (Fig 16c). This behaviour in C L /C D trends is attributed to fact that the diamond pattern presented high lifting capability, with a steeper increase observed between 10° and 20° at higher Mach numbers. A similar trend is exhibited by the triangular pattern, albeit at a low Mach number of 0.1.
(CL/CD) vs. α graphs, comparison of all configurations: (a) at Mach 0.5 (b) at Mach 0.3 (c) at Mach 0.1.

(CL/CD) vs. α graphs, comparison of individual configuration at various Mach numbers: (a) diamond grid fin (b) square grid fin (c) triangular grid fin (d) hexagonal grid fin.

The effect of Mach number variation on the aerodynamic efficiency of individual patterns is illustrated in Fig. 17. All patterns demonstrate slightly higher aerodynamic efficiency (C L /C D ) at Mach 0.3 compared to Mach 0.5, which is attributed to the increasing Mach number (within subsonic regime) enhancing compressibility effects and leading to higher drag. All configurations exhibit a reduction in aerodynamic efficiency at Mach 0.1, particularly at the peak region, with deviations influenced by the geometry of the grid fin. However, the triangular pattern presents the highest C L /C D value as seen in Fig. 17c for the Mach 0.1 case. This occurs because the triangular grid fin sustains lift at lower speeds while reducing drag, resulting in improved aerodynamic efficiency. In contrast, other patterns exhibit a greater reduction in C L for lower Mach numbers while maintaining C D at such low speeds resulting in reduced C L /C D values for lower Mach numbers.
The maximum (C L /C D ) max values achieved by these configurations under different flow conditions are presented for comparison in Fig. 18. The diamond pattern exhibits the highest (C L /C D ) max value compared to other patterns, attributed to its ability to generate higher lift, slightly surpassing the square pattern at Mach 0.3. However, at higher Mach 0.5, the (C L /C D ) max value for the diamond pattern decreases and becomes nearly similar to the square pattern. Triangular pattern showcases the highest (C L /C D ) max at lower speeds (exhibiting an opposite behaviour at higher Mach numbers). This is due to the triangular grid fin’s ability to maintain lift at lower speeds while minimising drag, leading to enhanced aerodynamic efficiency. At Mach 0.5, the square configuration achieves the highest (C L /C D ) max value, closely followed by the diamond configuration. This is likely attributed to their geometric characteristics, which optimise lift while minimising drag.
Comparison of maximum aerodynamic efficiency of all configurations at various Mach numbers.

Comparison of α, which have (CL/CD)max of all configurations at various Mach numbers.

This trend reinforces the superior performance of the diamond and square configurations at higher Mach numbers, while the triangular configuration achieves its peak performance at lower Mach numbers. The hexagonal pattern shows moderate maximum aerodynamic efficiency across all Mach numbers, with a slight improvement observed at Mach 0.3. The results presented in Fig. 19 compare α at which maximum (C L /C D ) occurs for all pattern variants at tested conditions. The triangular grid fin indicates improved aerodynamic efficiency at slightly higher angles of operation, with this angle (α (CL/CD)max ) increasing as the Mach number increases. Other configurations exhibit similar these α (CL/CD)max values (α = 9o) at higher Mach numbers; however, the diamond (α = 11o) and square (α = 10o) configurations show higher α (CL/CD)max values at the lower Mach number of 0.1. Figure 20 presents a bar chart comparing the percentage variation in (C L /C D ) max for all grid fin configurations relative to the diamond pattern across different Mach numbers. It clearly emphasises that the grid fins with square pattern tend to have a better or similar (C L /C D ) max performance compared to the diamond pattern at higher Mach number, exhibiting an 0.15% increment at Mach 0.5.
Percentage change in (CL/CD)max of other three configurations relative to diamond grid fin at various Mach numbers.

However, it exhibits slightly lower (C L /C D ) max at lower speeds, leading to a lowering of 0.36% at Mach 0.3 and a 0.84% decrement at Mach 0.1. The triangular fins are less aerodynamically efficient with increasing Mach number, showing a reduction in (C L /C D ) max of 7.81% at Mach 0.5 and 8.06% at Mach 0.3.
However, at lower speed (Ma=0.1), triangular grid fin performs better compared to the diamond pattern, leading to an increased (C L /C D ) max of 2.89%. The hexagonal pattern displays a higher (C L /C D ) max decrement of 2.42% at Mach 0.5 and 2.29% at Mach 0.3. However, its (C L /C D ) max improved by 0.40% at lower Mach 0.1, compared to the diamond pattern. A detailed analysis of these variations is crucial as it will further determine the expected performance of different cell patterns across varied Mach numbers.
3.2.5 Pitching moment coefficient (Cm)
The hinge moment quantifies the actuator energy required to control the grid fins deflection during flight. Grid fins exhibit minimal centre of pressure variation compared to planar fins, which is a significant advantage. As a result, grid fins demonstrate lower hinge moments than conventional fins. The results related to the pitching moment coefficient (C m ) will determine the hinge moment requirements for the specific configuration. This section analyses the influence of grid fin patterns on the C m across different flow conditions (as seen in Figs 21 and 22). This determines the location of the midpoint along the chord and height (as seen in Fig. 2e). The C m generally exhibits negative values, indicating nose down moments across various configurations. Each configuration displays distinct trends in C m with varying α and Mach numbers. Figures 21 and 22 clearly illustrate that the C m remains approximately zero at small α. As α increases, the C m values exhibit a negative trend, resulting in a negative slope consistent across all configurations.
Cm vs. α graph, comparison of various configuration at: (a) Mach 0.5 (b) Mach 0.3 (c) Mach 0.1.

Cm vs. α graph, comparison of individual configurations at various Mach numbers.

All patterns indicate a transition of the pitching moment: stable up to 15o, neutrally stable beyond 15o, and hence all the configurations present stable pitching moment performance in this range of α. The hexagonal grid pattern demonstrates the highest stability across all Mach numbers due to its steep C m versus alpha slope (denoted as C mα ). However, the square pattern exhibits a gradual decline in C m (a less steep slope) and shows an earlier loss of stability (at α ≈ 10o) due to its expedited stalling characteristics. Due to this behaviour, the square pattern demonstrates the minimum hinge moment requirement compared to other patterns (as seen in Fig. 21) across all the Mach numbers. The diamond pattern demonstrated the most delay in stability reduction (up to α ≈ 20o) and maintained neutral a stability beyond α ≈ 20o across all speeds. The triangular fin exhibited generally lower C m compared to the diamond pattern. Its slope (C mα ) was lower at Mach 0.3 (see in Fig. 21b) and nearly identical at Mach 0.1 and 0.5, reflecting a consistent aerodynamic response. The Mach number-wise variation in C m for all grid fin configurations is illustrated in Fig. 22. Similar trends in C m with increasing angle-of-attack are observed at higher Mach numbers, particularly beyond α = 20o. Notably, the diamond pattern shows greater deviation within α ≤ 20o. At Mach 0.1, all configurations exhibit lower C m values, indicating lower hinge moment requirement at lower speeds. This decrease in C m is associated with a corresponding reduction in lift generation. At Mach 0.1, the square pattern exhibits a higher deviation in C m compared to higher Mach numbers, indicating greater sensitivity to speeds at subsonic speeds.
This analysis underscores the significance of configuration selection in aerodynamic design, where the square and triangular grid fins excel in generating higher aerodynamic pitching moments, whereas the hexagonal and diamond grid fins present a more stable trend.
3.3 Flow visualisation
This section presents a qualitative analysis of the investigated grid fin patterns using flow field visualisation plots. The analysis includes Mach number and pressure coefficient contours (C p ) for grid fins at a high angle-of-attack (α =25o, before stall condition) and a Mach number of 0.5. These contours are plotted at the three sections viz. s1, s2 and s3 along the span wise locations (as mentioned in Fig. 23) of all grid pattern. The selected sections are strategically located to facilitate the visualisation of flow behaviour at the minimum gap, average gap and maximum gap between the lifting members of different cells (as demonstrated in Fig. 23). Examining the velocity and pressure distributions across all surfaces of these grid fins provides valuable insights into the flow-physics associated with these complex grid fin geometries.
Location of different contour sections in xy plane for all pattern grid fin.

Mach number contour in xy plane with different sections at α = 25o and Mach 0.5 for: (a) diamond (b) square (c) triangular (d) hexagonal grid fin.

The Mach number contours (seen in Fig. 24) clearly demonstrate that the flow within the cells become energised, effectively delaying issues caused by adverse pressure gradients. As a result, all grid fins are capable of sustaining lift at higher angles of attack. It is clearly observed that due to the cascade effect (influence of neighbouring members [Reference Tripathi, Sucheendran and Misra36]), flow separation is reduced for upper surface of all cascaded members for all the variants. This is determined by the size of the separation bubble (indicated through blue colour). The flow separation bubbles on non-cascaded upper surfaces (those without a surface above them or with a larger gap to the upper member) are consistently larger in all cases compared to those on cascaded upper surfaces (those with a surface above them or with a lower gap to the upper member). Interestingly, in the case of square and hexagonal patterns, the flow separation on the upper surface of the lowermost member is more pronounced compared to the middle members’ surfaces and the lowermost members of other patterns (as seen in Fig. 24b and 24d). This indicates that the lowermost member of these patterns experiences enhanced flow separation compared to others. This observation confirms that stalling occurs on the lowermost member of these members after the topmost member, which defines the overall stall angle of the grid fin [Reference Tripathi, Misra and Sucheendran27]. For this reason, the hexagonal and square patterns exhibit delayed stall and superior post-stall behaviour.
The constrained geometry of each cell accelerates the flow within the cells and reduces the overall flow separation intensity, as indicated by the decreased C p values on the upper surfaces of the members in all cases (as shown in Fig. 25). A larger gap between the members generates high pressure on the lower surface of the upper members and low pressure on the upper surface of the lower members, resulting in increased lift (Fig. 25a). The diamond and triangular patterns exhibit a higher-pressure difference across all members at the specific contour sections (variations in the gaps between cell members), as shown in Fig. 25a and 25cfigure25. Consequently, this is one of the reasons these patterns exhibit the highest lift and drag characteristics.
Cp contour in xy plane with different sections at α = 25o and Mach 0.5 for: (a) diamond (b) square (c) triangular (d) hexagonal grid fin.

3.4 Flow physics involving the complex geometry of grid fins
A grid fin is a structurally intricate aerodynamic control surface consisting of inclined, horizontal and vertical lifting members arranged in a cell pattern within an outer frame. In the subsonic regime, the complex flow physics around grid fins make their aerodynamic behaviour challenging to analyse.
At zero angle-of-attack: at α = 0o, skin friction drag arises from air viscosity within the boundary layer, while pressure drag results from flow separation at blunt leading edges due to an adverse pressure gradient [Reference Tripathi, Sucheendran and Misra36]. Interference drag occurs from wake interactions at member junctions and internal cell angles. Thus, the wetted area, leading edge length, interference nodes, and cell internal angles significantly influence the grid fin’s overall drag. At this α, lift remains zero due to the absence of a net pressure difference between the upper and lower surfaces of the lifting members. Drag is a major drawback of this configuration compared to conventional control surfaces due to the presence of multiple planar members forming closed cells. An increase in the number of members leads to higher skin friction drag, while the greater length of blunt edges further increases pressure drag, resulting in a higher total drag. The interference between neighbouring members, known as the cascade effect [Reference Tripathi, Sucheendran and Misra36], significantly influences the aerodynamic characteristics of a grid fin. An increase in the gap (cell size) between members, defined by the average gap (g avg ) for the entire grid fin, leads to greater flow separation, resulting in higher pressure drag and skin friction drag (due to the increased wetted area), ultimately increasing the total drag of the grid fin. Conversely, reducing the gap (g) between members (enhancing the cascade effect) accelerates the flow within the cells, decreasing pressure drag and consequently reducing the total drag.
At non-zero angle-of-attack (α): at this condition pressure difference contributing to lift and drag remains balanced along the chord for all lifting surfaces due to the identical shape of the leading and trailing edges of the members [Reference Tripathi, Misra and Sucheendran27]. As α increases, the C L rises linearly, attaining higher linear range than those of a monoplane. This increase persists up to a certain α, characterised by a steeper lift curve slope due to flow separation. Flow separation occurs due to geometric irregularities at blunt leading edges and the presence of an adverse pressure gradient, which generates lift and contributes to drag forces at high α. Beyond this angle, the increase in C L becomes nonlinear, primarily due to the formation of eddies and vortices. The C L curve rises with increasing α until reaching a critical point (stall angle), beyond which it gradually declines due to excessive flow separation. Even at high α, these multiplanar fin maintain a steady C L without the abrupt drop commonly observed in conventional stall for traditional control surfaces. This trait suits high-manoeuverability missiles or other flight vehicle. The previous research’s findings [Reference Tripathi, Sucheendran and Misra36] establish that in this grid fin structure, the topmost members are the first to stall due to excessive flow separation in the larger area. However, the presence of additional members prevents a significant decrease in lift, even after the topmost member stalls. Subsequently, the lowermost members stall next, and its stall behaviour critically influences the grid fin’s overall stall characteristics.
The cascade effect reduces the pressure difference between the lifting members, diminishing lift and drag generation, as well as a smaller gap energises the flow within the cell, mitigating the adverse pressure gradient. This effect becomes more significant at higher value of α. Consequently, a grid fin with a smaller average gap generates less lift and exhibits a lower maximum lift coefficient, along with a delayed (increased stall angle) and more gradual stall [Reference Tripathi, Mahesh and Misra10]. A larger gap between lifting members leads to increased flow separation, thereby increasing both the lift and drag coefficients. Moreover, a larger lifting area increases the total lift produced, while the stall angle remains unaffected [Reference Tripathi, Misra and Sucheendran26].
4.0 Conclusion
The primary scope of this study is to investigate the subsonic aerodynamic characteristics of various grid patterns in isolated grid fin configuration. To achieve this objective, a computational fluid dynamics (CFD) methodology was employed to simulate the flow around four different grid pattern variants under various flow conditions. To ensure the reliability of the numerical results, validation was conducted during the initial stage by comparing with experimental study results. This study will contribute to the real-world application of grid fins by identifying the most suitable configuration tailored to specific mission requirements, along with a comprehensive analysis of its advantages and limitations.
The study outcomes reveal that the diamond cell pattern emerges as the most aerodynamically efficient configuration, offering higher lift generation capabilities, albeit with a higher drag penalty. The square pattern variant demonstrated minimum drag and lowest hinge moment requirement, making it an excellent choice for applications requiring optimal weight efficiency. The hexagonal grid fin stands out for its superior stall delay characteristics and efficient post-stall performance, making it particularly well-suited for highly manoeuverable flight vehicles. Moreover, it offers enhanced and extended stability, albeit at the cost of an increased hinge moment. Finally, the triangular pattern exhibits balanced aerodynamic performance, delivering moderate levels of lift, drag and pitching moment. Its high aerodynamic efficiency at lower speeds further adds to its suitability for specific applications. Additional insights from this comprehensive numerical study are highlighted as follows:
-
1. The aerodynamic coefficients exhibit distinct variations with changes in α. For instance, the lift coefficient (CL) and pitching moment coefficient (Cm) increase with a steeper gradient, whereas the drag coefficient (CD) increases more gradually. Additionally, the lift-to-drag ratio (CL/CD) demonstrates a steep rise at lower angles of attack but transitions to a different behaviour at higher α. The deviations in aerodynamic coefficients across various grid patterns at specific α can be attributed to the influence of geometrical shape (variable some geometric parameters) and the associated flow complexities, which vary with Mach numbers.
-
2. The influence of aerodynamic parameters is governed by factors such as the total projection area, total surface area, edge length of the members, average and maximum gap between lifting members, aspect ratio, internal angles of grid cells, number of cells, total cell area, inclination angles of inclined members on lower members and the number of junctions. While the shape of the cell pattern itself is not a direct determinant, it inherently encompasses the aforementioned parameters and, therefore, indirectly impacts aerodynamic performance.
-
3. CL is primarily governed by the combined influence of the total projection area of the lifting members (Ap) and the average gap (gavg) between them. Additionally, the total length of the blunt leading edge plays a significant role in determining CL, particularly at lower α and Mach number.
-
4. At lower α, the CD is predominantly influenced by the wetted area of the members (Aw), the number of junctions (Nj), and total length of the blunt leading edges (lm), especially at higher Mach numbers. However, at lower Mach numbers, interference drag resulting from Nj has a more pronounced effect than skin friction drags, which arises from the Aw. Furthermore, at higher angles of attack, CD is significantly affected by both the length of the blunt leading edges (lm) and the average gap (gavg) between the grid members.
-
5. The stall characteristics and post-stall behaviour of the all the grid fins are primarily governed by the stall behaviour of its lowermost members, which are influenced by the inclined members attached at specific inclination angles (δ). At higher inclination angles, the pressure differential across the inclined member’s increases, amplifying their effect. This phenomenon leads to an elevated stall angle, resulting in delayed and improved post-stall behaviour observed in hexagonal and square pattern grid fins.
-
6. The effect of the grid pattern on aerodynamic efficiency was not as significant as anticipated. However, the diamond and square configurations demonstrated the most optimal balance between lift and drag generation, particularly at higher Mach numbers.
-
7. Square grid fins show better or comparable (CL/CD) max performance to diamond patterns at higher Mach, with a 0.15% increase at Mach 0.5. However, they perform slightly worse at lower speeds, with reductions of 0.36% at Mach 0.3 and 0.84% at Mach 0.1. Triangular fins are less efficient at higher Mach increases, with (CL/CD) max reduction of 7.81% at Mach 0.5 and 8.06% at Mach 0.3, but outperform diamond fins at Mach 0.1 with a 2.89% increase. Hexagonal fins presented (CL/CD) max decrement of 2.42% at Mach 0.5 and 2.29% at Mach 0.3 but an improvement of 0.40% at Mach 0.1.
-
8. The hexagonal grid pattern offers superior stability across all Mach numbers due to its steep Cm versus α slope, indicating a significant reduction in Cm and an increased hinge moment requirement for control. Conversely, the square pattern displays a steeper decline in Cm, resulting in earlier stability loss due to accelerated stalling behaviour. The diamond pattern demonstrates delayed stability decrement and maintains neutral stability beyond α ≈ 20o at all speeds, showcasing its capability to withstand higher angles of attack. The triangular grid fin generally exhibits lower Cm compared to the diamond configuration, with slightly lower C mα at Mach 0.3 and nearly identical behaviour at Mach 0.1 and 0.5, indicating a more consistent aerodynamic response.
These insights provide a foundation for selecting grid fin complex cell pattern configurations to meet the aerodynamic pre-requisites for various aerospace applications. Critical evaluation of these results could be a productive step towards selecting the final geometry based on maintaining a critical balance between aerodynamic efficiency, stability and overall performance. Future research may focus on developing a hybrid grid fin configuration that integrates optimal features from each pattern to improve aerodynamic efficiency and performance.
Acknowledgements
The authors sincerely express their gratitude to the Department of Aerospace Engineering at the Defence Institute of Advanced Technology (DIAT) for providing the facilities essential for this study. This work was supported through the ARMREB-DRDO project Grant (No. ARMREB/ADMB/2023/266). We extend our heartfelt thanks to Mr. Vaibhav Gonjari, Sr. Lab Asst., Aerodynamic Lab for his unwavering support.