The past is a kind of screen upon which each generation projects its vision of the future; and so long as hope springs in the human breast, the “new history” will be a recurring phenomenon.
Carl Becker (Reference Becker1921: 642)Introduction
This article grew out of my attempt in 2005 to quantify the late-twentieth-century boom and bust of quantitative approaches in historical research. The decline of historical quantification was obvious to anyone who lived through it, but I felt compelled to try to measure its magnitude. Accordingly, I did full-text JSTOR searches of 14 mainstream historical journals for terms suggesting the use of quantitative methods, such as “table 1,” “multiple regression,” and “coefficient.” I found a fourfold to eightfold increase in the percentage of articles using such terms between the early 1960s and the early 1980s, and almost as great a decline from the 1980s to 2000.
Although by 2005 quantitative historical research had disappeared almost entirely from mainstream history journals, it was still being published in other social sciences. To investigate these disciplines, I searched leading journals in demography, sociology, and economics, looking for terms suggesting a historical focus, such as “nineteenth century” or “cliometrics.” These results suggested a modest increase in historical work in the demography journals and somewhat larger increases in sociology and economics during the last three decades of the twentieth century. In a presentation at the 2006 meeting of the Social Science History Association in Minneapolis, I concluded that quantitative history was dying among historians but showed healthy growth in the other social sciences (Ruggles Reference Ruggles2006).
My quick-and-dirty JSTOR approach, however, was prone to error. The terms I searched in the historical journals were frequently used in entirely nonquantitative articles. Even worse, the use of “nineteenth century” and other period references in the social science journals yielded an unacceptable level of false positive results, as many articles briefly mentioned a historical theorist or event in passing before proceeding to an entirely nonhistorical analysis. I concluded that a credible assessment of the use of quantification for historical analysis would require a page-by-page search of journals to count and classify historical tables and graphs.
With much help from others I eventually compiled a serviceable set of indices of historical quantification.Footnote 1 These data show that there was not one, but rather three separate waves of historical quantification over the past 120 years. The first quantitative wave occurred as part of the “New History” that blossomed in the early twentieth century and disappeared during the Cold War with the rise of the consensus school of American history. The second wave thrived from the 1960s to the 1980s, during the ascendance of the New Economic History, the New Political History, and the New Social History; that wave died out during the cultural turn of the late twentieth century. The third wave of historical quantification—which I call the revival of quantification—emerged in the second decade of the twenty-first century and is still underway.
The pages that follow describe the three waves of historical quantification. To understand how the repeated rise and fall of quantification unfolded, I look at the shifting historiographical and institutional context of each period; examine the political and epistemological orientation of quantifiers of each period; and discuss the critique of quantification by historians of the 1960s through the 1990s. Finally, I briefly assess the frequency of quantitative history published in interdisciplinary journals and in the top journals of demography, economics, political science, and sociology.
The Older New History
The American Historical Review (AHR) published its first article on “The New History” in April 1898, just a little over two years after that journal was established (Dow Reference Dow1898). The article discussed Karl Lamprecht’s controversial Deutsche Geschichte, which was hailed as “the foundation of a social-statistical method of German history” (Winter Reference Winter1894: 196). Lamprecht felt that history should be analyzed by empirical and analytical methods analogous to those in the natural sciences, and that historians were too focused on political history and had neglected material circumstances. As the review article explained, “Statistics, in establishing the fact of connection between phenomena, lays the foundation for search after the deeper causes of these connections” (Dow Reference Dow1898: 438).
In 1904 Lamprecht visited the United States to speak at the Congress of Arts and Science held at the St. Louis World’s Fair. The Congress attracted leading historians from the United States and Europe, and the New History dominated the discussion. James Harvey Robinson, a Columbia University historian who had studied with Lamprecht in Leipzig, argued that
[t]he progress of history as a science must depend largely in the future as in the past upon the development of cognate sciences,—politics, comparative jurisprudence, political economy, anthropology, sociology, perhaps above all psychology. It is these sciences which have modified most fundamentally the content of history, freed it from the trammels of literature, and supplied scientific canons for the study of mankind. (Robinson Reference Robinson1906: 51)
In his own presentation the following day, Lamprecht echoed this theme, insisting that “we are at the turn in the stream, the parting of the ways in historical science” (Lamprecht Reference Lamprecht1905: 111). He explained that the old approach to history focused principally on politics and viewed individual heroes as the driving force of historical change. By contrast, the “new progressive” history was “sociopsychological” and focused on understanding conditions as the motive power of history.Footnote 2
In his 1912 book of essays on The New History, Robinson (1912: 24) predicted that history “will avail itself of all those discoveries that are being made about mankind by anthropologists, economists, psychologists, and sociologists.” Despite this emphasis on social science, the New History that emerged in the United States in the early twentieth century for the most part rejected the idea that history should be or could be purely objective. Echoing Turner’s (Reference Turner1891: 233) dictum that “each age writes history of the past anew with reference to the conditions uppermost in its own time,” Robinson insisted that historians should promote understanding of the present and provide guidance for the future.
The new historians of the early twentieth century often focused on the common man, and occasionally on women. In his 1922 volume on New Viewpoints in American History, Arthur Schlesinger Sr. discussed the workingman who “has not received a fair share of the enormous increase of wealth achieved largely through his own grinding labor” (Schlesinger Reference Schlesinger1922: 259). The same book has chapters on the “Influence of Immigration on American History” and on “The Role of Women in American history.” The latter topic was the chief focus of Mary Beard (Reference Beard1931, 1946), who argued forcefully for the centrality of women in history and the need to incorporate women into the mainstream of historical writing.
Most of the first wave of new historians were openly reformist and activist. Many of them embraced statistics and cross-fertilization with the social sciences, but most were also relativists, and felt that historical objectivity was impossible. The new historian who was the sharpest critic of objective scientific history was Carl Becker, a student of both Robinson and Turner. In his 1931 AHA presidential address, “Every Man a Historian,” Becker argued that history was a fictional reconstruction of the past. Becker especially argued that past “vanished events” are intrinsically unknowable. Anticipating the postmodern turn, Becker wrote that “the form and substance of historical facts, having a negotiable existence only in literary discourse, vary with the words employed to convey them” (Becker 1932: 233). Two years later, Charles Beard (1935) echoed Becker’s sentiment, arguing that the “noble dream” of scientific objectivity in history was just an illusion.
The new historians were initially insurgent, but they became establishment. Turner, Robinson, Beard, Schlesinger, and Becker all served as presidents of the American Historical Association (AHA), and the new historians were well represented in the editorial offices of the AHR.
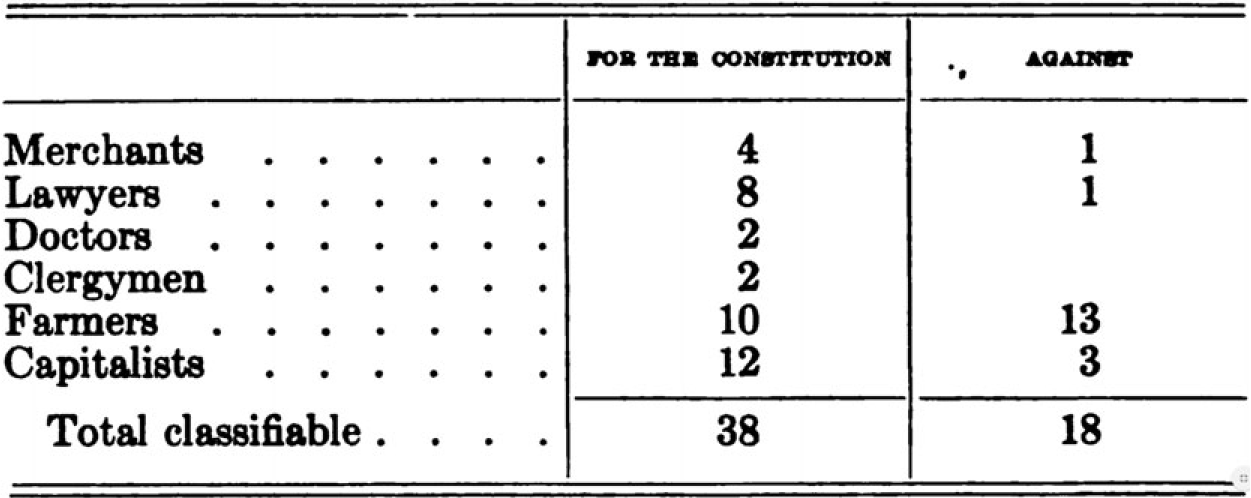
As the new historians turned away from narrative political history and started exploring materialist explanations, many of them turned to statistical evidence. As early as the 1890s, Turner and his student Orin G. Libby called for quantitative spatial analysis of congressional roll-call votes (Rowles and Martis Reference Rowles and Martis1984). The historical use of simple statistics increased dramatically in the early twentieth century, but few historical works included large numbers of tables and graphs. Beard’s landmark Economic Interpretation of the Constitution (1913) has numbers on almost every page, but only half a dozen simple tables, like the example shown in Figure 1.
Table from Charles A. Beard, Economic Interpretation of the Constitution, p. 280.

The comparatively small number of graphs and tables was partly a matter of cost. Tables were costly to typeset and were used frugally. Before the adoption of photocomposition and offset printing by scholarly journals beginning in the late 1960s, graphs were generally prohibitively expensive, requiring the preparation of engraved plates (Bromage and Williams Reference Bromage, Helen, Nash, Squires and Willison2019; Hargrave Reference Hargrave2013; Regazzi Reference Regazzi2015). Between its founding in 1895 and 1967, just one graph appeared in the pages of the AHR.
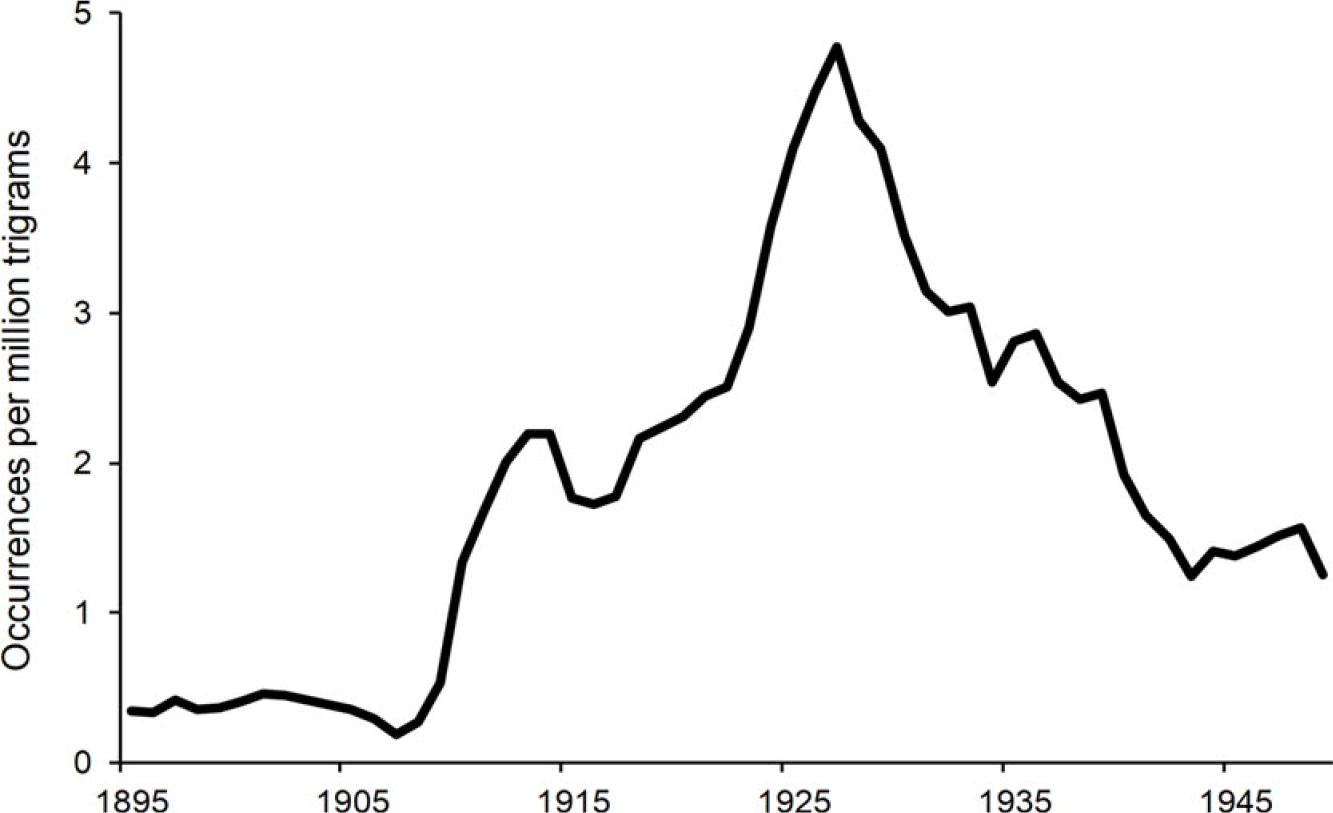
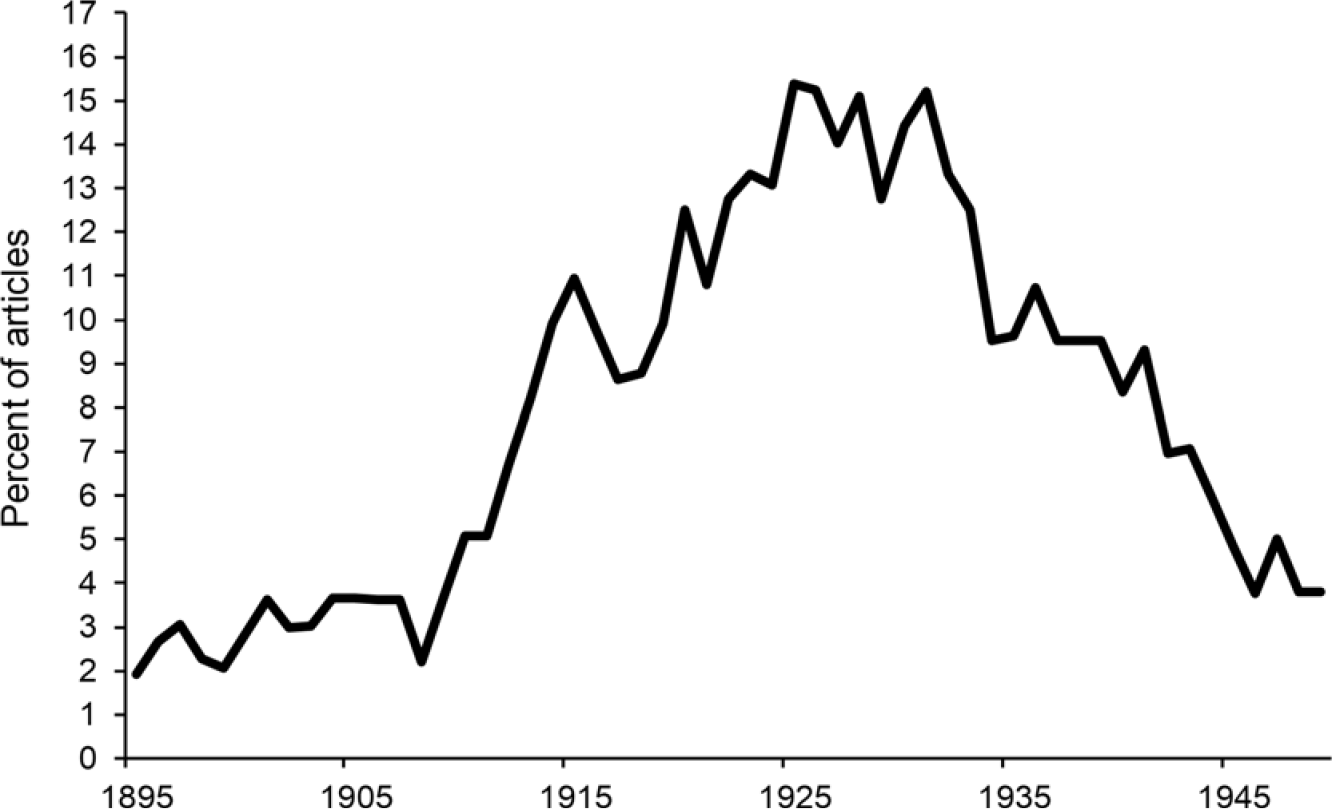
Despite these constraints, the advent of the New History coincided with a dramatic boom in the use of statistics by historians. Figure 2 shows the frequency of the three-word phrase “The New History” in books scanned by Google over the period from 1895 to 1949, expressed as number of occurrences per million trigrams (Michel et al. Reference Michel, Shen, Aiden, Veres, Gray, Brockman, Pickett, Hoiberg, Clancy, Norvig, Orwant, Pinker, Nowak and Aiden2010). Trigrams are just three-word combinations occurring in a large sample of the books scanned by Google. The phrase “The New History” took off rapidly after 1910, peaked in the mid-1920s, and gradually declined until the mid-1950s. Figure 3 shows the percentage of articles in the AHR with a statistical table over the same period. The rise of quantification was contemporaneous with the increase in references to “The New History,” and the two series peaked at virtually the same time.
Occurrence of the phrase “The New History” in Google Books, 1895–1949. Five-year moving average.

Percentage of articles in the AHR with a statistical table 1895–1949. Five-year moving average.

After 1940 the New History was toppled. The consensus historians of the postwar years didn’t like the relativism of Becker and the other New Historians, their leftist political slant, and their materialist explanations. The coming of World War II and the Cold War bolstered historians’ faith in their ability to uncover objective truth. Becker and especially Beard were excoriated by the prominent historians of the day (Novick Reference Novick1988). Instead, the Cold War consensus historians celebrated objectivity, patriotism, a narrative style, and a renewed focus on politics (e.g., Boorstin Reference Boorstin1953; Hartz Reference Hartz1955; Morison Reference Morison1951; Nevins Reference Nevins1954; Potter Reference Potter1954).
The end of the New History coincided with an end to the first wave of quantification in history; by the late 1940s, statistical tables in the AHR were as scarce as they had been at the turn of the century.
The Newer New Histories
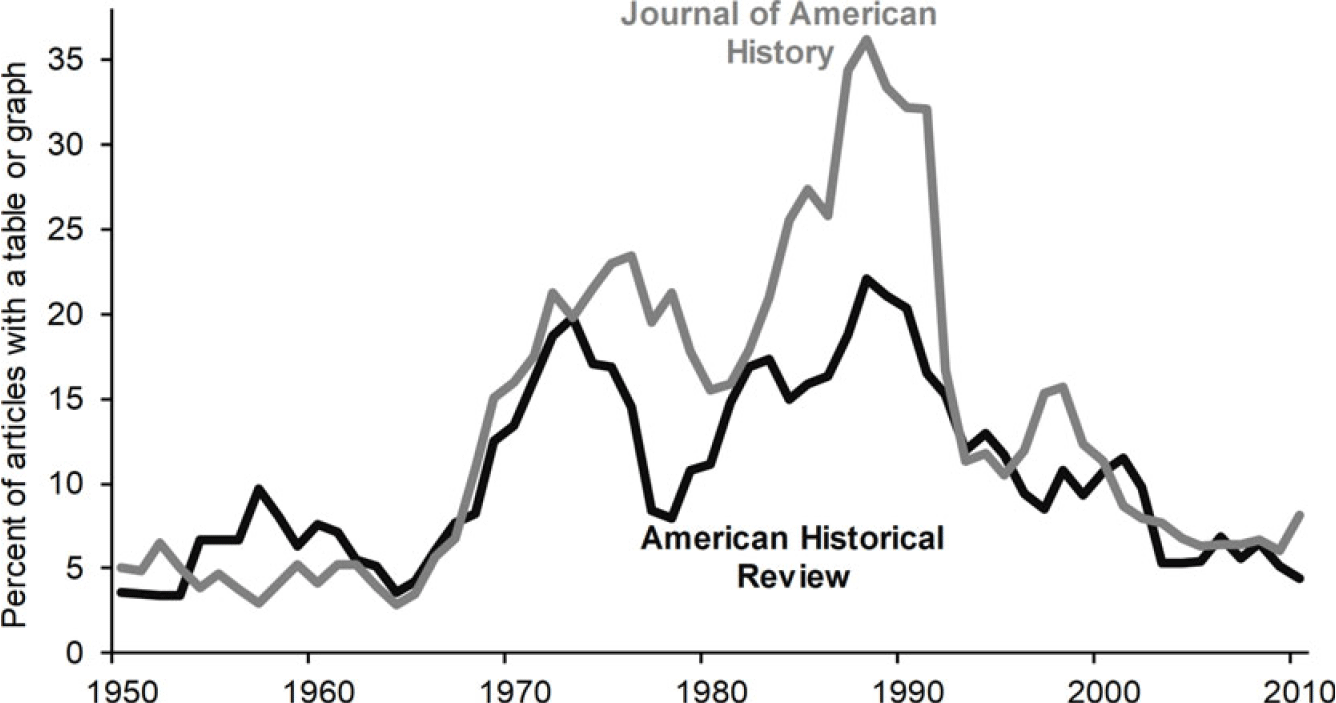
The first revival of quantification began in the second half of the 1960s. Figure 4 shows the percentage of articles in the flagship journals of the AHA and the Organization of American Historians that contained a statistical table or graph (including statistical maps) between 1950 and 2009. In both leading mainstream historical journals, the increase in quantification began in 1965, and accelerated until the early 1970s. The percentage of quantitative articles in the AHR dipped sharply between 1973 and 1978. According to Barbara Hanawalt, who was associate editor at the time, the then-editor Bob Quirk “told me flatly that the AHR, under his editorship, would never publish a quantitative history article … there really was that hostility [to quantitative history]”” (Bogue et al. Reference Bogue, William, Daniel Scott, Barbara, Graff, Moch and Philip2005: 67). Martin Ridge, the editor of the Journal of American History (JAH) from 1966 to 1977, was highly enthusiastic about quantification (Reynolds Reference Reynolds1998), and after his departure there was a dip in the use of tables and graphs. Both journals saw growth in quantification in the 1980s, particularly the JAH, and both journals reached a peak in the percentage of quantitative articles in 1988. In the 1990s, quantification dropped rapidly at both journals. This decline probably had more to do with declining submissions of quantitative articles than with antiquantitative policies of the editors.Footnote 3
Percentage of articles in the AHR and the JAH with a statistical table or graph, 1950–2009. Five-year moving average.

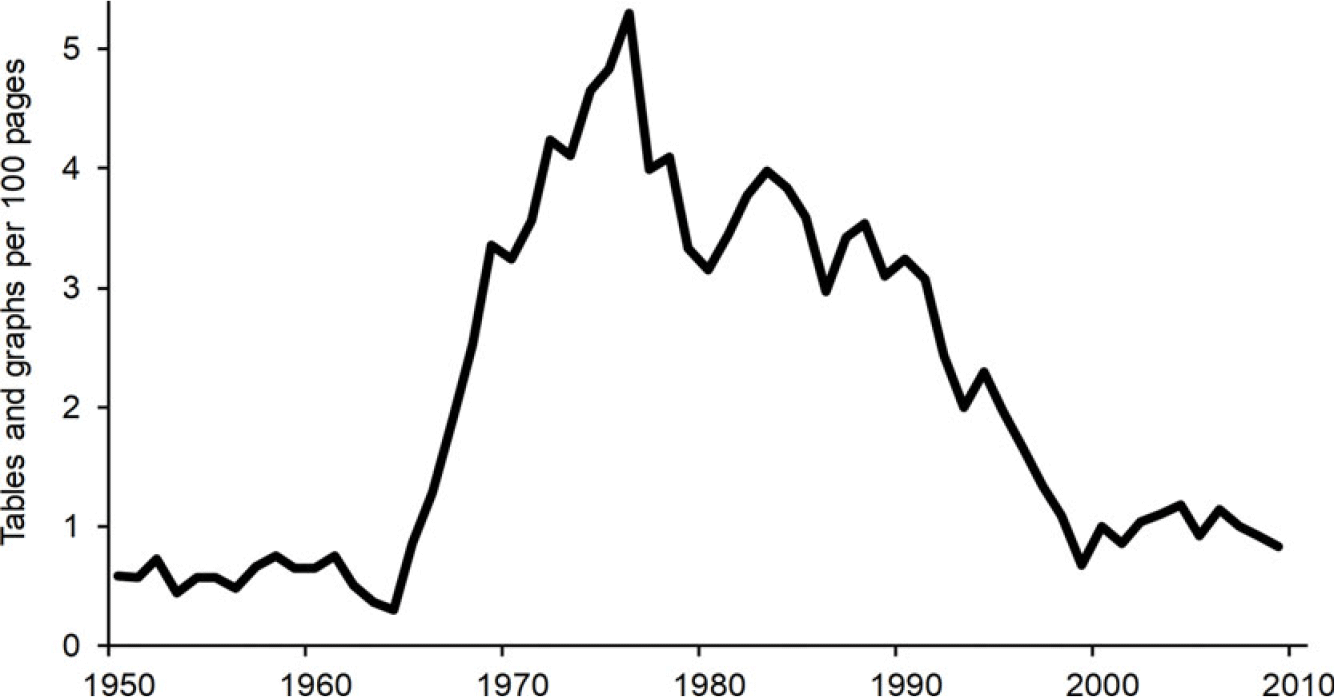
The timing of change is sensitive to the specific measure used. The percentage of articles with a table or graph is useful for assessing the breadth of adoption of quantitative analyses, but less useful for assessing its depth. As Kousser (Reference Kousser and Kammen1980: 437) expressed it, “[N]ot every quantitative article is equally quantitative.” Accordingly, Kousser advocated measuring the number of statistical tables and graphs per 100 pages of articles. In the 1970s, quantitative articles often included many tables, whereas in the 1980s quantification was more widespread but many articles included just one or two tables or graphs. Kousser’s measure is shown in Figure 5; it suggests that the number of graphs and tables per 100 pages peaked in 1976 rather than 1988.Footnote 4
Statistical tables and graphs per 100 pages of articles: AHR and JAH combined, 1950–2009. Five- year moving average.

What caused the second boom in historical statistics? Once again it was new history. This time, however, there were three distinct new histories: the New Economic History, the New Political History, and the New Social History.Footnote 5
The New Economic History
The first of the newer new histories was the New Economic History. The phrase “New Economic History” was coined by Douglas North in 1957 (Goldin Reference Goldin1995). At a joint conference held that year of the Economic History Association and the National Bureau of Economic Research, Conrad and Meyer (Reference Conrad and Meyer1957: 524) presented a paper calling for a more rigorous mathematical approach to economic history focused on application of “analytic tools of scientific inference.” North wrote that “[f]or the new economic historian, explanation entails the application of the principles of scientific explanation derived from the natural science” (North Reference North1977: 190). This is a very different vision from the new history of the progressive era; the new economic historians felt that their inquiries were objective and that their assumptions had no political content.
The phrase “New Economic History” began to show up in books in 1959 and took off rapidly after 1965 (Google 2020). At first, the new economic historians were a mix of economists and historians, but very early on the economists came to dominate (Coclanis and Carlton Reference Coclanis and David2001; Lamoreaux Reference Lamoreaux, Francesco and Pat2015). Goldin (Reference Goldin1995) argues that economic historians in history departments were driven out of the New Economic History in the 1960s by the increasingly technical orientation of the field. The new economic historians established a regular annual meeting at Purdue University beginning in 1960. These meetings were composed exclusively of economists and soon became known as the Cliometrics Conference (Lyons et al. Reference Lyons, Cain, Williamson, Cain and Williamson2008).
The New Political History
The second of the newer new histories was the New Political History, which first appeared in books scanned by Google in 1964 and took off rapidly thereafter (Google 2020). In terms of its topical focus, the New Political History was narrower than the other new histories of the era: It was mainly concerned with analysis of voting statistics and legislative roll calls. Although it never became as visible as the other new histories, the New Political History is a crucial part of the story because the new political historians built crucial institutions. Indeed, the Social Science History Association would not exist were it not for the institution-building of the new political historians.
The central figure in the development of the New Political History was Lee Benson, who in Reference Benson and Mirra1957 published a manifesto condemning the impressionistic analysis of American elections and calling for systematic quantitative analysis (Benson Reference Benson and Mirra1957). Benson denounced the traditional method of historical documentation as “proof by haphazard quotation” (Benson 1972: 220). He called the accumulated historical knowledge “bits of information,” many of them “of a degree of triviality stupefying to comprehend” (Ledger Reference Ledger2012). The goal of history was to discover “general laws of human behavior” (Benson 1972: 99). Benson explicitly rejected the subjective relativist perspective that characterized the older new historians. He nevertheless agreed with the progressive-era new historians on one point—he believed that historians should be political activists and insisted that “the whole point of studying history was to change the world for the better” (Zahavi Reference Zahavi2003: 360). Benson was therefore an objectivist like the New Economic Historians, but an activist leftist like the older new historians (Benson 1978; Zahavi Reference Zahavi2003).
Benson was committed to the development of a data bank in which quantitative historical data could be stored in machine readable form, freely available to all who wished to use it. This was a radical innovation at the time, when data was usually considered the highly protected property of the scholar who produced it. Benson convinced the AHA to establish a Committee on Quantitative Data. He then convinced the Institute for Social Research in Ann Arbor to establish a historical archive to create and disseminate data through the Inter-University Consortium for Political Research. In collaboration with Samuel Hays, Warren Miller, and other New Political Historians, Benson raised substantial grant funding to build data sets covering historical census tabulations and election returns (Bogue Reference Bogue1968, 1986, 1990).
After a fight with AHA leadership over grant money, Benson quit the Committee on Quantitative data, and in 1970 new political historian Allan Bogue took over. The AHA was growing increasingly disenchanted with the committee, and in 1971 voted to extend the committee for another three years with a reduced size, after which it presumably would terminate (AHA Reference American Historical1972). With the impending elimination of the AHA Committee on Quantitative Data, Bogue began discussing the idea of forming a new association that would provide a more congenial home for quantitative history. In 1974 Bogue, Benson and six other new political historians met in Ann Arbor to organize the Social Science History Association, or SSHA (Bogue 1987). Benson became the first president of the new association, and Bogue was the second.Footnote 6
The New Social History
Given Benson’s view that qualitative history was haphazard quotation and given that SSHA was established because the AHA planned to shut down its Committee on Quantitative Data, one might assume that the new association would be militantly quantitative. In fact, however, SSHA welcomed qualitative approaches from the outset. The reason for the acceptance of qualitative work was that from the very beginning most SSHA members came from the third kind of new history, the New Social History (Lees Reference Lees2016).
The New Social History blossomed later than the other two new histories; according to Google (2020), the phrase “New Social History” was extremely rare until 1970 and did not really take off until the second half of the 1970s. By the 1980s, however, the term “New Social History” was used far more commonly than either the New Economic History or the New Political History. The New Social History was more heterogeneous than the other new histories, and many new social historians did not use quantitative methods. Unlike the other new histories, there is no consensus on an origin story for the New Social History. Some point to the influence of the French Annalists or the British neo-Marxist social historians (Graff Reference Graff2001; Ross Reference Ross, Mohlo and Wood1998). My own view is that the American new social historians owed more to the new historians of the early twentieth century than they did to any European models.
Arguably the first new social historian was Merle Curti, who in Reference Curti1959 published a study of a Wisconsin frontier community (Curti Reference Curti1959). It is a nineteenth-century community study built around linked individual-level census records together with qualitative sources. Hundreds of new social history studies over the subsequent three decades followed precisely the same template. Curti used punch cards and IBM sorting machines to link individuals across four censuses, and the book includes almost 100 graphs and tables. Curti was able to do the analysis by enlisting the assistance of his wife Margaret Curti, a PhD social psychologist who was author of dozens of books and articles based on statistical analysis. The Curti’s look a great deal like the new historians of the early twentieth century. Merle Curti was a student of both Frederick Jackson Turner and Arthur Schlesinger Sr., and like many new historians of the earlier period, Margaret and Merle were socialist activists.
In terms of their political commitment, most new social historians of the 1960s and 1970s resembled the new historians of the early twentieth century. Stephan Thernstrom, the most widely read of the early new social historians, explicitly identified with the new left, and was described by Joan and Donald Scott (Reference Scott and Scott1967: 42) as a historian whose “radical sympathies raise radical questions.” Like the old new historians, most of the new social historians were politically engaged and activist. They were inspired by the political movements of the 1960s and 1970s: the civil rights movement, the antiwar movement, and above all the women’s liberation movement. As Vann (1976: 233) expressed it, the politics of the new social historians ranged from liberal to Marxist, “conservative social historians being no more numerous than Republican folk singers.”
The New Social History began with community studies of social and geographic mobility, but quickly spread to a wide assortment of other areas, including women’s history, family history, the history of childhood and old age, historical demography, urban history, and the history of education. If the new social historians had one common precept, it was a desire to write history “from the bottom up.”Footnote 7 Like the New History of the Progressive era, the New Social History was concerned with the experiences of common people, and especially with the history of workers, African Americans, immigrants, and women.
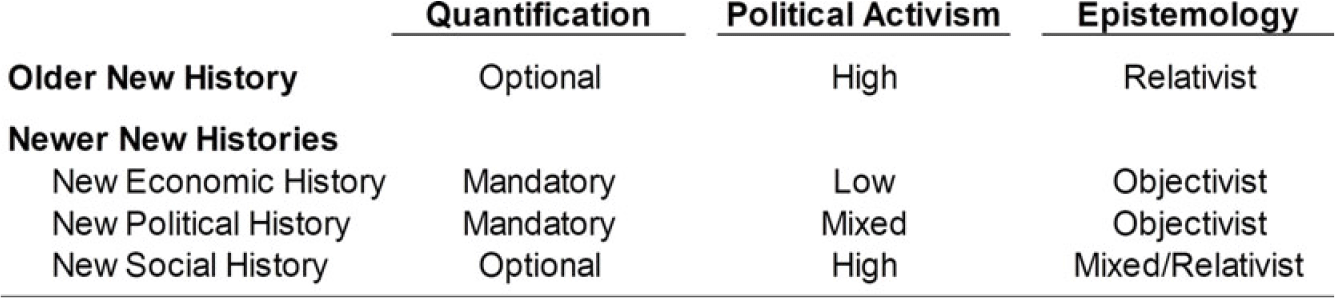
Figure 6 summarizes my characterization of the varieties of new history. The older New History of the early twentieth century used quantification within the practical limits of what was feasible at the time and was politically engaged and relativist. The New Economic History and the New Political History were defined by their use of quantification, and they were both highly objectivist. The new economic historians rarely acknowledged a political perspective or motive, but the new political historians sometimes did.
Characteristics of the new histories.

The New Social History generally looks much like the older New History. Like the older New History, the New Social History had many quantifiers, but quantification was not universal. And like the older New History, the New Social History was generally leftist and activist. The New Social History was heterogeneous with respect to the spectrum from relativist to objectivist. Most new social historians really didn’t care much about epistemology, but most rejected the positivism of the new economic historians. The broad similarities of the progressive-era New History and the New Social History are no coincidence: In many respects, the New Social History was a revival of the old New History of the early twentieth century.
Critiques of Quantification
Quantification in the top history journals began to decline rapidly after the 1980s. Between the peak of quantification in the 1980s and the low point around 2010, the percentage of articles with a table or graph fell 86 percent in the AHR and 83 percent in the JAH. Unlike the older new historians, the quantitative new historians of the 1960s through the 1980s failed to take over the establishment of the profession. As we have seen, in 1971, the AHA threatened to discontinue the Committee on Quantitative data (AHA Reference American Historical1972) and in 1975 the editor of the AHR vowed to never publish another quantitative article (Bogue et al. Reference Bogue, William, Daniel Scott, Barbara, Graff, Moch and Philip2005: 67).
There was a fierce reaction to quantification by prominent historians in the 1960s and 1970s. Responding to the earliest of the new political historians, Carl Bridenbaugh condemned the “Bitch-Goddess QUANTIFICATION” in his 1962 AHA presidential address (Bogue 1983; Bridenbaugh Reference Bridenbaugh1963).Footnote 8 In the same year, Arthur Schlesinger Jr., the son of the old new historian discussed earlier, opined that “[a]lmost all important questions are important precisely because they are not susceptible to quantitative answers” (Schlesinger Reference Schlesinger1962: 770). Jacques Barzun (Reference Barzun1974: 14) attacked “Quanto-History” and defended of traditional narrative history, complaining that that the new historians were attempting “to rescue Clio from pitiable maidenhood by artificial insemination.” The neoconservative Gertrude Himmelfarb (Reference Himmelfarb1975) objected to “Quanto-History” precisely because it was history from the bottom up. Himmelfarb maintained that the elites are the proper subject of history, and that the natural mode of historical writing is narrative. Oscar Handlin (Reference Handlin1979), a quantifier of sorts in the 1940s who became an archconservative his old age, also lambasted quantification, arguing that new left historians had perverted history by turning to the social sciences, quantification, and novelty.
The most influential criticism of the new histories and quantification came from Lawrence Stone’s (1979) article, “The Revival of Narrative: Reflections on a New Old History,” which has been cited more than 1,200 times. Stone was a reformed quantifier himself, and the “Revival of Narrative” was an indictment of quantification.Footnote 9 He argued that the quantifiers had failed, leading to “the end of the attempt to produce a coherent scientific explanation of the past” (19). He reserved his greatest contempt for the large-scale quantitative projects, in which “squads of diligent assistants assemble data, encode it, programme it, and pass it through the maw of the computer, all under the autocratic direction of a team-leader” (6).Footnote 10
In that passage Stone was specifically writing about Time on the Cross (Fogel and Engerman Reference Fogel and Engerman1974). Using the methods of the New Economic History, Fogel and Engerman argued that slavery was an efficient and profitable system—much more efficient than the agriculture of the North. They also maintained that the material conditions of slaves compared favorably to those of free industrial workers in the North, and that the treatment of slaves was much less harsh than depicted by traditional historians using outmoded qualitative techniques.
Critical reaction to Time on the Cross was immediate and fierce, both from traditional historians of slavery (e.g., Gutman Reference Gutman1975; Haskell Reference Haskell1974, 1975; Kolchin Reference Kolchin1975) and from economists (e.g., David and Temin Reference David and Temin1974; David et al. Reference David, Gutman, Richard, Peter and Gavin1976; Sutch Reference Sutch1975; Vedder Reference Vedder1975; Wright Reference Wright1975). Stone (1979: 6) noted that “the members of this priestly order [the quantifiers] disagree fiercely and publicly about the validity of each other’s findings.” If the quantifiers could not agree, Stone suggested, their methods were not worthy of serious consideration.Footnote 11
Stone did not explicitly mention the Philadelphia Social History Project (PSHP), but he had to have it in mind. PSHP was the largest quantitative historical research project ever undertaken, having garnered three million dollars (about $15.5 million in 2020 dollars) in funding between 1969 and 1981 to conduct a massive community study of Philadelphia (Kladstrup Reference Kladstrup2015). When the project ended with few tangible results, many historians (and funding agencies) became disillusioned with large-scale quantitative historical research.Footnote 12 Stone argued
It is just those projects that have been the most lavishly funded, the most ambitious in the assembly of vast quantities of data by armies of paid researchers, the most scientifically processed by the very latest in computer technology, the most mathematically sophisticated in presentation, which have so far turned out to be the most disappointing. Today, two decades and millions of dollars, pounds and francs later, there are only rather modest results to show for the expenditure of so much time, effort and money. (Stone 1979: 12)
According to Vann (Reference Vann1969: 64), the money raised by the quantifiers was largely responsible for the backlash against quantification. “Fear of, and animosity toward, quantitative history … arises from competition for resources for research. Since most quantitative projects are considerably more expensive than individual research efforts, the rhetoric in which they are described must possess the power to move foundations, and their projectors have seldom erred in excessive modesty.” Woodward (Reference Woodward1968: 32) wrote that “the mere mention of the word ‘computer’ in an application elevates the historian to scientific citizenship, makes him eligible for National Science Foundation grants, and quadruples his normal humanities-class stipend.” He elaborated on the threat of quantification: “It is mainly our young who need to be protected. I find among them a mood of incipient panic, a mounting fear of technological displacement, and a disposition among a few to rush into the camp of the zealots” (ibid.: 33).
Most of the criticism of quantification came from conservative defenders of traditional narrative history. Criticism from the left was rare, but there were some exceptions. Judt (Reference Judt1979), for example, argued that quantifiers “resort to quantified and quantifiable data to compensate for the lack of an argument and the glaring absence of conceptual insight … writing-by-numbers may lead to and flow from a complete epistemological bankruptcy” (75). Like Barzun and Himmelfarb, Judt thought the core problem with quantification is that it distracts from the true purpose of history, the political narrative; he insisted that “History is about politics” (68). Genovese and Fox-Genovese (Reference Genovese and Fox-Genovese1976) agreed that quantification obscures core political issues, and warned that the “weighting of variables, breathtaking margins of error, and assorted other inevitable atrocities should make historians wary” (212).
The decline of quantification may ultimately have less to do with the critiques from traditionalists of the right and left than with the emergence of another new history, the New Cultural History (Hunt 1989). The New Cultural History that emerged after 1980 had some key similarities to the old New History of the early twentieth century. A core idea of the New Cultural History—that the interpretation of historical texts is subjective and contingent on the viewpoint of the interpreter—was also a central argument of Becker and Beard (Novick Reference Novick1988). Like both the older new historians and the new social historians, many new cultural historians were politically engaged and activist. Notably, many of the most prominent new cultural historians of the 1980s and 1990s began their careers in the 1970s as quantitative new social historians (e.g., Hunt Reference Hunt1978; Scott Reference Scott1974; Sewell Reference Sewell1974).
A major difference between the New Cultural History and the previous new histories is that the new cultural historians did not quantify. For the most part, the new cultural historians did not explicitly criticize the use of quantitative analysis; there were virtually no vehement attacks on quantification like those that had come from the traditionalists. The prominent convert William Sewell continued to believe that “quantitative methods were an indispensable addition to the historian’s toolkit” (Sewell 2005: 78), but he also maintained that quantitative history is “redolent of precisely the bureaucratic corporate mentality that the counterculture of the 1960s found deeply objectionable” (Sewell 2008: 397).
As the cultural turn came to dominate US history departments in the 1990s and early 2000s, it squeezed out other approaches, including the new histories that had been ascendant from the 1960s through the 1980s. Most new cultural historians simply ignored quantification. Quantification lost relevance with the turn away from social science and materialist explanation. Some postmodern theorists were skeptical about empiricism and science more broadly.Footnote 13 In place of Tilly’s (Reference Tilly1989) Big Structures, Large Processes, Huge Comparisons, the new cultural historians substituted a focus on individual agency and microhistory. That meant diminishing interest in long-run change in the circumstances of population groups. As Herbert Klein recently expressed it, in North America cultural historians were “reluctant to relate individual experience to the larger world they inhabit” (Klein Reference Klein2018: 297).
Revival of Quantification
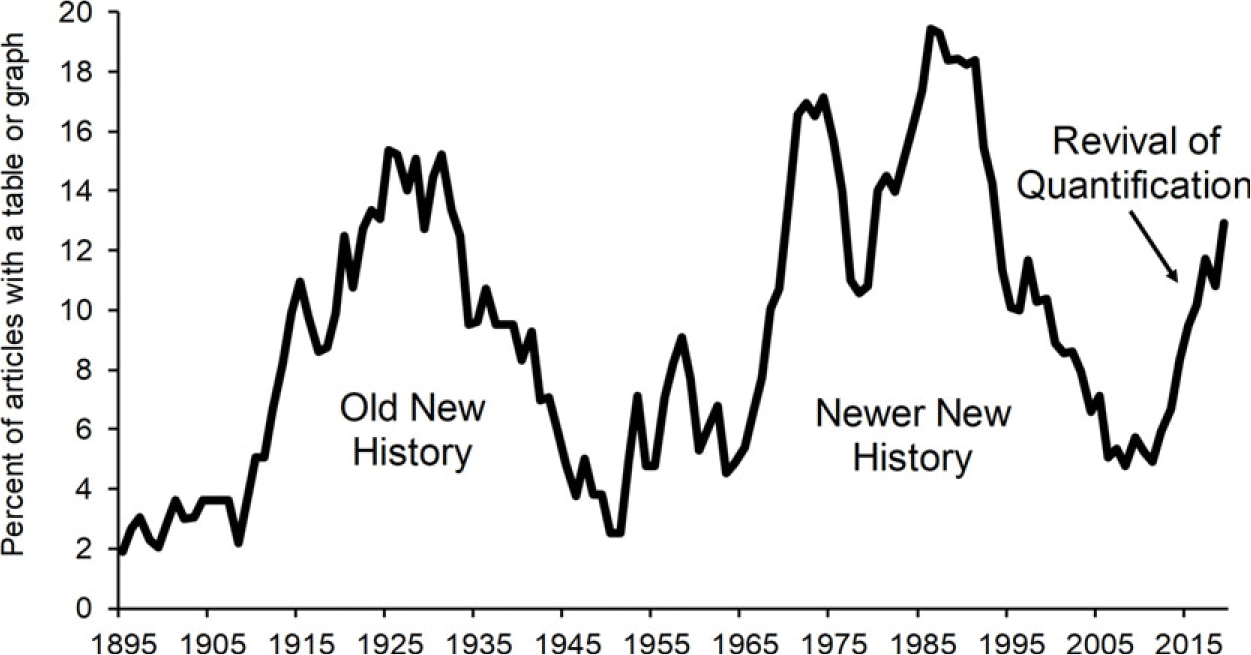
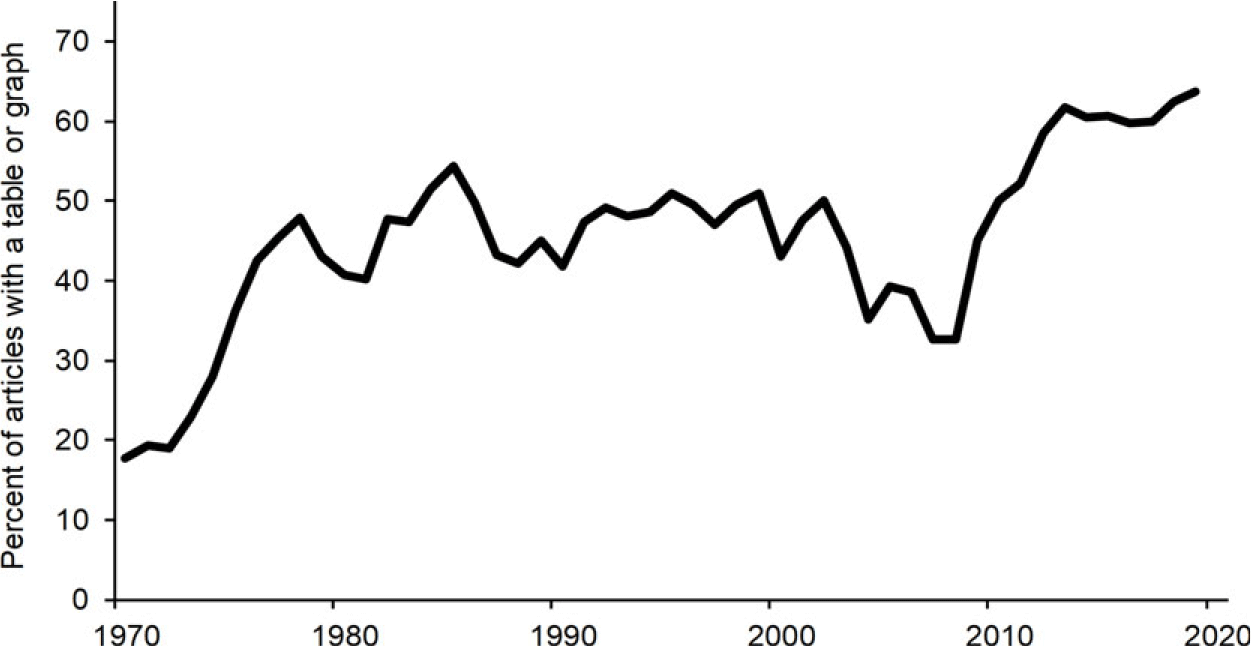
The cultural turn has turned, and there is a revival of quantification. Over the past decade the percentage of articles in mainstream historical journals that include a table or graph rose dramatically. Figure 7 shows the percentage of articles in the AHR that included a table or graph over the entire period from 1895 to 2020. Between the low point in 2011 and 2019, the frequency of tables and graphs in the AHR increased fourfold. The rebound was nearly identical at the JAH.
Percentage of articles in the AHR with a statistical table or graph, 1895–2019. Seven-year moving average.

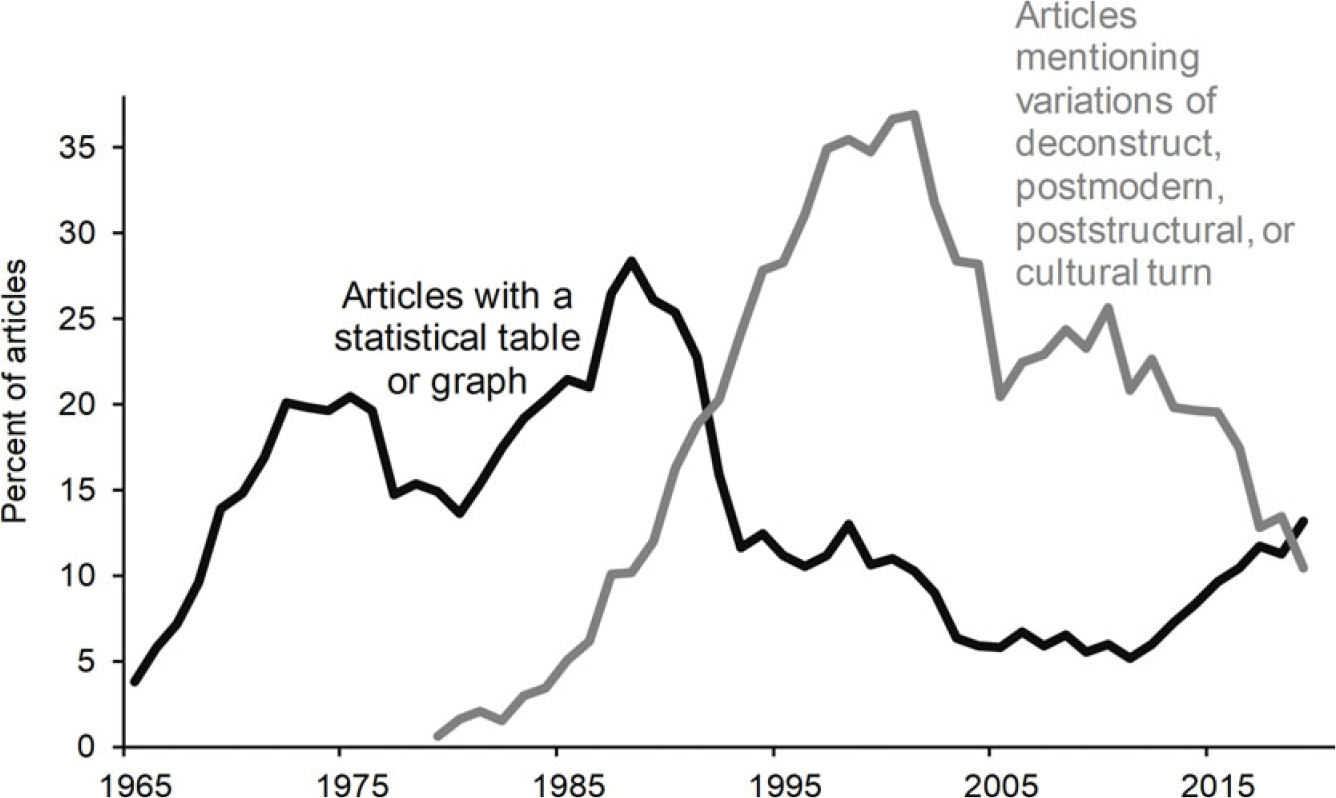
The rise of quantification in the top history journals over the past decade has coincided with a sharp decline of cultural history. Figure 8 compares the percentage of articles in the AHR or the JAH that have a table or graph with the percentage of articles in those journals using any of four key terms associated with the New Cultural History: deconstruct, postmodern, poststructural, or cultural turn. I conducted the analysis of terms by searching the JSTOR and Oxford Academic websites, and I used wildcards to accept variations in the terms such as “deconstruction” or “postmodernist.”
Percentage of articles in the AHR and JAH with a statistical table or graph, compared with the percentage using terms that are variations of “deconstruct,” “postmodern,” “poststructural,” or “cultural turn,” 1965–2019. Five-year moving average.

Growth in the use of terms associated with the New Cultural History coincided with the decline of quantification. The first use of the new vocabulary in the top two history journals occurred in 1979. By 1992 the number of articles with at least one of the four terms exceeded the number of articles that included a table or graph. The use of New Cultural History keywords peaked at 37 percent of articles in 2001, followed by a sharp decline; by 2019, just 10 percent of articles in the two journals used the cultural terms. By that time quantification had rebounded and 13 percent of articles included a table or graph.
Interdisciplinary History Journals
New journals dedicated to the new histories emerged in the 1960s. The Journal of Social History and Historical Methods Newsletter both started in 1967 and the Journal of Interdisciplinary History (JIH) began in 1970. As planning for the Social Science History Association was underway in 1973, Allan Bogue contacted the JIH editors to enquire if they would be interested in JIH becoming the official journal of the new organization. The JIH editors were highly enthusiastic and submitted a formal proposal to SSHA. The deal fell through because of objections from the publisher, however, and SSHA decided to establish its own new journal, Social Science History (SSH); the first issue appeared in 1976 (Bogue 1987).
Ruggles and Magnuson (2020) took an in-depth look at the history of quantitative history in the JIH. Figure 9 shows the percentage of articles with a table or graph in JIH from 1970 to 2019. JIH makes a useful case study for the history of quantification in history because for 50 years it had the same editors, the same publishers, and a consistent editorial philosophy. We found that most quantitative work in the 1970s and 1980s was produced by US-based historians. That source of submissions dried up after 1990, so JIH recruited more quantitative articles from the other social sciences—especially economics—and from historians based in Europe and Canada (ibid.). This allowed JIH to maintain a consistent percentage of quantitative articles from the later 1970s to the early 2000s, although there was a significant drop-off from 2003 to 2008. From 2008 to 2019, the percentage of quantitative articles in JIH doubled.
Percentage of articles in JIH with a statistical table or graph, 1970–2019. Five-year moving average.

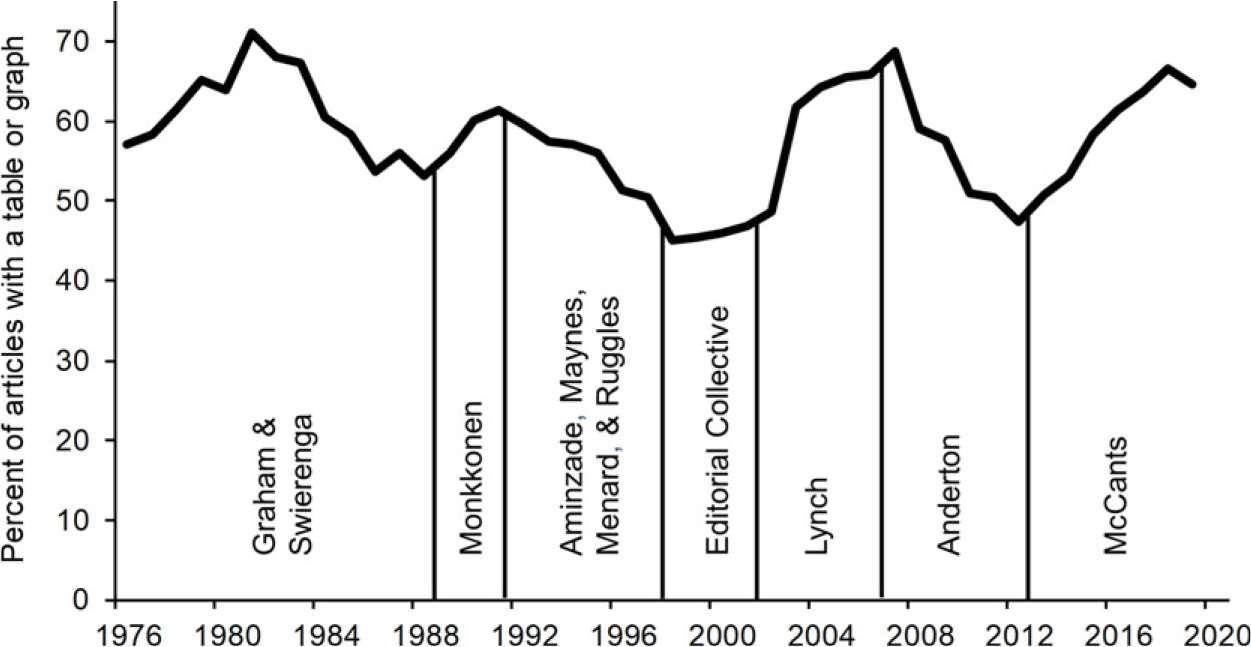
The frequency of quantitative articles in SSH is complicated by the frequent rotation of editors. Figure 10 shows the percentage of articles with a table or graph in SSH from 1976 to 2019, along with the terms of service of each editor. Under the first editors, James Q. Graham and Robert P. Swierenga, quantification increased until 1981, when 71 percent of articles included a table or graph, and then declined to a low point of 53 percent in 1988. The urban historian Eric Monkkonen then oversaw increasing quantification during his comparatively brief term as editor.
Percentage of articles in SSH with a statistical table or graph, 1970–2019, with the terms of editors. Five-year moving average.

In 1992, I became the junior member of a new team of four editors based at the University of Minnesota, which also included Ronald Aminzade, Mary Jo Maynes, and Russell Menard. Aminzade and Maynes were enthusiastic about the New Cultural History. Menard and I did our best to recruit quantitative work, but it was becoming more and more difficult. Many journals focusing on aspects of the new histories had been established in the 1970s and 1980s, and they were all competing for a shrinking supply of quantitative history. The editors of the Continuity and Change, Historical Methods, Journal of Family History, Journal of Urban History, as well as SSH prowled the corridors of the annual conference of the Social Science History Association, buttonholing the authors of promising papers. In the face of a declining supply, the frequency of quantitative work in SSH plummeted during our tenure as editors.
We were succeeded in late 1997 by a large and diverse editorial collective, and the percentage of quantitative articles stabilized.Footnote 14 Under the editorship of Katherine Lynch, fall 2001 to summer 2006, the percentage of quantitative articles rose 40 percent owing mainly to aggressive coordinated efforts by the Editorial Board to recruit papers at the annual SSHA meeting (Lynch Reference Lynch2020). That was followed by a nearly identical decline under her successor Douglas Anderton, who was editor through the end of 2012. Finally, under Anne McCants there was yet another boom of quantification at SSH in the 2010s.
Beyond the fluctuations resulting from the rotation of editors, there are broad similarities in the external pressures faced by JIH and SSH. Prior to the late 1990s, historians dominated as the main contributors to both journals, especially quantitative new social historians. At both journals, submissions from historians dried up in the late 1990s and early 2000s. Between 1997 and 2006, the number of SSH submissions from historians declined 80 percent even as the number of submissions from other disciplines rose (Beemer Reference Beemer2020). At both journals, the percentage of articles with tables or graphs has grown over the past decade, and this reflects both the revival of quantification among historians and a surge of historical research in other social sciences.
The “Historical Turn” in the Social Sciences
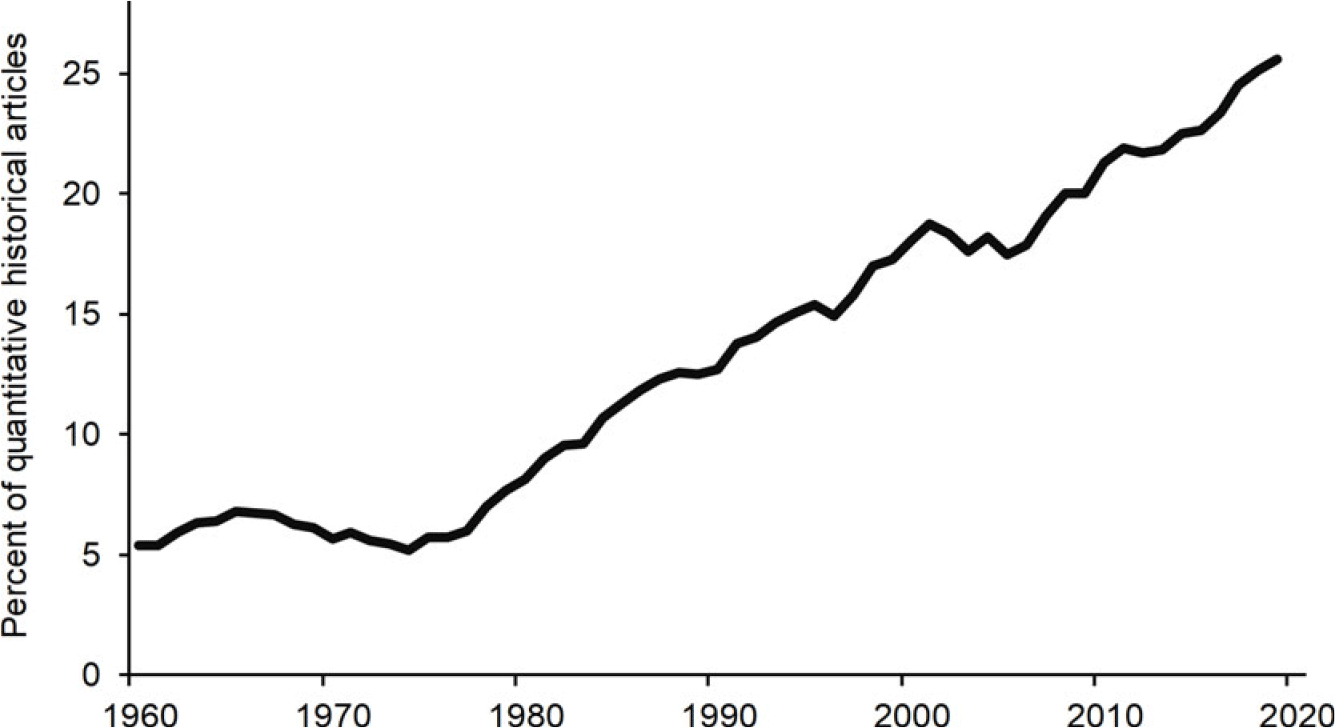
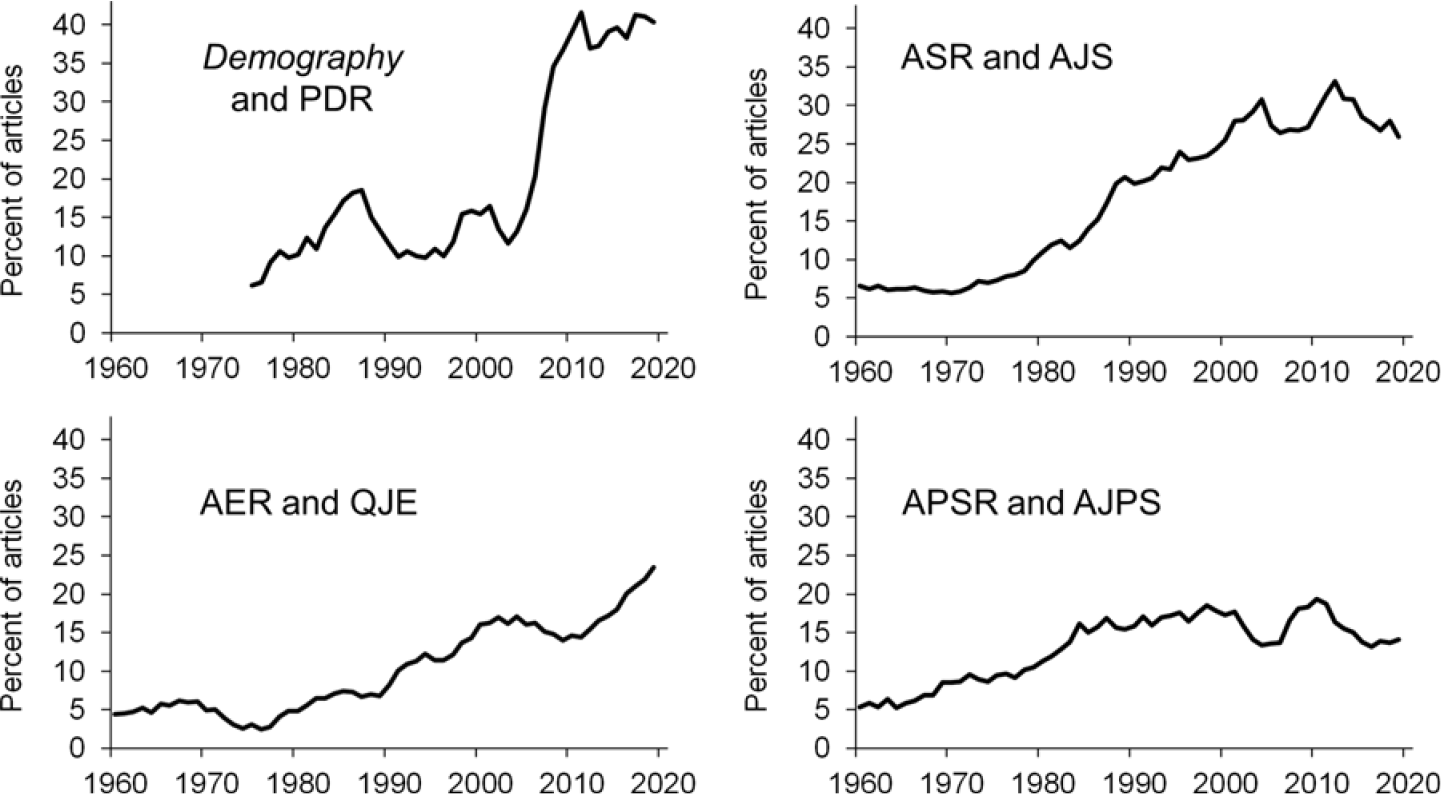
Klein (Reference Klein2018) argues that as historians turned away from quantitative history, other social sciences—especially demography, sociology, economics, and political science—increasingly turned to historical analysis. To assess this hypothesis, we compiled data from two leading journals in each discipline. These results appear for the combined set of eight journals in Figure 11, and for each discipline separately in Figure 12. We counted articles as quantitative and historical if they included tables or graphs based on data at least 30 years older than the publication date of the article. We then excluded articles in which the use of historical data was incidental, such as articles with a single descriptive historical table used solely to provide background for a current analysis.
Percentage of quantitative historical articles in the leading journals of demography, sociology, economics, and political science, 1960–2019. Five-year moving average.

Percentage of quantitative historical articles in the leading journals of demography, sociology, economics, and political science, 1960–2019. Five-year moving average.

Klein is correct. As shown in figure 11, the percentage of articles in the top social science journals that were both historical and quantitative increased fivefold between 1974 and 2019, and they now account for more than a quarter of published articles. The disciplines varied considerably in the timing and magnitude of change. In the two demographic journals we examined—Demography and the Population and Development Review—the increase was concentrated in the period from 2003 to 2011, at which point more than 40 percent of articles were historical. Most of the quantitative historical articles in this period capitalized on newly available historical data sources—especially IPUMS—so it is possible the jump in historical demographic work was stimulated by the availability of new data sources.
In the American Economic Review and the Quarterly Journal of Economics, just 2.5 percent of articles were quantitative and historical in 1974 when Time on the Cross appeared (Fogel and Engerman Reference Fogel and Engerman1974). By 1993, when Robert Fogel and Douglass North received the Nobel Prize in Economics for their work in economic history, 10 percent of the articles in these top journals were historical and quantitative. Economic history continued to grow over the past decade, and now represents almost a quarter of articles in the top journals.
The sociology journals American Sociological Review and American Journal of Sociology saw rapid growth in quantitative historical articles from the 1970s to the early 2000s, but the trend has since leveled off. Similarly, the American Political Science Review and the American Journal of Political Science had growth in quantitative historical research from the 1960s to the 1990s, but little change for the past several decades. Indeed, in both sociology and political science there has been a slight decline in the percentage of quantitative history articles over the past decade. This may result less from declining interest in history than from increasing interest in qualitative approaches.
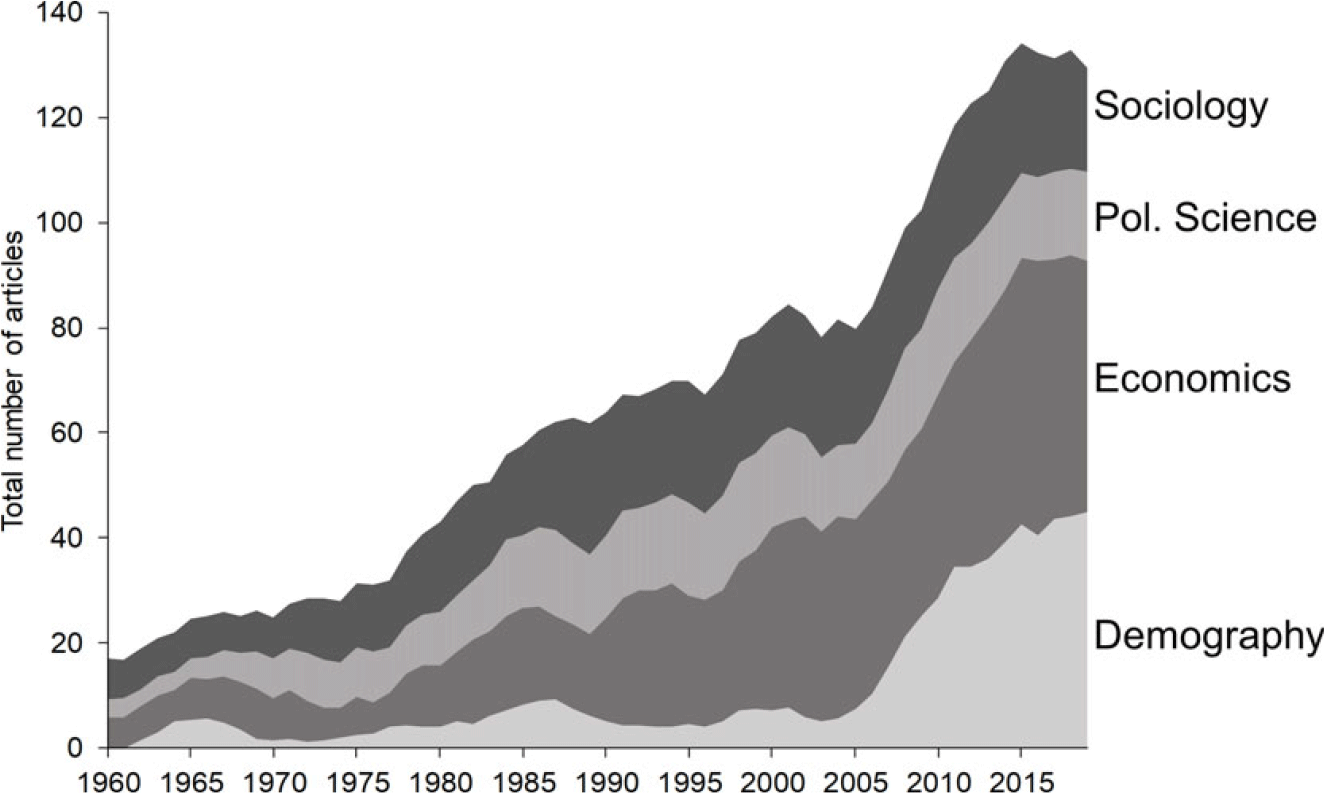
The measures used in figures 11 and 12 understate the absolute growth in quantitative historical research over the past six decades. There are now many more social science journals than there were in 1960; moreover, the size of the journals has grown. We can capture the latter effect by simply measuring the total number of quantitative historical articles published in these top eight social science journals. As shown in figure 13, just 17 quantitative historical articles were published in these top eight journals in 1960. That number has grown steadily and averaged 132 articles per year during the most recent five-year period. It is reasonable to conclude that far more quantitative history is being published today than in the heyday of the new histories from the 1960s to the 1980s.
Number of quantitative historical articles in the leading journals of demography, sociology, economics, and political science, 1960–2019. Five-year moving average.

Klein (Reference Klein2018: 311) argues that the “‘historical turn’ in the social sciences brought a fuller appreciation of the importance of historical understanding for answering basic questions.” Still, he sees the results as mixed, noting for example that much of the work of economists “shows a lack of serious historical context” and some historical studies in political science “make historical claims that show little depth” (304). The solution, he argues, is for historians to engage with social science and to collaborate with social scientists. The historical profession, Klein maintains, “needs to provide for, and tolerate, alternative approaches and to re-engage with the social sciences for its own sake as well for the sake of important debates outside its immediate purview. Otherwise, historians will find themselves less and less relevant and ever more isolated from the major issues facing the modern world. In that case, both history and the social sciences will suffer” (311–12).
Interdisciplinary collaboration is essential. Frederick Jackson Turner (1911: 232) wrote that “[t]he economist, the political scientist, the psychologist, the sociologist, the geographer, the students of literature, of art, of religion—all the allied laborers in the study of society—have contributions to make to the equipment of the historian.” Quantifying historians must team up with historical social scientists who can provide technical expertise and amplify our message. Social scientists also need historians because deep immersion in particular periods and places is indispensable for interpreting the context and meaning of historical data. As the primary venue for interaction of historians with other social scientists, the Social Science History Association is vital to such interdisciplinary collaboration.
Conclusion
The revival of quantification in history arrived without fanfare. There was no manifesto announcing yet another kind of new history. The new quantifiers do not have a distinct epistemological or political orientation; like most other historians, they tend to be relativist and leftist. A few are new social historians who returned to counting in old age after having abandoned it for a few decades (e.g., Katz et al. Reference Katz, Fader and Stern2005, 2007), but most do not appear to identify with any of the new histories. Unlike the new histories of the twentieth century, the revival of quantification has made no extravagant claims of novelty and transformative impact.
The revival of quantification in part reflects reduced barriers to quantitative analysis. The technological obstacles to quantitative analysis in the 1960s and 1970s were formidable. To digitize data and write programs analysts had to keypunch thousands of 80-column cards. Mainframe computers were expensive and cumbersome. Typically, investigators had to wait 24 hours after submitting a job to get results, or (more often) to discover their errors. Accordingly, even the simplest analyses required a great investment of time, money, and technical expertise. Data storage and processing costs have declined so dramatically—by a factor of 100 million or so over the past six decades—that they are no longer a significant consideration for all but the largest data analysis projects. As late as 1991 when IPUMS was established, the costs for data storage and processing were about 100,000 times higher than they are today. Today’s software is easier to use and more powerful, especially for visualizations; we can make graphs and maps without pen and ink. Analysts using modern statistical software can work interactively with instant turnaround, and there are abundant tools for data manipulation and curation.
There is also a wealth of new data. IPUMS has made freely available billions of cases of historical data from hundreds of censuses and surveys taken in more than 100 countries over the past 250 years. There are new historical longitudinal data sets from China, Europe, and the United States; administrative records from Norway and Sweden; and local historical censuses from across Europe. Historians can exploit vast new archives of historical GIS data from around the world, as well as climate data spanning hundreds of years. The next frontier is text: Virtually the entire contents of the world’s archives and libraries are being transformed into machine-readable form. We do not yet really know how to capitalize on the computerization of the entire historical record, but it is certain to involve counting at some level. Other social sciences are already exploiting all these sources; if historians do not get on board, we will become irrelevant (Jarausch and Coclanis Reference Jarausch2015; Ruggles 2012, 2014).
The revival of quantification among US historians has roots that are deeper than just technology and data; it also reflects a shift in the theoretical perspective and substantive focus of historians. Jan De Vries senses that “[o]ne can detect an undercurrent sucking historians back from narrative history, and from micro- and subjectivist histories, to a concern with coherent, causal explanation of societal change” (De Vries Reference De Vries2018: 330). With the fading of the cultural turn, empirical approaches are no longer in disrepute.
In the age of Trump, virtually all academics came to recognize the legitimacy of science, and the stigma of historical quantification has disappeared. In the face of climate change, globalization, surging inequality, and the rising electoral power of right-wing nationalists, the need for measurement is obvious. These crises are inherently historical, and they cannot be understood without quantification. We cannot even describe these critical transformations unless we measure them, nor can we assess their causes and implement solutions.
Historical interpretation provides indispensable perspective for understanding the present and guiding us into the future. Becker (1932: 234) wrote “The history that does work in the world, the history that influences the course of history, is living history … that enlarges and enriches the collective specious present.” It is no accident that the first and second waves of historical quantification were spawned in periods of leftist political activism: Their goal was to understand the conflicts of the present. Like the progressive-era new historians and the new social historians, we must make a usable history; the world needs it now more than ever.
Acknowledgments
My thanks for the generous feedback from many colleagues on my 2019 presentation at the Social Science History Association. In addition, Herbert Klein, Mary Jo Maynes, Diana Magnuson, Lisa Norling, and Michael Zuckerman provided invaluable ideas and suggestions. My thanks also for administrative assistance and facilities of the Minnesota Population Center, supported by NICHD P2C HD041023.