In the sandstone quarry of Saint-Aubin-des-Châteaux (Loire-Atlantique department, Armorican Massif, France), an Ordovician oolitic ironstone (Chauvel, Reference Chauvel1971 & Reference Bishop, Lane, Dyar and Brown1974) contains, together with ordinary green chlorite, a striking variety of ‘red chlorite’, observed in the past during petrographic studies (G. Cornen, pers. comm.), which was characterized later as an Mg-poor chamosite (Gloaguen et al., Reference Gloaguen, Branquet, Boulvais, Moëlo, Chauvel, Chiappero and Marcoux2007). Gloaguen et al. (Reference Gloaguen, Branquet, Boulvais, Moëlo, Chauvel, Chiappero and Marcoux2007) established various chamosite generations and provided an opportunity for their detailed chemical study. In addition, an optical study was performed on the red chamosite to interpret its location within the sequence of chamosite generations and the origin of its colour.
At Saint-Aubin-des-Châteaux, the oolitic ironstone was subjected to very-low-grade metamorphism (anchizone) and is mainly composed of siderite and chamosite, with abundant organic matter (vitrinite reflectance R = 3.9 ± 0.2%). Later, this ironstone was hydrothermally altered by early Variscan polyphase fluid flow (Gloaguen et al., Reference Gloaguen, Branquet, Boulvais, Moëlo, Chauvel, Chiappero and Marcoux2007; Tartèse et al., Reference Tartèse, Poujol, Gloaguen, Boulvais, Drost, Košler and Ntaflos2015) related to a 360 Ma mafic magmatism (Pochon et al., Reference Pochon, Gapais, Gloaguen, Gumiaux, Branquet, Cagnard and Martelet2016a, Reference Pochon, Poujol, Gloaguen, Branquet, Cagnard, Gumiaux and Gapais2016b). This fluid flow induced specific mineralizations (Pochon et al., Reference Pochon, Beaudoin, Branquet, Boulvais, Gloaguen and Gapais2017, Reference Pochon, Gloaguen, Branquet, Poujol, Ruffet and Boiron2018), including the Saint-Aubin-des-Châteaux sulfide ore (Pochon et al., Reference Pochon, Branquet, Gloaguen, Ruffet, Poujol and Boulvais2019). In this deposit, the oolitic ironstone was partly transformed into pyritized lenticular bodies and associated chlorite alteration haloes. It was followed by additional fracturing stages that trapped base metals (Pb, Zn, Cu, Sb and minor Au). This hydrothermal process led to a peculiar mineralogy, highlighted by the formation of lulzacite Sr2Fe2+(Fe2+, Mg)2Al4(PO4)4(OH)10 (type locality; Moëlo et al., Reference Moëlo, Lasnier, Palvadeau, Léone and Fontan2000), pretulite ScPO4 (Moëlo et al., Reference Moëlo, Lulzac, Rouer, Palvadeau, Gloaguen and Léone2002), tobelite ((NH4),K)Al2(Si3Al)O10(OH)2 (Mesto et al., Reference Mesto, Scordari, Lacalamita and Schingaro2012; Capitani et al., Reference Capitani, Schingaro, Lacalamita, Mesto and Scordari2016; Pochon et al., Reference Pochon, Branquet, Gloaguen, Ruffet, Poujol and Boulvais2019) and Sr-rich apatite with rare earth element (REE) phosphates (Moëlo et al., Reference Moëlo, Rouer and Bouhnik-Le Coz2008).
The hydrothermal process was controlled by three geochemical reactions:
1. Leaching of siderite by acid solutions, which were neutralized.
2. Sulfidation (pyritization) by combination of Fe from dissolved siderite with sulfur transported by the solution.
3. Redox processes: oxidation of partly dissolved organic matter with re-precipitation of minor graphite lamellae. Conversely, the hydrothermal solution was reduced.
As a whole, this process may be similar to the process of thermochemical sulfate reduction considered in the formation of Mississippi Valley-type lead–zinc ores (Leach et al., Reference Leach, Taylor, Fey, Diehl and Saltus2010).
There are several generations of chamosite in the Saint-Aubin deposit (Table 1) (Gloaguen et al., Reference Gloaguen, Branquet, Boulvais, Moëlo, Chauvel, Chiappero and Marcoux2007). Primary chamosite (green), the most abundant variety, is the main constituent, together with the siderite cement of primitive oolites in the sedimentary iron ore (ooidal ironstone), caused by diagenesis and low-grade metamorphism (Chauvel, Reference Chauvel1971, Reference Chauvel1974). Other chamosite generations (green and red) are related to stages 1–3 of the hydrothermal process in various ore facies (Table 1). The red chamosite is associated closely with the sulfide ore (stages 1 and 2). It has also been observed as isolated crystals disseminated in an apatite-rich sample, together with crystals of pretulite (ScPO4). Hydrothermal green chamosite has been observed in stage 1 (chlorite–pyrite facies; chlorite-rich reaction rim), stage 2 (lulzacite-bearing quartz–siderite veinlets; polymetallic quartz veins within sandstones) and stage 3 (tobelite–sulfosalt–gold quartz veins within sandstones).
Various generations of chamosite in Saint-Aubin-des-Châteaux.

According to Gloaguen et al. (Reference Gloaguen, Branquet, Boulvais, Moëlo, Chauvel, Chiappero and Marcoux2007), using chlorite as a geothermometer gives a formation temperature of ~290°C for metamorphic chamosite, followed by a T increase (~310–340°C) for stage 1, then T decreases for stage 2 (~300°C) and stage 3 (~275°C). Of particular interest is the late formation (stage 4) of berthierine, the 7 Å low-T dimorph of chamosite, also with an unusual brown colour (Moëlo et al., Reference Moëlo, Gloaguen, Lulzac and Le Roch2006), associated with quartz, minor kaolinite and Eu-enriched apatite (Moëlo et al., Reference Moëlo, Rouer and Bouhnik-Le Coz2008).
In the present study, the first section is devoted to the crystal chemical re-examination of the various chamosite generations, taking into account the first electron probe microanalyses (EPMAs) of Gloaguen et al. (Reference Gloaguen, Branquet, Boulvais, Moëlo, Chauvel, Chiappero and Marcoux2007), complemented by new EPMAs. The second section is focused on the spectroscopic study of red chamosite to characterize its absorption bands in the visible–near-infrared (Vis–NIR) range. In the third section, a comparison of these data and geochemical constraints provides useful indications on the evolution of the chamosite composition and on the origin of the red colour of chamosite. We propose that such a colour originates from a new intervalence charge-transfer (IVCT) mechanism involving minor vanadium together with the main iron.
Brief review of chlorite crystal chemistry
Chlorites are phyllosilicates with a 14 Å layer spacing, where a talc-like sheet VI(R 2+,R 3+)3IV(Si,R 3+)O10(OH)2 alternates with a brucite sheet VI(R 2+,R 3+)3(OH)6 (Brown & Bailey, Reference Brown and Bailey1962). The cation R 2+ is mainly Mg and Fe2+, and R 3+ is mainly Al and Fe3+. VIR and IVR correspond to octahedral and tetrahedral cations, respectively. Taking into account possible vacancies (□), their general structural formula is VI(R 2+6–y–zR 3+y□z)IV(Si4–xR 3+x)O10(OH)8 (Bailey, Reference Bailey, Brindley and Brown1980). For charges to be balanced, y = x + 2z.
Clinochlore is the Mg species containing mainly Mg2+ and Al3+, with the ideal formula (Mg5Al)(Si3Al)O10(OH)8 (no vacancy: purely trioctahedral). Chamosite is the Fe2+ endmember, with the ideal formula (Fe5Al)(Si3Al)O10(OH)8 proposed by Bayliss (Reference Bayliss1975). The crystal chemical classification of chlorites by Wiewióra & Weiss (Reference Wiewióra and Weiss1990) also takes into account the vacancy content as well as the Tschermak substitution rule VIR 2+ + IVSi4+ ↔ VIAl3+ + IVAl3+. Recently, Trincal & Lanari (Reference Trincal and Lanari2016) proposed a new substitution rule, correlating Fe3+ and vacancy: 3(Mg,Fe)2+ → 2Fe3+ + □.
Chlorites show six polytypic groups (Bailey, Reference Bailey and Bailey1988; Inoué & Kogure, Reference Inoué and Kogure2016), with various types of stacking disorder (Brindley, Reference Brindley, Brindley and Brown1980). Interstratification with other phyllosilicates, minerals of the serpentine group as well as smectite is common. In particular, interstratification between chamosite and berthierine is commonly observed (Jiang et al., Reference Jiang, Peacor and Slack1992; Inoué & Kogure, Reference Inoué and Kogure2016).
In the clinochlore–chamosite solid solution, the relationships between the chemistry and the unit cell are controlled by several factors:
1. A steric factor due to Fe substituting for Mg: the increase of IVAl3+ with that of the Fe:(Fe + Mg) ratio obeys steric constraints (Shau & Peacor, Reference Shau and Peacor1992). The expansion of the octahedral sheets due to the Fe-for-Mg substitution induces an expansion of the tetrahedral sheets obtained through the Al3+-for-Si4+ substitution.
2. Charge balance: this second substitution corresponds to a charge deficit, which ought to be compensated by a charge increase in the octahedral sheet, according to the Al3+-for-Me 2+ substitution. This retroactive effect reduces the expansion of the octahedral sheet: for one Al atom substituting one Si atom among four tetrahedral positions, one Al atom substitutes one Me 2+ among six octahedral positions. This Tschermak substitution explains the abnormal slight c decrease with increasing Fe:(Fe + Mg) ratio (Hey, Reference Hey1954; McOnie et al., Reference McOnie, Fawcett and James1975).
3. Phase equilibrium: at constant Fe:(Fe + Mg) ratio, the Tschermak substitution may also operate for a second time according to the Al:Si ratio of the system. An SiO2 excess will impose a low IVAl, whereas an SiO2 deficit will result in a high IVAl, as is documented in Saint-Aubin.
4. Vacancies in the octahedral sheets, according to the dioctahedral substitution 3Me 2+ → 2Me 3+ + □, will induce a contraction of these sheets, and thus counterbalance the expansion due to Fe/Mg substitution.
In the present study, two stoichiometric compositions (Mg and vacancy free) have been taken as references for discussing the chamosite crystal chemistry: the first being Al poor, (Fe5Al)(Si3Al)O10(OH)8, frequently encountered in mineralogical databases, and the second being Al rich, (Fe4Al2)(Si2Al2)O10(OH)8.
Materials and analytical methods
Polished thin sections and polished sections for microscopic study, EPMA and optical study were prepared from selected chamosite-bearing samples. Additionally, isolated single crystals of red chamosite were extracted from an apatite-rich sample for X-ray examination. Samples were first observed under a binocular loupe and through a polarizing microscope (in transmitted and reflected light) to select chamosite varieties and to determine their mineral associations (Table 1).
Electron probe microanalysis
All EPMA data were obtained at the BRGM-CNRS-University common laboratory (Orléans), with a CAMECA SX50 apparatus with a voltage of 15 kV and a beam current of 12 nA. Analysed elements were (all with Kα emission lines; standards indicated in parentheses): Fe (Fe2O3), Mn (Mn2O3), Mg (olivine), Al (albite), V (vanadinite), Si (albite) and Ti (MnTiO3). Minor elements (≤0.1 wt.% oxide) detected by Gloaguen et al. (Reference Gloaguen, Branquet, Boulvais, Moëlo, Chauvel, Chiappero and Marcoux2007) but not essential in the crystal chemistry of chlorite (i.e. Ca, Ba, Zn, Cu, K, Na, F, Cl) have been omitted. H2O content (wt.%) has been added on the basis of 4 H2O for 14 O of the oxide total to fit the O10(OH)8 ratio of the structural formula.
X-ray diffraction study
The dissemination of red chamosite in the sulfide ore precluded obtaining a precise X-ray diffraction (XRD) trace, which would establish its polytype and thus detect possible interstratification with berthierine, as is commonly observed in chamosite from hydrothermal ores (Inoué & Kogure, Reference Inoué and Kogure2016). Nevertheless, dissolution in hydrochloric acid of abundant apatite in a pretulite-bearing sample made it possible to extract single crystals of red chamosite. One crystal was mounted on a glass capillary for a single-crystal XRD study with STOE-IPDS diffractometer (Image Plate Diffraction System) using Mo-Kα radiation (operator: A. Meerschaut, Institut des Matériaux de Nantes).
Optical microscopy study
The optical microscopy study was focused on pure red chamosite, without the neighbouring green variety. Thin sections containing red chamosite crystals were investigated with visible light (410–760 nm). Transmitted spectra have been acquired using a LEICA DMR polarizing microscope equipped with a MPV-SP microphotometer. The bandwidth of the monochromator was Δλ = 2 nm. Computation of colour values and their representation in a chromaticity diagram were performed according to the protocol detailed by Criddle (Reference Criddle, Jambor and Vaughan1990, and references therein), taking illuminant C source (‘average daylight’ – colour temperature 6774 K) of the Commission Internationale de l'Eclairage (CIE) as the standard for white colour.
The absorption spectra in the Vis–NIR range (340–2500 nm; i.e. 29 400–4000 cm–1) have been acquired in transmitted light on the same thin sections (standard thickness of 30 μm). A Varian Cary 5000 double-beam absorption spectrophotometer was used with a sampling interval of 1 nm and a 1 nm spectral bandwidth. The sample measured was a thin section of a red chamosite lamella with the polarization direction parallel or perpendicular to the elongation of the lamella. The glass and glue support were compensated by a similar setup on the reference beam: a standard glass slab for lithographic thin section, as was used for the sample, was covered on a region larger than the UV–Vis beam section with the same glue. This was then turned into a very thin bevel to offer all possible equivalents of glue thickness, and then the position of the bevel in the beam was adjusted to compensate for a potential small glue contribution, which is rare.
Results
Electron probe microanalyses
Table 2 shows the EPMA data as wt.% oxides with divalent Fe and Mn and trivalent V according to the strongly reducing conditions indicated by the abundance of organic matter in the primitive oolitic iron ore and the presence of ammonium–mica (tobelite). Table 3 indicates the structural formulae on the basis of O10(OH)8 as the anionic counterpart.
Electron probe microanalysis of various chamosite generations from Saint-Aubin in terms of wt.% oxides.

a First set of analyses (Gloaguen et al., Reference Gloaguen, Branquet, Boulvais, Moëlo, Chauvel, Chiappero and Marcoux2007).
b Late berthierine (for comparison).
Electron probe microanalysis of various chamosite generations from Saint-Aubin in terms of cation contents per O10(OH)8.

Ti not included.
a Late berthierine (for comparison).
ΣMe = cation sum; IVAl = on the basis of IVAl + IVSi = 4; Fe rat. = Fe:(Fe + Mg) ratio; Vac. = vacancy.
Main components
Figure 1a represents analyses as IVAl vs Fe:(Fe + Mg) ratios. As indicated first by Chauvel (Reference Chauvel1971) and further demonstrated by Gloaguen et al. (Reference Gloaguen, Branquet, Boulvais, Moëlo, Chauvel, Chiappero and Marcoux2007), Fe largely predominates over Mg (Fe:Mg >12) in Saint-Aubin chlorites. The majority of analyses are restricted to an Fe:(Fe + Mg) ratio close to 0.946 (±0.006). By contrast, there is significant variation of IVAl (i.e. of the Tschermak substitution rule) from 1.41 up to 1.80 atoms per O10(OH)8.
Analyses of chamosite varieties from Saint-Aubin according to Tables 2 & 3: (a) IVAl vs Fe:(Fe + Mg) atom diagram; (b) Si vs Me 2+ atom diagram (Wiewióra & Weiss, Reference Wiewióra and Weiss1990). Dashed line in (a) is the regression curve for metamorphic chlorites (Zane et al., Reference Zane, Sassi and Guidotti1998). Red squares: orange-red chamosite; green diamonds: oolitic and hydrothermal green chamosite; yellow triangle: associated berthierine (B – No. 17). Si and Me 2+ refer to the cation number per O10(OH)8. Me 2+ = Mg2+ + Fe2+.

Vacancies
Table 3 shows a small number of vacancies of between 0.005 and 0.170 octahedral sites per O10(OH)8. Figure 1b represents the projection of chamosite compositions on the diagram Si vs Me 2+ according to Wiewióra & Weiss (Reference Wiewióra and Weiss1990), as used by Hillier & Velde (Reference Hillier and Velde1991). This diagram visualizes the vacancy concentration.
Trivalent Fe
Fe3+ may significantly substitute for VIAl3+, such as in ‘orthochamosite’ (Novak et al., Reference Novak, Velensky, Losert, Kupka and Valcha1959), with ideal composition ((Fe2+,Mg,Fe3+)5Al)(Si3Al)O10(OH,O)8. Nevertheless, the EPMA did not reveal minor Fe3+ in chamosite from Saint-Aubin.
Distribution of minor transition metals
Together with major iron, V, Mn and Ti are the three transition metals detected as minor constituents (Tables 2 & 3). Zn and Cu, rarely detected by Gloaguen et al. (Reference Gloaguen, Branquet, Boulvais, Moëlo, Chauvel, Chiappero and Marcoux2007) (maxima 0.12 and 0.04 wt.% oxide, respectively) in chamosite from stage 1, may correspond to sulfide contamination. The Ti content is always very low (≤0.03 wt.% oxide) and that of Mn is slightly higher (0.06–0.29 wt.% oxide).
By contrast, the vanadium content is more heterogeneous (Gloaguen et al., Reference Gloaguen, Branquet, Boulvais, Moëlo, Chauvel, Chiappero and Marcoux2007) and may reach >1 wt.% oxide. Vanadium zoning can be observed. For instance, the centre of a lamella of red chamosite (No. 10, Table 2) is enriched with V and Al relative to the rim (No. 11, Table 2). Correlatively, Mn and Ti, both with very small contents (Table 2), increase slightly.
Late brown berthierine, formed at low temperatures at the expense of lulzacite (0.64 wt.% V2O5; Moëlo et al., Reference Moëlo, Lasnier, Palvadeau, Léone and Fontan2000), also contains minor V (0.46 wt.% V2O3; Table 2). Mn and Ti are negligible. In equilibrium with kaolinite and quartz, berthierine has the Al-poor composition (Fe3.90Mg0.24□0.15Al1.67V0.04)(Si2.56Al1.44)O10(OH)8, which is very close to that of late green chamosite No. 16 (Table 3).
Crystallography
The single-crystal XRD analysis of red chamosite (No. 5, Tables 2 & 3) yielded a monoclinic unit cell, space group C2/m, with a = 5.375(1), b = 9.322(2), c = 14.177(3) Å, β = 97.43(3)° and V = 704.4 Å3. The structural formula of chamosite is Fe3.68Mg0.30Mn0.01□0.11Al1.83V0.08)(Si2.30Al1.70)O10(OH)8 (Tables 2 & 3). This formula most closely corresponds to polytype IIb, the most common chlorite polytype (Brown & Bailey, Reference Brown and Bailey1962). Thus, although the relatively poor quality of the XRD trace was not suitable for detailed crystal structure investigation, it is safe to assume a IIb polytype for the red chamosite.
Optical study of red chamosite
Visible transmission spectra
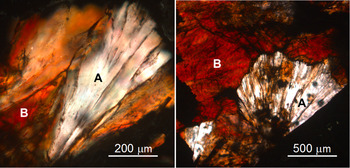
Under the binocular loupe, submillimetric individual crystals of red chamosite present a brown colour. In thin section, red chamosite observed under the microscope with polarized light shows a very strong pleochroism, from near-white to deep orange-red (Fig. 2). This pleochroism is of the normal type (Richardson & Richardson, Reference Richardson and Richardson1982); in other words, the selective absorption giving the strong colouring is maximal when the polarization plane is parallel to the elongation of the chamosite lamella (E || (001)).
Two examples of pleochroism of red chamosite (thin section, uncrossed polars). White elongated areas (A type): polar sub-perpendicular to (001); dark orange-red areas (B type): polar sub-parallel to (001). Dark zones: pyrite.

Figure 3 presents the two visible transmittance spectra obtained with the polarization plane perpendicular (A, blue line) or parallel (B, red line) to the lamella plane, respectively. In A (E ⊥ (001)), the transmittance is highest in the middle of the spectrum (560–620 nm), with a regular decrease down to ~50% at the two ends of the spectrum. Conversely, in B (E || (001)), no transmittance is observed from 420 to 540 nm; a weak transmittance window (~40%) is centred near 700 nm. These data show the very strong absorption for E || (001).
Visible transmittance spectra of red chamosite using a polarizing microscope (thin section). A spectrum (blue-spot curve): E ⊥ (001), white; B spectrum (red-spot curve): E || (001), dominantly red.

In the chromaticity diagram (Fig. 4), the chromaticity coordinates of the A and B spectra are x C = 0.34, y C = 0.36 and x C = 0.63, y C = 0.33, respectively. Point A, close to the CIE illuminant C (white daylight), corresponds to a pale yellow hue (dominant wavelength λD = 572 nm; excitation purity P e ≈ 15%), while point B corresponds to a saturated orange-red hue (λD = 610 nm; P e ≈ 90%).
Representation of pleochroism colours of red chamosite in the CIE chromaticity diagram. C = white colour (‘average daylight’ illuminant). Horseshoe-shaped line: spectrum locus (pure colours of the visible spectrum). Segment from violet to red: line of purple colours. A: E ⊥ (001); B: E || (001).

Vis–NIR absorbance spectra
The two preceding transmitted-light spectra correspond to the left half of Part I of Fig. 5, which presents the two Vis–NIR absorbance spectra of red chamosite: A (blue ‘perpendicular’; E ⊥ (001)) and B (red ‘parallel’; E || (001)). All well-defined absorption bands as well as some possible minor ones have been indexed, and these are listed in Table 4. These Vis–NIR spectra can be divided in to two regions:
1. Region I (from 340 to 1350 nm) is dominated by electronic transitions. In A, it shows a strong complex absorption band between 650 and 1350 nm, together with a continuum rising towards the UV range. The complex band is the sum of a main band at ~915 nm, with a second band at ~1100 nm. The continuum shows possibly very weak bands at ~460, 605 and 645 nm. In B, the two main components of the complex band are centred at ~895 and ~1110 nm, with a weak band on its left flank at ~710 nm. At <650 nm, a broad (Δν1/2 ≈ 3700 cm–1; graphic estimation) and strong absorption band centred at ~550 nm (~18 200 cm–1) superimposed on the sloping continuum is observed, causing the absorption of the green colour. This corresponds to the loss of transmittance observed in spectrum B of Fig. 3.
2. Region II (from 1350 to 2500 nm) is very similar in terms of the A and B spectra. It shows weaker absorption bands, dominated by vibrational transitions, with two sub-regions:
i. A small sharp band at 1415 nm, followed by three ill-defined broad bands at 1580, 1720 and ~1770 nm.
ii. At wavelengths over 1850 nm, a complex band composed of (at least) three distinct bands at ~2268, 2320 and 2370 nm, preceded by two small bands at ~2020 and 2180 nm.
Vis–NIR absorption spectrum of red chamosite (thin section, transmitted light). Blue line: E ⊥ (001); red line: E || (001). Blue and red arrows refer to specific band characteristics of the blue and red spectra, respectively; black arrows in part II indicate common absorption bands. a.u. = absorbance unit.

Absorption bands in the Vis–NIR absorbance spectra of red chamosite.

A = E ⊥ (001); B = E || (001).
Intensity scale (I): VS = very strong; S = strong; m = medium; w = weak; vw = very weak; ? = doubtful.
Width scale (W): L = large; m = medium; f = fine.
Discussion
Geochemical evolution of chamosite at Saint-Aubin-des-Châteaux
According to the paragenetic sequence (Table 1) and EPMA data (Fig. 1a), the smallest values of IVAl correspond to chamosite associated with quartz, such as in sandstone (No. 15 and No. 16) or in lulzacite-bearing veinlets (No. 13). Conversely, IVAl-rich chamosite (green and red, analyses No. 2–11) is related to the beginning of the hydrothermal process (stages 1 and 2), with a strong contribution of the hydrothermal fluids, which would indicate the greatest leaching of SiO2 relative to Al2O3. In addition, the calculated structural formulae are closer to stoichiometric (Fe4Al2)(Si2Al2)O10(OH)8 than to the classic chamosite structural formula (Fe5Al)(Si3Al)O10(OH)8, with the Al-poorest compositions (analyses No. 14–16; Table 3) close to the middle of the solid solution (i.e. approximately (Fe4.5Al1.5)(Si2.5Al1.5)O10(OH)8). The average composition of red chamosite has Fe:(Fe + Mg) = 0.943 (±0.013) and IVAl = 1.673 (±0.035).
The first chamosite sample from Saint-Aubin analysed by Chauvel (Reference Chauvel1971) was extracted from the primitive oolitic ore. The analysis yielded a similar Fe:(Fe + Mg) ratio (0.946), but a lower Al content (IVAl = 1.33). Such an Al deficit may be due to minor quartz admixture in the sample selected for wet chemical analysis.
The variation of vanadium content is related to the evolution of the ore deposit established by Gloaguen et al. (Reference Gloaguen, Branquet, Boulvais, Moëlo, Chauvel, Chiappero and Marcoux2007):
1. Primitive green chamosite has a low V2O3 content (0.25 wt.% – analysis No. 1; Tables 2 & 3). Chamosite from the oolitic–chloritic facies (analysis No. 3), with only 0.10 wt.% V2O3, apparently corresponds to residual primary chamosite, after dissolution of the siderite matrix of the oolitic iron ore at the beginning of stage 1.
2. The V content increases significantly in green or red chamosite crystallized during stages 1 and 2, up to 1.06 wt.% V2O3. In sample 11 (red chamosite), crystal zoning indicates a V decrease from the centre to the rim (1.06–0.58 wt.% V2O3).
3. Then, in stages 2 and 3, the V content decreases. In sulfide veins within the hydrothermalized ironstone (stage 2), the V content is only 0.24 wt.% V2O3. In final generations (i.e. in lulzacite-bearing quartz–siderite veinlets within the ironstone (stage 2) or in sulfide or sulfosalt quartz veins within surrounding sandstone (stages 2 and 3), the V content decreases to very low concentrations (≤0.03 wt.% V2O3). This decrease indicates leaching of vanadium by late hydrothermal solutions.
There is no significant variation of the TiO2 content, which is always very small (0.01–0.03 wt.%; Tables 2 & 3). Similarly, the MnO content is small (0.0–0.3 wt.%), with a small enrichment in green chamosite of stage 3 (up to 0.29 wt.%), while in red chamosite it does not exceed 0.12 wt.%.
Position of chamosite varieties from Saint-Aubin in the chamosite–clinochlore series
The chamosite composition field from Saint-Aubin agrees with the general trend of an increase of IVAl3+ with increasing Fe:(Fe + Mg) ratio (Brown & Bailey, Reference Brown and Bailey1962; Hillier & Velde, Reference Hillier and Velde1991). On the basis of an extended chemical database on metamorphic chlorite, Zane et al. (Reference Zane, Sassi and Guidotti1998) established a regression line between the clinochlore and chamosite poles, from Mg = 4.81 to Fe = 4.38 atoms; that is, if there are no vacancies, IVAl varies from 1.19 up to 1.62 (Fig. 6a). Figure 6a also shows the composition field of the main polytype IIb determined by Brown & Bailey (Reference Brown and Bailey1962) on the basis of XRD data. In Saint-Aubin, chamosite analyses fill the gap between the IIb field and the solid solution of pure chamosite IIb determined experimentally by Parra et al. (Reference Parra, Vidal and Theye2005) in the 350–530°C range, with 1.2 < IVAl < 1.8 atoms per O10(OH)8. In addition, Fig. 6a shows the compositions of chlorite samples with well-resolved crystal structures (Table 5). Ordered triclinic clinochlore studied by Smyth et al. (Reference Smyth, Darby Dyar, May, Bricker and Acker1997), with IVAl = 1.04 and Fe:(Fe + Mg) = 0.02, can be taken as the reference for the Mg endmember. Only one crystal structure of chamosite IIb (Mg-rich) is known: that of Walker & Bish (Reference Walker and Bish1992), with Fe:(Fe + Mg) ≈ 0.6 and IVAl = 1.15. To date, there are no crystal structure data for Mg-poor or Mg-free chamosites of the most common IIb polytype.
Comparison of chamosite from Saint-Aubin with a sequence of chlorites from clinochlore to chamosite. (a) Representation of chamosite analyses from Saint-Aubin in the clinochlore–chamosite series (green diamonds: green variety; red squares: red variety). Black circle: berthierine. Large composition field: area of IIb polytype of Brown & Bailey (Reference Brown and Bailey1962). Dotted line (MC): regression line for metamorphic chlorite (Zane et al., Reference Zane, Sassi and Guidotti1998). Pink diamonds: Compositions from crystal structures (see Table 5). Blue segment: Tschermak substitution range in synthetic pure chamosite (Parra et al., Reference Parra, Vidal and Theye2005). (b) Detail in the Fe-rich part of the series. Green and red dashed lines: composition fields of green and red chamosite varieties from Saint-Aubin, respectively. SA: mean composition of red chamosite. Wr, Za, Bv and B: chamosite from oolitic ironstones; KC and As: chamosite from sulfide deposits.

Selected crystallographic parameters and chemical compositions of members of the clinochlore–chamosite series with well-known crystal structures.

Fe ratio = Fe2+:(Fe2+ + Mg).
McOnie et al. (Reference McOnie, Fawcett and James1975) have established the variation of the unit cell in synthetic chlorites of the clinochlore–‘daphnite’ solid solution (‘daphnite’ = chamosite). The regular increase of the unit volume V with increasing VIFe2+ gives V ≈ 712 Å3 for the Fe endmember. According to Tschermak substitution, Parra et al. (Reference Parra, Vidal and Theye2005) give V between 711 and 719 Å3. On the basis of Fe:(Fe + Mg) = 0.94, the unit cell of red chamosite would be a = 5.393 Å, b = 9.356 Å, c = 14.212 Å, β = 97.2° and V = 711.4 Å3 (McOnie et al., Reference McOnie, Fawcett and James1975). The lower values of the measured a, b and c parameters of red chamosite (5.375, 9.322 and 14.177 Å, respectively) relative to these calculated values are artefacts related to the single-crystal XRD approach. Disorder stacking in clay minerals induces a distortion of the profile of diffraction peaks towards higher 2θ values (i.e. lower interplanar distances) (Brindley, Reference Brindley, Brindley and Brown1980). Hence, the mean positions of diffraction spots recorded through single-crystal XRD analysis will give lower values of unit-cell parameters. Moreover, interstratification with berthierine cannot be excluded, as it would not change significantly the chemical composition or the dimensions of the 7 Å sub-unit cell (Inoué & Kogure, Reference Inoué and Kogure2016).
Comparison with other Mg-poor chamosite occurrences
Various occurrences of Mg-poor chamosite have been described in the past. Table 6 lists their structural formulae. Chamosite is a common component of oolitic ironstones, such as in central Brittany (Chauvel, Reference Chauvel1971), in Switzerland (Delaloye & Odin, Reference Delaloye, Odin and Odin1988) or in the Iberian Massif (Zamora, Spain; Fernández & Moro, Reference Fernandez and Moro1996). All are Al-rich (IVAl >1.3 atoms per 4 tetrahedral sites) and Mg-poor (Fe:(Fe + Mg) >0.85) (Fig. 6b). One exception would be that of chamosite from the type deposit of Chamoson (Switzerland; analysis not shown). The wet analysis of the latter chamosite (Delaloye & Odin, Reference Delaloye, Odin and Odin1988) indicates a very low IVAl (~0.88), together with a Si excess, probably due to quartz impurities. Unfortunately, there is a lack of EPMA results. ‘Bavalite’ from the Devonian stratiform iron ore of Bas-Vallon (central Brittany; Orcel, Reference Orcel1923) is a chamosite that is close to that of Saint-Aubin, with IVAl ≈ 1.46 and Fe:(Fe + Mg) = 0.91. Saint-Aubin chamosite represents the IVAl-richest and Mg-poorest compositions among the oolitic ores. In the Kidd Creek massive sulfide deposit (Ontario), the Mg-poorest chamosite analyses (Jiang, Reference Jiang, Peacor and Slack1992) plot within the field of chamosite from Saint-Aubin (Fig. 6b). A very Mg-poor chamosite (IVAl ≈ 1.44, Fe:(Fe + Mg) = 0.983; Fig. 6b) has been found in the Ashio polymetallic vein deposit (Japan; Inoué & Kogure, Reference Inoué and Kogure2016).
Structural formulae per O10(OH)8 of natural Mg-poor chamosites (Fe:(Fe + Mg) >0.80).

a Red chamosite (mean).
b ‘Bavalite’ (wet analysis).
c World ironstones (mean of 50 analyses).
All of these chamosite analyses are close to the solid-solution field of synthetic Mg-free chamosite of Parra et al. (Reference Parra, Vidal and Theye2005). Clearly, all of these data on natural Mg-poor as well as synthetic Mg-free chamosites contain more Al than the stoichiometric formula (Fe5Al)(Si3Al)O10(OH)8 given by Bayliss (Reference Bayliss1975) for the definition of this chlorite species. On the other hand, they contain Al below the stoichiometric formula (Fe4Al2)(Si2Al2)O10(OH)8. In a temperature range corresponding to metamorphic as well as high-temperature hydrothermal conditions, the ideal composition field (without vacancies) of Mg-free chamosite is restricted to a solid solution between (Fe4.8Al1.2)(Si2.8Al1.2)O10(OH)8 and (Fe4.2Al1.8)(Si2.2Al1.8)O10(OH)8 (Para et al., Reference Parra, Vidal and Theye2005). Thus, chemical analyses on natural as well as synthetic samples show that chamosite is definitively a non-stoichiometric mineral species. It corresponds to the general formula (Fe5–xAl1+x)(Si3–xAl1+x)O10(OH)8, with 0.2 < x < 0.8.
Interpretation of Vis–NIR spectra of red chamosite
The Vis–NIR spectra A and B (Fig. 5) were compared with published spectra of members of the clinochlore–chamosite series. Faye (Reference Faye1968) reported absorption bands of oriented lamellae of green chlorite with 5.2 wt.% Fe2+ and 0.6 wt.% Fe3+ in the range 8000–29,000 cm–1 (1250–345 nm). For a transverse section, there are two bands at low energy (11,600 and 9600 cm–1), while for a basal section, together with the same bands at 11,400 and ~9500 cm–1, an additional feature is present at 14,100 cm–1. Platonov (Reference Platonov and Dumka1976) also described three bands in the unpolarized absorbance spectrum of chamosite at 14,300, 11 350 and 9200 cm–1.
In the clinochlore–chamosite series, the two components at ~11,500 and 9500 cm–1 correspond to electronic transitions of octahedral Fe2+, while the third at ~14,300 cm–1 represents an intervalence charge transfer (IVCT) between Fe2+ and Fe3+ in adjacent M 1 and M 2 octahedra (Platonov, Reference Platonov and Dumka1976). This third component is absent in spectrum A and weak in spectrum B (~710 nm/14,085 cm–1), indicating a very low Fe3+ content in red chamosite from Saint-Aubin. It would be interesting to quantify such a weak Fe3+ content of red chamosite through X-ray absorption near-edge structure measurement at the microscopic scale (Vidal et al., Reference Vidal, De Andrade, Lewin, Muñoz, Parra and Pascarelli2006; Trincal et al., Reference Trincal, Lanari, Buatier, Lacroix, Charpentier, Labaume and Muňoz2015). The weak band at ~620 nm (Fig. 5) may correspond to the large absorption band at 609 nm observed in a green V-rich, Fe-free muscovite, which corresponds to a V3+ electronic transition (Ertl et al., Reference Ertl, Rakovan, Hugues, Bernhardt and Rossman2019).
At >1350 nm (Part II of the A and B spectra in Fig. 5), absorption bands correspond to the overtones and combinations of the fundamental OH and H–O–H vibrations. At the shortest wavelengths, the A and B spectra can be compared with the NIR spectrum obtained for clinochlore between 1350 and 1670 nm (Ferrage et al., Reference Ferrage, Martin, Micoud, Petit, de Parseval, Beziat and Ferret2003): two close sharp bands at 1392 (main) and 1405 nm and two broad ones near 1440 and 1560 nm. The first sharp band, corresponding to the OH-stretching mode of Mg3OH, is not visible in red chamosite due to its low Mg content. The second band was tentatively assigned by Ferrage et al. (Reference Ferrage, Martin, Micoud, Petit, de Parseval, Beziat and Ferret2003) to an OH-stretching mode of Mg2AlOH. They relate the two other broad bands (1440 and 1560 nm) to overtones of OH-stretching fundamental modes of (SiSi)O–OH and (SiAl)O–OH, respectively. The band of the first mode is not visible in the Saint-Aubin sample, as would be expected from its low Si content.
Bishop et al. (Reference Bishop, Lane, Dyar and Brown2008) acquired NIR reflectance spectra of clinochlore and chamosite and reported three bands at ~1400 (sharp), 1450 (broad) and 1550 nm (broad), and two broad bands at 1880 and 2000 nm in clinochlore. All of these bands are very weak (1400, 1890 and 2010 nm) or lacking in chamosite. Mathian et al. (Reference Mathian, Hebert, Baron, Petit, Lescuyer, Furic and Beaufort2018) observed a doublet at 1391 and 1406 nm for clinochlore and at 1407 and 1415 nm for chamosite, in accordance with Ferrage et al. (Reference Ferrage, Martin, Micoud, Petit, de Parseval, Beziat and Ferret2003).
In the region of highest wavelengths (>2200 nm), Bishop et al. (Reference Bishop, Lane, Dyar and Brown2008) described the triplet 2250/2290/2330 nm for clinochlore, or 2260/2310/2360 nm for chamosite. Recently, Mathian et al. (Reference Mathian, Hebert, Baron, Petit, Lescuyer, Furic and Beaufort2018) indicated four bands in clinochlore (2247, 2296, 2326 and 2393 nm) and only two in chamosite (2259 and 2351 nm), with a third one (weak, not measured) between these two bands. In our sample, the two main bands of this complex absorption band centred at ~2300 nm show a shift towards higher wavelengths from clinochlore to chamosite, with the highest values measured for red chamosite (2270 and 2370 nm).
Relative to the general characteristics of the visible spectra of the members of the clinochlore–chamosite series, that of red chamosite presents two peculiarities: a weak Fe3+ absorption band indicative of the very low content of this ion and the presence of a broad band centred at ~550 nm. Alone, this last band would induce a pink to purple colour. Combined with the underlying continuum rising towards the UV, it is responsible for the orange-red colour of this chamosite variety. From Fig. 5, the absorption coefficient of the 550 nm band can be estimated to be ~1 absorbance unit for a thickness of 30 μm, leading to an approximate value of 30 A mm–1, which is considerable. This means that the absorber is very efficient.
Origin of the colour of red chamosite
The colour of minerals is a complex problem that is controlled by various physical-chemical factors (Fritsch & Rossman, Reference Fritsch and Rossman1987, Reference Fritsch and Rossman1988). Many coloured varieties of nominally colourless minerals are related to the presence of a small number of elements, often from the first series of transition metals. They may absorb in the visible range due to electronic transitions within their orbitals (d–d, or crystal field transitions) or due to electronic transitions between two atoms, called IVCT transitions. Finally, in some cases, absorption is due to colour centres, often linked to natural radiation damage. Other causes of colour in minerals are not directly related to absorption and are thus irrelevant to this discussion. The key facts for the interpretation of the visible absorption data are that the colour-causing band centred at ~550 nm is quite wide (Δν1/2 ≈ 3700 cm–1), very strongly absorbing (~30 A mm–1) and very strongly pleochroic (near-white or near-colourless to a dark colour). In addition, it appears to be linked to vanadium.
In the following discussion, one must bear in mind that the hydrothermal process that produced red chamosite is governed by a redox mechanism. This would allow for a greater oxidation state among cations of the transition elements present in red chamosite.
Role of vanadium enrichment
The EPMA results clearly indicate that red chamosite displays V enrichment relative to primitive chamosite, while there is no positive correlation with Mn and Ti contents, which are always very low. Such a V enrichment may be explained without an external source if one considers that the volume of neoformed chamosite is minor relative to that of dissolved primitive chamosite: as the main part of iron from this primitive chamosite re-precipitates as pyrite, there will be a relative residual V enrichment, which leads to an increase in the V:Fe ratio of neoformed chamosite (Gloaguen et al., Reference Gloaguen, Branquet, Boulvais, Moëlo, Chauvel, Chiappero and Marcoux2007).
Tables 2 & 3 show that the V content of hydrothermal green chamosite may be as high as that of the red variety (compare No. 5 and No. 6 of Table 2). Thus, the presence of V in chamosite appears to be a necessary but not sufficient condition for the formation of the red variety. This is confirmed by Whitney & Northrop (Reference Whitney and Northrop1986), who have described a V-rich chlorite of (normal) green colour, where V (mainly trivalent) is concentrated in the octahedral sites of the brucite-type sheet. In similar samples, Meunier (Reference Meunier1994) considers only V3+, which substitutes Al in octahedral sheets.
A mineral similar to red chlorite in an intimate intergrowth of chlorite with biotite or hematite has been described in a transmission electron microscopy study (Mellini et al., Reference Mellini, Nieto, Alvarez and Gomez-Pugnaire1991). Here, the red colour is mainly due to the Fe3+ of hematite, which shows two absorption bands at 12,000 and 16,000 cm–1 (Platonov, Reference Platonov and Dumka1976) and is lacking in red chamosite.
Oxidation state of vanadium
In Saint-Aubin, the dispersion of red chamosite within the oolitic ore and its low V content has precluded up to now the characterization of V oxidation state(s) through analytical methods. Oxidation states 2+ and 5+ can be excluded for V because V2+ prevails only in strongly reducing conditions (below the iron/wüstite buffer), while V5+ implies a high f O2 (Papike et al., Reference Papike, Simo, Burge, Bell, Shearer and Karner2016). In aqueous systems (normal conditions; pH neutral to acid) and at low Eh, V3+ (solid or aqueous species) is the stable oxidation state (Takeno, Reference Takeno2005; Povar et al., Reference Povar, Spinu, Zinicovscaia, Pintile and Ubaldini2019), which coexists with Fe2+. V4+ species appear at higher Eh, always in the stability field of Fe2+ (Takeno, Reference Takeno2005). According to Takeno (Reference Takeno2005), in the same conditions, Mn2+ is the only stable oxidation state of Mn. Mn3+ appears at basic pH and Mn4+ at high Eh.
In Saint-Aubin, abundant organic matter will favour V3+ in chamosite, as in vanadium mica roscoelite, KV2AlSi3O10(OH)2. In red chamosite, the weak band at 620 nm has been tentatively related to V3+. The oxidation process related to hydrothermal stages may also have stabilized V, at least partly, to the V4+ state.
In similar geological environments with reducing conditions (graphite-bearing metamorphic series), only V3+ and V4+ have been detected, such as in tanzanite, a V-bearing variety of zoisite, Ca2Al3(Si2O7)(SiO4)O(OH), from Merelani, northeast Tanzania (Olivier, Reference Olivier2006), as well as in the V-rich oxide minerals of the Green Giant vanadium–graphite deposit, southwest Madagascar (Di Cecco et al., Reference Di Cecco, Tait, Spooner and Scherba2018). In the Kola region (Russia), various V minerals contain exclusively V3+ (Kompanchenko et al., Reference Kompanchenko, Voloshin and Balagansky2018). If the colour is linked to V, then it may be compared to that of various V compounds.
Colour of vanadium oxides and silicates
Evans & White (Reference Evans and White1987) reviewed the colour of V minerals. In V oxides, without the influence of other transition metals, which may induce crystal field or IVCT transitions, the colour is controlled by the oxidation state of V. With V5+ (no 4s or 3d valence electrons), minerals are uncoloured or weakly absorbent. Oxides and hydrates of V4+ are green (i.e. haradaite, Sr(VO)(SiO3)2) or blue (i.e. pentagonite, Ca(VO)(Si4O10).4H2O); V3+ oxides and silicates are black (e.g. karelianite, V2O3) or strongly absorbent. The Fe-free roscoelite K(V3+,Al)2(AlSi3O10)(OH)2, a muscovite isotype, is green (Ito, Reference Ito1965).
When substituting as traces or minor components in oxides, V4+ gives a green colour, as in malayaite (CaSnSiO5), where V4+ replaces Sn4+ (Joo & Lee, Reference Joo and Lee2010). V3+ also gives a green colour in beryl (V-rich emerald), as well as in muscovite (Uher et al., Reference Uher, Kováčik, Kubiš, Shtukenberg and Ozdín2008; Ertl et al., Reference Ertl, Rakovan, Hugues, Bernhardt and Rossman2019) and in a number of other minerals and gems (Fritsch & Rossman, Reference Fritsch and Rossman1987).
In the general review of the colours of minerals by Platonov (Reference Platonov and Dumka1976), only blue to violet tanzanite (Faye & Nickel, Reference Faye and Nickel1971) shows an absorption band (~555 nm) close to but distinct from the specific band of red chamosite at 550 nm (Fig. 5). In all of the studies we reviewed, there is not a single example of a V mineral with a red colour strictly due to V. Thus, the possibility of the 550 nm band originating from isolated V3+ or V4+ is negligible.
Role of other elements
Other isolated transition metal ions can be eliminated as well. In general, transition metal ions produce less absorbing, less pleochroic and narrower bands. The absorption of Fe ions has been discussed earlier, and they do not have a band at 550 nm. Of the remaining transition metals, only Mn and Ti are present in detectable amounts. Mn, although a common colouring agent in minerals, can be ruled out: as Mn2+, it is so weakly absorbing that it has to be present at several wt.% element concentration units (typical of nominal Mn minerals) to give a pink to red colour. However, the concentration of Mn is quite small in Saint-Aubin chamosite. In addition, in the conditions prevailing at Saint-Aubin, Mn2+ is the only stable oxidation state of Mn (Takeno, Reference Takeno2005). Thus, we do not expect to detect the absorption of Mn3+, although it is a far more efficient absorber, but this valence is the result of either natural irradiation (and there are no traces of irradiation in the Saint-Aubin minerals) or of basic pH (Takeno, Reference Takeno2005), which do not correspond to the environment characterized for red chamosite. Similarly, for Ti, efficient colouration in minerals is obtained only through Ti3+, which is also a product of natural irradiation, absent here, or very reducing conditions (such as meteorites), which do not correspond to the redox conditions at the time of deposition. Therefore, isolated metal ions can be eliminated as the potential cause of the red colour in our chamosite.
Colour centres rarely absorb as strongly as the 550 nm band. They may be strongly pleochroic, such as when the colour centre itself is a planar molecular ion (such as CO3– in beryl; Fritsch & Rossman, Reference Fritsch and Rossman1988). Thus, combined again with the absence of irradiation, colour centres are very unlikely causes of this absorption. It follows that only charge-transfer (IVCT) processes offer the observed combination of extremely efficient absorption, very strong pleochroism and rather broad bands (Mattson & Rossman, Reference Mattson and Rossman1987) required to explain the results of this study.
Charge-transfer mechanism
Examples of IVCT include mostly Fe2+–Fe3+ in a variety of minerals, such as beryl, cordierite and lazulite (Fritsch & Rossman, Reference Fritsch and Rossman1988). Furthermore, here, the pleochroism is particularly intense, going from near colourless to a very dark colour, as is the case for many charge-transfer processes (as in the three examples cited before). Thus, the exceptionally strong pleochroism combined with the exceptionally large absorption coefficient strongly support the IVCT working hypothesis, which is the only type of absorption mechanism to which these two properties are typically associated.
The large width of the 550 nm absorption band (Fig. 5) is an additional argument for IVCT. Even though the value of Δν1/2 (~3700 cm–1) may appear low relative to the common interval of 5000–6300 cm–1 for Fe2+/Fe3+ IVCT (Mattson & Rossman, Reference Mattson and Rossman1987), it is in accordance with the lowest values of 3150 and 3575 cm–1 indicated by these authors for biotite and chlorite, respectively.
According to the EPMA results and the spectroscopic study, only the Fe/V pair can be considered for such an IVCT || (001). A heteronuclear charge transfer between two cations M 1 and M 2 in adjacent octahedra, with oxidation states m+ and n+, respectively, corresponds to the general formula in Eq. (1):
 $$M_1^ {m +} { + } M_2^{n +} \to M_1^{\lpar {m -1} \rpar + } + M_2^{\lpar {n \, + \, 1} \rpar + } $$
In addition, Fe3+ is minor relative to Fe2+, as indicated by the weak absorption band at 710 nm in the Vis–NIR spectra (Fig. 5), which would correspond to Fe2+/Fe3+ IVCT. Two solutions are possible for Eq. (1):
 $${\rm F}{\rm e}^{3 + } + {\rm V}^{3 + }\to {\rm Fe}^{2 + } + {\rm V}^{4 + }$$
or conversely:
 $${\rm V}^{4 + } + {\rm Fe}^{2 + }\to {\rm V}^{3 + } + {\rm F}{\rm e}^{3 + }$$
The IVCT according to Eq. (2), which implies the presence of Fe3+ and V3+ in adjacent octahedra and both of low concentration in chamosite, is less probable than the IVCT in Eq. (3), as there will always be an Fe2+ ion adjacent to any V-containing octahedron. Hence, the IVCT in Eq. (3) appears to be the best proposal to explain the broad absorption band at ~550 nm.
No IVCT such as that in Eq. (3) has been documented previously. It would be similar to the Fe2+/Ti4+ IVCT described in dumortierite and other (Fe, Ti)-bearing silicates (Platonov et al., Reference Platonov, Langer, Chopin, Andrut and Taran2000, and references herein). Nevertheless, in the case of dumortierite, Fe and Ti are in face-sharing octahedra with a short Fe–Ti distance and with direct overlapping of the T 2g levels. In edge-sharing octahedra, there must be an indirect charge transfer via bridging oxygen.
Resulting colour
When reconsidering spectroscopic data in the visible range according to IVCT mechanism, the red colour of chamosite is the sum of two opposite spectroscopic characteristics: (1) an absorption band due to Fe/V IVCT, which absorbs the green colour owing to minor V; and (2) a good transparency in the orange-red part of the spectrum due to very low Fe3+. This transparency is a rather special characteristic because, generally, chlorite has a significant Fe3+ content that would induce an absorption band at ~700 nm (Fe2+/Fe3+ IVCT).
Oxidation conditions
In Saint-Aubin, the sulfidation of the oolitic iron ore is the result of a geochemical process combining siderite leaching and redox reactions between organic matter and the hydrothermal solution (Gloaguen et al., Reference Gloaguen, Branquet, Boulvais, Moëlo, Chauvel, Chiappero and Marcoux2007). The organic matter acted as a buffer to control the strong reducing conditions as long as it was in close contact with the hydrothermal solution and allowed the crystallization of green chamosite. Conversely, when this buffer was not operating locally, the hydrothermal solution induced a weak increase of f O2 and the crystallization of red chamosite.
Formation of red chamosite would be the result of the strongest interaction of the oxidant hydrothermal solution with primitive oolitic ore, according to the preferred location of red chlorite in the strongest reaction zones (alteration haloes) between massive sulfide lenses and oolitic ironstone. Around these zones, chamosite may have crystallized at the same time with similar V contents, but with a normal green colour. The formation of brown berthierine would indicate a similar increase of f O2 during the late, low-temperature hydrothermal stage.
Summary and conclusions
In Saint-Aubin-des-Châteaux, the interaction between the primitive lower Ordovician oolitic iron ore and an early Variscan hydrothermal solution leads to a complex paragenetic sequence, illustrated by the chemical evolution of chamosite. Together with its IVAl content, the V concentration is the best marker of this evolution, with its highest values related to the maximal hydrothermal remobilization of the oolitic ore at the beginning of the process. This leads to the formation of a red variety of chamosite, related to a local increase of f O2 when the primitive organic matter did not act locally as a buffer of reducing conditions.
As a whole, the chamosite composition field from Saint-Aubin fills the gap between the solid-solution field of the IIb polytype in natural compounds defined by Brown & Bailey (Reference Brown and Bailey1962) and synthetic Mg-free chamosite (Parra et al., Reference Parra, Vidal and Theye2005). While the Fe:(Fe + Mg) ratio is relatively constant, the IVAl content varies significantly from 1.4 up to 1.8 atoms per four tetrahedra, according to variations in SiO2 local activity. Red chamosite has an Fe:(Fe + Mg) mean ratio of close to 0.944, and that of IVAl is close to 1.67.
Taking into account EPMAs of Mg-poor natural as well as Mg-free synthetic samples (Fig. 6), the simplified composition of chamosite (Fe-pure, no vacancies) agrees with the non-stoichiometric formula (Fe5–xAl1+x)(Si3–xAl1+x)O10(OH)8, with 0.2 < x < 0.8. The stoichiometric formulas (Fe4Al2)(Si2Al2)O10(OH)8 and (Fe5Al)(Si3Al)O10(OH)8, commonly used as theoretical endmembers (so-called ‘Fe-amesite’ and ‘daphnite’, respectively) for thermodynamic calculations (Parra et al., Reference Parra, Vidal and Theye2005; Bourdelle et al., Reference Bourdelle, Parra, Chopin and Beyssac2013), are outside this solid solution and are purely theoretical, without natural counterpart.
According to the absorption spectrum in the Vis–NIR range, the colour and exceptionally strong pleochroism of red chamosite are explained by the combination of two factors. First, the proposed IVCT mechanism between V and Fe in the trioctahedral sheet (probably Fe3+–V3+ → Fe2+–V4+ charge transfer) absorbs green. Second, the low Fe3+ content precludes significant VIFe2+/VIFe3+ IVCT and favours red transparency.
In order to check this model of Fe/V IVCT, it would be useful to perform Vis–NIR spectroscopic studies on other vanadiferous green chlorites, such as those from Utah (Whitney & Northrop, Reference Whitney and Northrop1986). According to the proposed model, such a green colour may be due either to the association of two absorption bands at 550 and 700 nm (Fe2+/V4+ and Fe2+/Fe3+ IVCT, respectively) or to the lack thereof (only Fe2+ and V3+).
The oolitic iron ore deposit of Saint-Aubin-des-Châteaux is an original example of the succession of numerous Mg-poor chamosite generations, from primitive weak metamorphic to several hydrothermal varieties. Crystal chemical changes (IVAl and minor V contents) as well as colour changes of chamosite are controlled by the evolution of the geochemistry of the system (Al:Si ratio, redox conditions and chemical exchanges between primitive oolitic ores and hydrothermal solutions).
Acknowledgements
The authors are grateful to Dr A. Meerschaut (CNRS-IMN, retired), who performed the single-crystal XRD examination of red chamosite. Dr G. Cornen (LPG, Nantes university and CNRS – retired) kindly informed us of his first observations of red chamosite. Discussion with V. Trincal (Paul Sabatier University, Toulouse) was very helpful. The careful examination performed by Peter C. Ryan (Middlebury College, VA, USA), Associate Editor Javier Cuadros and an anonymous reviewer greatly improved the quality of the manuscript.