Introduction
Hymenolepis nana is the most common tapeworm of humans, particularly in young children in developing countries (Abdi et al., Reference Abdi, Nibret and Munshea2016; Rostami et al., Reference Rostami, Ebrahimi, Mehravar, Fallah Omrani, Fallahi and Behniafar2016). It was often referred to as the dwarf tapeworm due to its small size (about 2–4 cm long and only 1 mm wide). The life cycle of H. nana may be either direct or indirect. Direct human to human transmission is the most common route of infection, particularly in areas of poor hygiene and inadequate sanitation (Willcocks et al., Reference Willcocks, McAuliffe and Baird2015). The appearance of both eosinophils and mucosal mast cells (MMCs) in the intestinal mucosa was suggested as the most effective immune response against H. nana infections (Bortoletti et al., Reference Bortoletti, Gabriele and Palmas1989; Watanabe et al., Reference Watanabe, Nawa, Okamoto and Kobayashi1994). Immune potentiation of the intestinal immunity, using different immune stimulators, could accelerate the eradication of H. nana (Sanad & Al-Furaeihi, Reference Sanad and Al-Furaeihi2006). The pattern of cytokines after infection differed according to the parasite developmental stage: eggs enhanced interferon (IFN)-γ while, 4–5 days later, interleukin (IL)-4 and IL-5 were predominant (Conchedda et al., Reference Conchedda, Bortoletti, Gabriele, Wakelin and Palmas1997). Effective vaccination against H. nana infection was found to depend on the immunization route (Gabriele et al., Reference Gabriele, Ecca, Aru and Palmas1985).
Moringa oleifera (MOE) grows throughout the tropical and subtropical regions of the world (Leone et al., Reference Leone, Spada, Battezzati, Schiraldi, Aristil and Bertoli2015). Many reports have described the potential therapeutic values of MOE, including anti-cancer, anti-diabetes, anti-rheumatoid arthritis, anti-fungal and anti-microbial effects (Chuang et al., Reference Chuang, Lee, Chou, Murugan, Shieh and Chen2007). These have been attributed to the anti-inflammatory and anti-oxidative activities of MOE (Adedapo et al., Reference Adedapo, Falayi and Oyagbemi2015). MOE was also reported to be protective against intestinal parasite infections (Ola-Fadunsin & Ademola, Reference Ola-Fadunsin and Ademola2013; Salles et al., Reference Salles, Braga, Nascimento, Sousa, Lima, Vieira Lda, Cavalcante, Egito and Andrade2014). Moringa leaves contain significant amounts of vitamins A, B and C, minerals such as calcium ions, iron and potassium, and proteins, as well as traces of carotenoids, saponins, phytates and phenolic constituents (Siddhuraju & Becker, Reference Siddhuraju and Becker2003; Ferreira et al., Reference Ferreira, Farias, Oliveira and Carvalho2008). These constituents might be responsible for its immunomodulatory activity, by enhancing the cell-mediated, humoral immune responses and secretion of cytokines (Maggini et al., Reference Maggini, Wintergerst, Beveridge and Hornig2007; Banji et al., Reference Banji, Banji and Kavitha2012; Nfambi et al., Reference Nfambi, Bbosa, Sembajwe, Gakunga and Kasolo2015).
This study aimed to test the effect of MOE alone or as a mucosal adjuvant with H. nana antigen (HNA) on murine infection with H. nana. MOE and MOE + HNA decreased adult worm and egg counts. MOE was responsible for decreased MMC infiltration and oxidative stress but increased goblet cell (GC) and IgA levels. Application of MOE in mucosal immunization modulated the immune responses and induced protection against H. nana infection.
Materials and methods
Parasite
Hymenolepis nana was isolated from infected Mus musculus and maintained in outbred mice. The eggs were collected from infected mice which were sacrificed 14 days post infection. Infective shell-free eggs were prepared from gravid segments of adult worms by stirring the egg suspension with glass beads (3 mm in diameter) just before use (Ito et al., Reference Ito, Onitake, Sasaki and Takami1991).
Collection of adult worms and preparation of HNA
Adult worms of H. nana were collected from the small intestines of infected mice. Worms were homogenized in physiological phosphate-buffered saline (pH 7.4) at 4°C and then sonicated four times at 30 kHz (Branson sonifier 250, Danbury, Connecticut, USA) for 5 min continuously. The suspension was subsequently centrifuged at 8000 × g and 4°C for 30 min. The supernatant was collected, divided into aliquots and stored at −70°C until use. The protein content was determined by the method of Bradford (Reference Bradford1976).
Preparation of plant extract
The leaves of M. oleifera were harvested from different trees cultivated in the Sids research station, Beni-Suef Governorate and identified by the Botany Department, Faculty of Science, Beni-Suef University. The leaves were first rinsed with distilled water, and dried at room temperature for 3 weeks. The leaves were subsequently pulverized with a Warring 240 V 4-litre blender (Thomas Scientific, Swedesboro, New Jersey, USA). The pulverized material was then macerated in 70% ethanol and left for 48 h at room temperature. The extract was then filtered through muslin cloth on a plug of glass wool in a glass column, as described by Ugwu et al. (Reference Ugwu, Nwodo, Joshua, Odo, Bawa, Ossai and Adonu2013). The resulting ethanol extract was concentrated and evaporated to dryness using a rotary evaporator (BÜCHI Labortechnik AG, Postfach, Switzerland) at an optimum temperature between 40 and 45°C to avoid denaturation of the active ingredients. The concentrated extract was stored in the refrigerator, weighed and dissolved in saline with the help of a cyclomixer just before oral administration (Sinha et al., Reference Sinha, Das, Datta, Ghosh and Dey2012).The study was conducted using a single batch of plant extract to avoid batch-to-batch variation.
Animals
Female Swiss albino mice (22–25 g weight and 6–8 weeks old), free of parasitic infections, were used in this study. Animals were housed in a specific pathogen-free environment under controlled temperature (21°C) with 12 h of light and 12 h of dark, and had free access to water and a standard mouse chow diet.
Immunization, sacrifice and examination
Mice were divided randomly into five groups (ten mice each), where the experimental groups were orally immunized/treated once a week for 4 weeks. The first and second groups functioned as non-infected and infected controls, respectively. The experimental groups were manipulated as following: the third group was treated with MOE alone (400 mg/kg body weight). The fourth and fifth groups were immunized with HNA alone (50 μg/mouse) or MOE + HNA, respectively. One week after the final immunization, the second to fifth groups of mice were challenged with 2000 eggs/mouse, using a stomach tube. After 3 weeks of challenge, blood was collected by retro-orbital puncture immediately before the mice were euthanized and the small intestines were removed. The small intestines were opened longitudinally and the worm burdens determined (Henderson & Hanna, Reference Henderson and Hanna1987). Eggs/gram of faeces (EPG) were counted (Levecke et al., Reference Levecke, Behnke, Ajjampur, Albonico, Ame, Charlier, Geiger, Hoa, KamwaNgassam, Kotze, McCarthy, Montresor, Periago, Roy, TchuemTchuenté, Thach and Vercruysse2011). The percentage efficacy of the treatment was calculated using the following formula (Coles et al., Reference Coles, Bauer, Borgsteede, Geerts, Klei, Taylor and Waller1992): % Efficacy = [(mean EPG control − mean EPG treated)/mean EPG control] × 100.
Sample and tissue preparations
Intestinal washings were obtained by dissecting out the small intestine and flushing with 3 ml 50 mm EDTA plus 0.1 mg/ml of soybean trypsin inhibitor. The contents were collected in a conical tube and 20 μl of 100 mm phenylmethylsulphonyl fluoride (PMSF) in isopropanol was added per tube. The tubes were vortexed and centrifuged at 23,000 × g for 30 min at 4°C. The supernatant was stored at 20°C prior to assay. Parts of the ileum were homogenized to give 50% (w/v) homogenate in ice-cold medium containing 50 mm Tris–HCl and 300 mm sucrose (Tsakiris et al., Reference Tsakiris, Schulpis, Marinou and Behrakis2004). The homogenate was centrifuged at 500 × g for 10 min at 4°C. The supernatant was used for the biochemical determinations. Tissue samples were collected from the intestine of all animals and immediately fixed in 10% formalin, then these samples were processed (Bancroft & Gamble, Reference Bancroft and Gamble2008). After fixation for 48 h, the samples were washed in running water (1 h), dehydrated in graduated ethyl alcohol 50%, 70%, 95% and 100% (2 h each), cleaned in xylene (two changes, 2 h each) and embedded in paraffin wax (three changes, 2 h each). After microtomy, 5-μm tissue sections were mounted on clean glass slides and stained with haematoxylin and eosin (H&E). Sections were examined for histopathological and histochemical changes.
Determination of oxidative stress markers
The lipid peroxidation level was determined according to the method described by Ohkawa et al. (Reference Ohkawa, Ohishi and Yagi1979). This method employed measurement of the concentration of thiobarbituric acid reactive substances (TBARS). Results were expressed as nmol TBARS/mg of protein. The concentration of reduced glutathione (GSH) was also determined (Ellman, Reference Ellman1959; Sedlak & Lindsay, Reference Sedlak and Lindsay1968). The GSH level was expressed as mmol/mg of protein. Protein concentration was determined according to the method described by Bradford (Reference Bradford1976), using bovine serum albumin as a standard.
Histochemistry
Paraffin sections were deparaffinized with xylene (two times, 5 min each) and rehydrated gradually with 100% ethanol, 95% ethanol, 70% ethanol and water. Sections were then either stained with Alcian blue (AB) or periodic acid–Schiff (PAS) for determination of GCs (Allen et al., Reference Allen, Hutton, Leonard, Pearson and Sellers1986). Sections were also stained with naphthol AS-D chloroacetate (Sigma, St. Louis, Missouri, USA) and counterstained with haematoxylin for counting MMCs (Leder, Reference Leder1979; Caughey et al., Reference Caughey, Viro, Calonico, McDonald, Lazarus and Gold1988; Gounaris et al., Reference Gounaris, Erdman, Restaino, Gurish, Friend, Gounari, Lee, Zhang, Glickman, Shin, Rao, Poutahidis, Weissleder, McNagny and Khazaie2007). For each animal, the number of GCs in the ileum was counted on at least ten well-orientated villous crypt units (VCUs). Results were expressed as the mean number of GCs per ten VCUs.
Real-time polymerase chain reaction (RT-PCR)
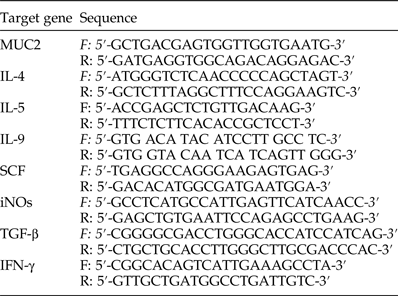
The protocol was performed as described by Abdel-Latif et al. (Reference Abdel-Latif, Abdel-Haleem and Abdel-Baki2016). Total RNA was isolated from part of the ileum, using SV Total RNA Isolation system (Promega, Madison, Wisconsin, USA). Contaminating genomic DNA was digested with the DNA-free™ kit (Applied Biosystems, Darmstadt, Germany), before cDNA was synthesized using a Reverse Transcription kit (Stratagene, La Jolla, California, USA). RT-PCR was performed in a TaqMan7500 (Applied Biosystems) using the QuantiTect™ SYBR® Green PCR kit (Qiagen, Hilden, Germany) according to the manufacturer's instructions. Qiagen delivered the primers for the following genes: mucin 2 (MUC2), inducible nitric oxide synthase (iNOs), IFN-γ, stem cell factor (SCF), transforming growth factor-beta (TGF-β), IL-4, IL-5, IL-9 and 18S rRNA (table 1). The initial incubation was done at 50°C for 2 min, followed by Taq polymerase activation at 95°C for 10 min, 1 cycle, followed by 30 cycles at 95°C for 10 min, 60°C for 35 s and 72°C for 30 s. All PCR reactions yielded only a single product of the expected size, as detected by melting point analysis and gel electrophoresis. Quantitative evaluation was performed with TaqMan7500 system software (Applied Biosystems). Expression of genes was normalized to that of 18S rRNA (Delic et al., Reference Delic, Gailus, Vohr, Dkhil, Al-Quraishy and Wunderlich2010).
Primer sequences of detected mouse genes in RT-PCR.

Determination of HNA-specific IgA
Immulon (Dynatech Labs, Chantilly, Virginia, USA) 96-well plates were coated with HNA in 50 mm bicarbonate buffer (pH 9.6; 100 μl/well; overnight at 4°C) with the optimum antigen concentration (2 μg protein/well) based on results obtained from preliminary block titration experiments. Plates were washed with 0.1 m phosphate-buffered saline (PBS) (pH 7.2) containing 0.05% Tween 20 (PBS-T) and blocked with 1% bovine serum albumin (Sigma) in PBS-T (200 μl/well) for 1 h at 37°C. Individual mice sera and intestinal washes were diluted 1:100 and 1:10, respectively, loaded on to the plate wells in duplicate (100 μl/well) and incubated for 2 h at room temperature (RT). IgA was detected with horseradish peroxidase (HRP)-conjugated goat anti-mouse IgA antibodies (SeraCare Life Sciences, Maryland, USA) diluted 1:4000 and incubated for 1 h at room temperature followed by development with ortho-phenyldiamine (Sigma)/hydrogen peroxide. After antibody incubations, the plates were washed three times with PBS-T. The reaction was stopped by the addition of 0.01% sodium azide in citrate buffer (pH 5.0). The absorbance was read at 492 nm using a multi-well plate reader (Techan Group Ltd., Männedorf, Switzerland).
Statistical analysis
Statistical analysis was carried out as described by Ahmed et al. (Reference Ahmed, Abdel-Latif and Ahmed2015). SPSS (version 20) statistical program (SPSS Inc., Chicago, Illinois, USA) was used to carry out a one-way analysis of variance (ANOVA) on our data. When significant differences by ANOVA were detected, analysis of differences between the means of infected and non-infected controls, or infected and immunized/treated, were performed using Dunnett's t-test.
Results
Protective effect of MOE against H. nana infection
Immunization with HNA could significantly reduce the number of adult worms in the intestine and eggs in faeces (46 and 86.3%, respectively; table 2) compared to infected controls. When MOE was used as an adjuvant with HNA, reductions were higher (86.5 and 97.1%, respectively). Comparing MOE + HNA with HNA, MOE as a mucosal adjuvant could significantly reduce the adult worm count (P < 0.01) but reduction of egg count was not significant. MOE alone also reduced the adult worms and eggs (89.3 and 97.2%, respectively).
Means, statistical significance and reduction percentages of both worm and egg counts after HNA, MOE or MOE+ HNA treatments.

aTotal number of worms in each group.
Histological observations
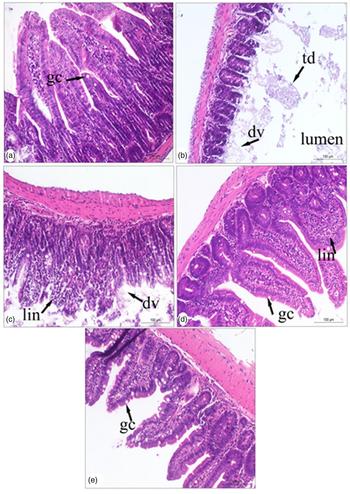
Experimental infection of mice with H. nana eggs led to damage in the villi (fig. 1b) compared to non-infected controls (fig. 1a). Immunization with HNA caused less degeneration of villi and leucocytic infiltration (fig. 1c). Treatment with MOE inhibited damage to villi and moderately increased the number of GCs (fig. 1d), while immunization with MOE + HNA led to the same effect with obviously increased occurrence of GCs (fig. 1e).
Effect of HNA, MOE or MOE + HNA on intestinal histological structures in experimental hymenolepiasis nana. The figure shows damage in intestinal villi in the infected group (b) compared to non-infected group (a). Pre-treatments with MOE (d) or MOE + HNA (e) were better than HNA alone (c), and could reverse the intestinal changes. dv, Degenerated or disrupted villi; td, tissue debris; lin, leucocyte infiltration; gc, goblet cell. Scale bar: 100 μm.

Effect of MOE and HNA on intestinal MMCs and GCs
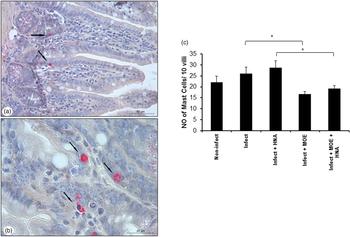
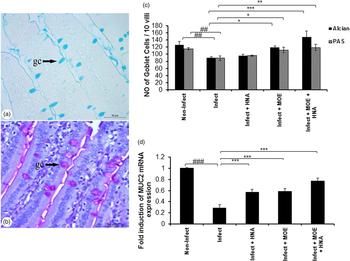
In the infected control group, a non-significant (P > 0.05) increase in the number of MMCs appeared in comparison with non-infected controls (fig. 2). Immunization with HNA caused a non-significant increase in MMCs, while MOE treatment caused a significant decrease compared to the infected control (P < 0.05). Application of MOE as an adjuvant with HNA caused a significant (P < 0.05) reduction in MMCs compared to HNA groups. Specific staining for GCs with either AB or PAS showed similar counts (fig. 3a, b). With both stains, the infected control group showed a significant decrease (P < 0.01) in GCs (fig. 3c). Compared to this group, immunization with MOE increased GCs (P < 0.05). In the MOE + HNA group, AB- and PAS-stained GCs increased significantly (P < 0.001, P < 0.01, respectively). Similarly, a significant decrease (P < 0.001) in mRNA expression of MUC2 was observed in infected compared to non-infected controls (fig. 3d). All the other groups showed significant increases (P < 0.001) in expression compared to the infected control. Obviously, the increased level of GCs was found to be normalized when compared to the level in the non-infected control. However, the MUC2 test indicated lower levels in all infected groups compared to the non-infected group.
Effect of HNA, MOE or MOE + HNA on intestinal mast cell infiltration. Mast cells were stained with naphthol AS-D chloroacetate and appeared at the base of villi (a and b). (c) Mean number of mast cells per 10 villi ± SD in MOE + HNA versus HNA, or MOE versus infected groups, showed significant decreases (*, P < 0.05). Scale bars in (a) and (b): 50 and 20 μm, respectively.

Effect of HNA, MOE or MOE + HNA on GC hypoplasia (P < 0.01; c) and decreased mRNA expression of MUC2 (P < 0.001; d) in infected versus non-infected groups. Mean number of (a) AB or (b) PAS-stained GCs per 10 villi ± SD in MOE and MOE + HNA groups increased significantly (P < 0.05 and P < 0.001, respectively) in comparison with the infected group (c). MUC2 expression increased significantly (P < 0.001) in all treated groups in comparison with the infected group. gc, Goblet cell. # and * represent statistical P values for infected versus non-infected, and treated versus infected groups, respectively. Scale bar: 50 μm.

Effect of MOE and HNA on oxidative stress in intestines
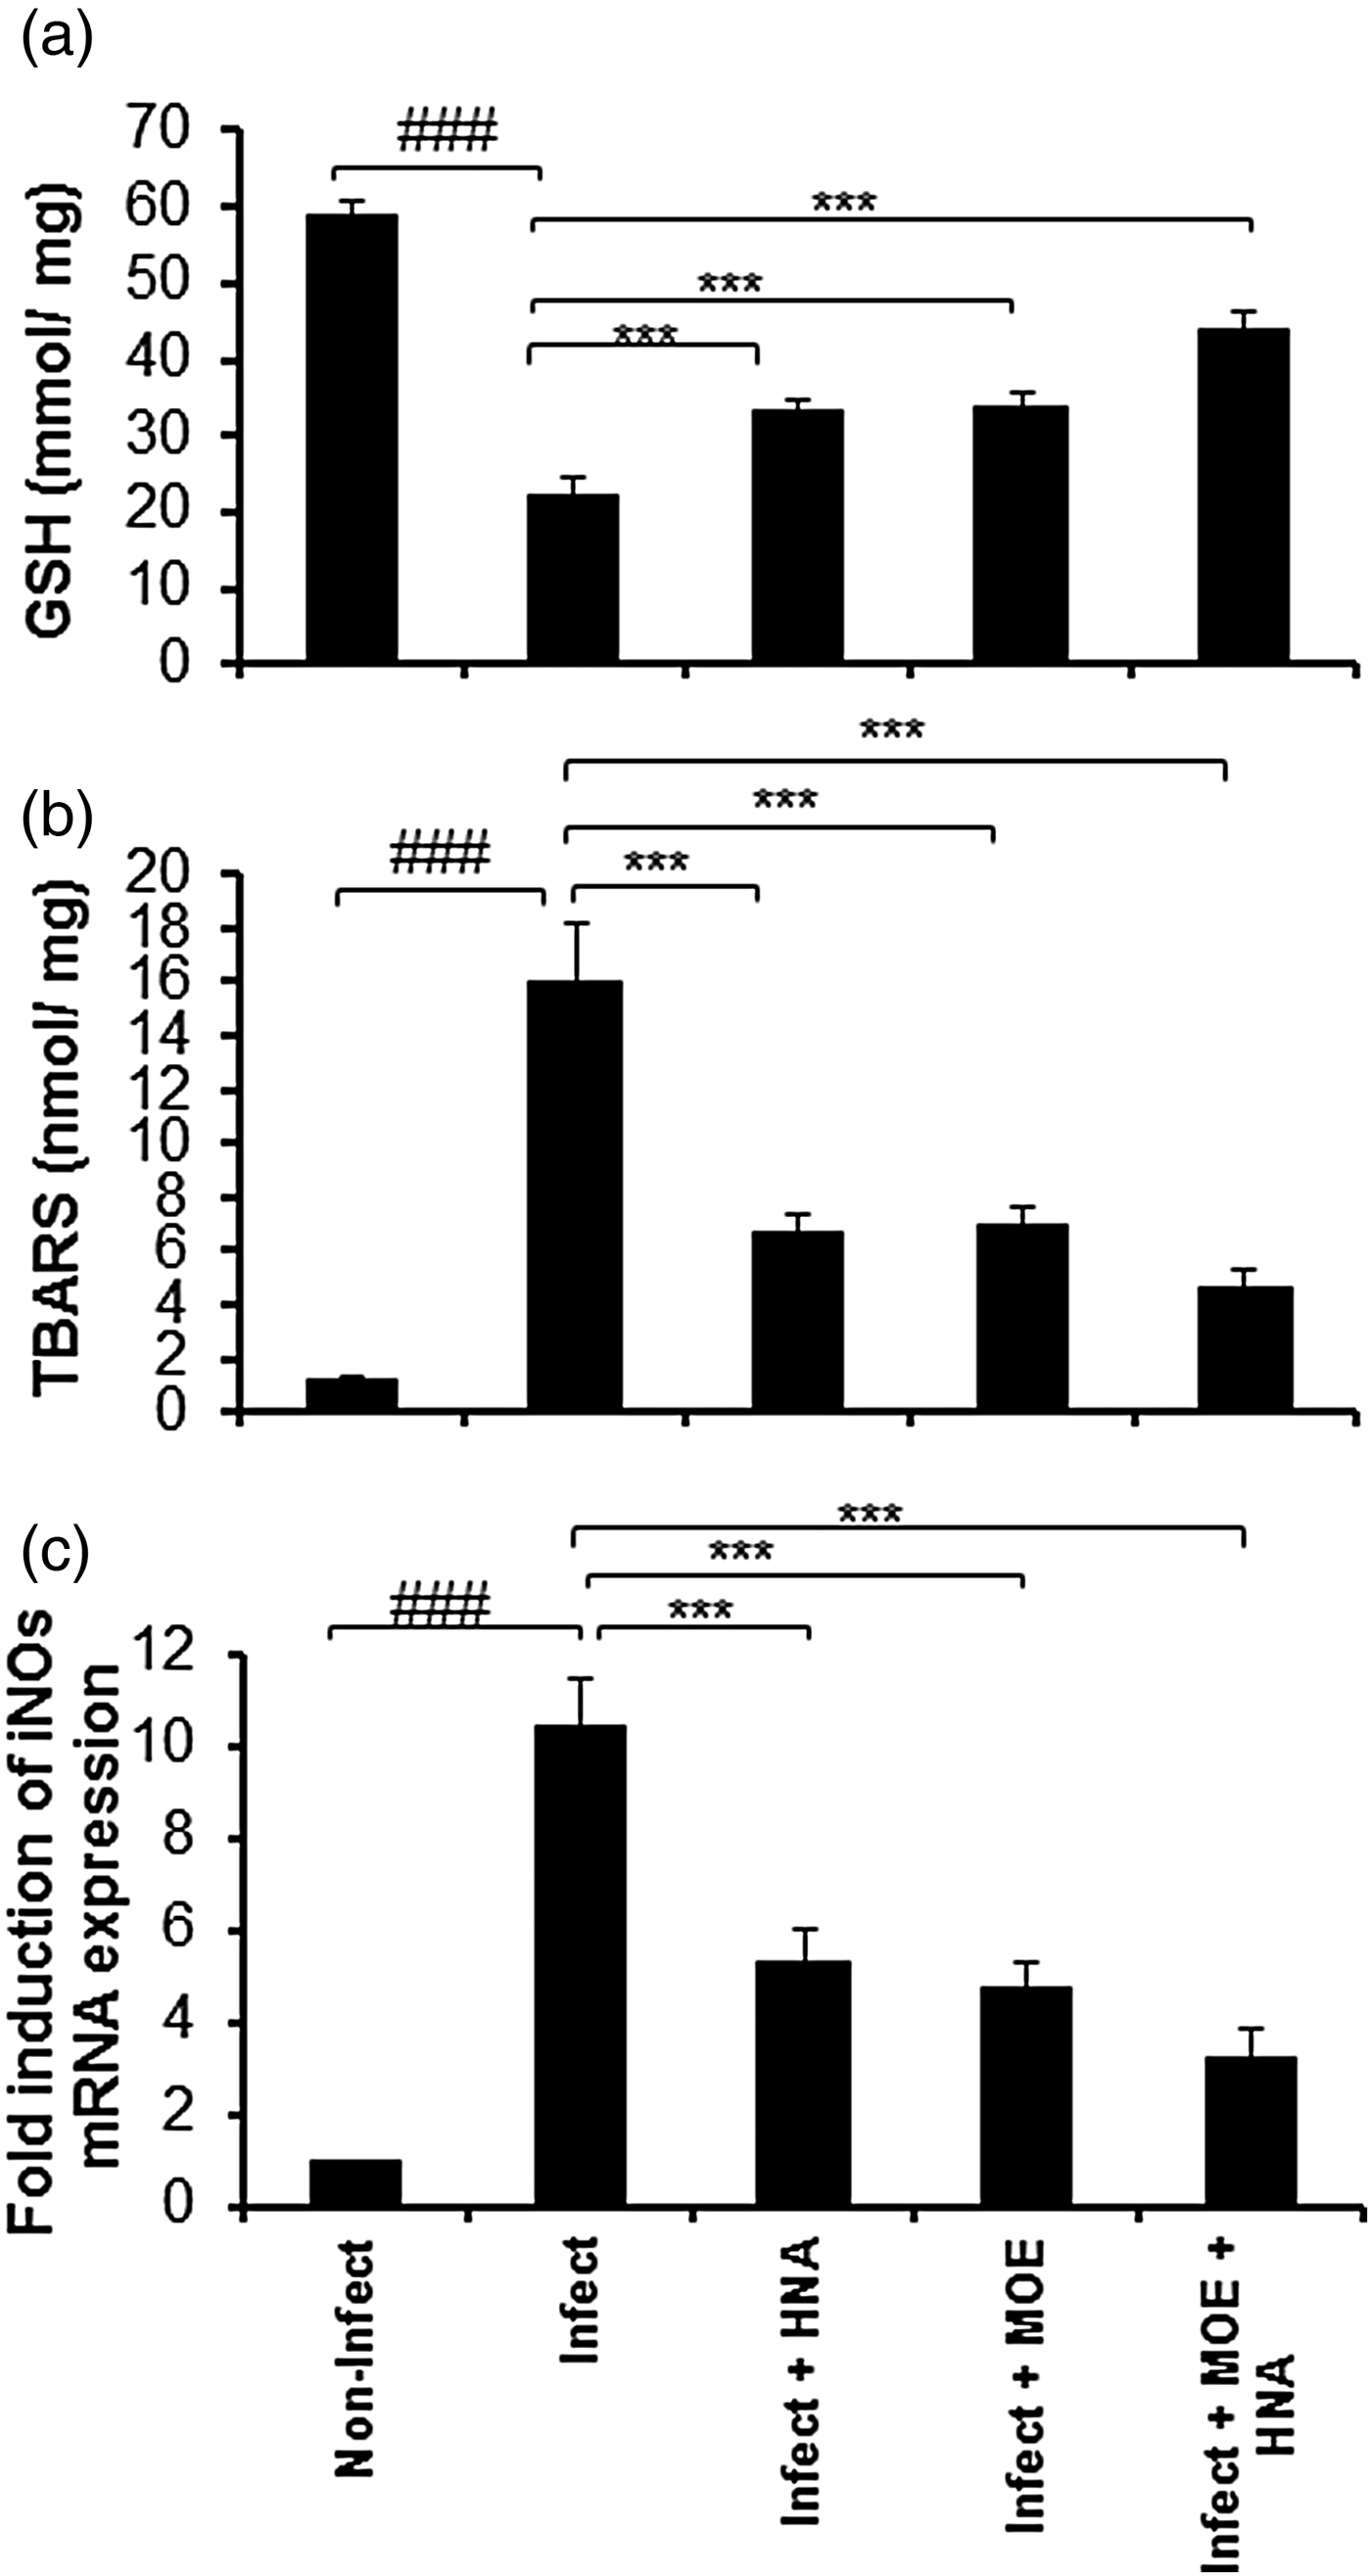
Compared to the non-infected group, a significant (P < 0.001) decrease and increase in GSH and TBARS, respectively, were shown in the infected control group (fig. 4). Other groups of treatment showed significant increases (P < 0.001) in GSH and decreases (P < 0.001) in TBARS compared to the infected control. The results of iNOs mRNA expression clearly confirm the results of GSH and TBARS.
Effect of HNA, MOE or MOE + HNA on GSH (a), TBARS (b) and iNOs mRNA (c) levels in intestinal tissue. Compared to the non-infected group, GSH decreased (P < 0.001) while TBARS and iNOs increased (P < 0.001) in the infected group. Compared to the infected group, GSH increased (P < 0.001), while TBARS and iNOs decreased (P < 0.001) in treatment groups. # and * represent statistical P values for infected versus non-infected, and treated versus infected groups, respectively.

Effect of MOE and HNA on serum and intestinal IgA levels
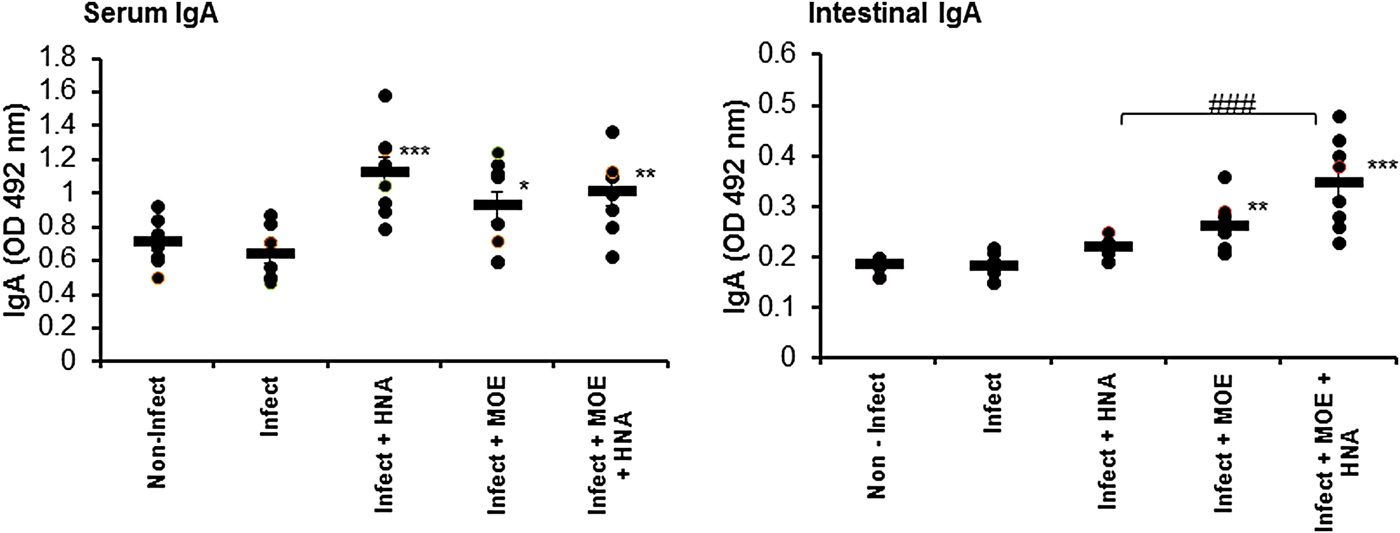
Compared to the non-infected group, infected serum and intestinal IgA levels did not show any changes (fig. 5). Immunization with HNA increased serum IgA (P < 0.001) but did not affect intestinal IgA. Treatment with MOE increased both serum and intestinal IgA (P < 0.05 and P < 0.01, respectively). Increased levels were also observed when MOE was used as an adjuvant (P < 0.01 and P < 0.001, respectively). Compared to HNA, MOE + HNA increased intestinal IgA significantly (P < 0.001).
Effect of HNA, MOE or MOE+ HNA on IgA levels in serum and intestinal washes. The figure shows non-significant changes in the serum and intestinal wash samples of the infected group versus the non-infected group. Compared to the infected group, HNA increased serum (P < 0.001) but not intestinal IgA. MOE and MOE + HNA increased serum (P < 0.05 and P < 0.01, respectively) and intestinal (P < 0.01 and P < 0.001, respectively) IgA. * and # represent statistical P values for treated versus infected groups, or MOE + HNA versus HNA, respectively.

Effect of MOE and HNA on mRNA expression of cytokines
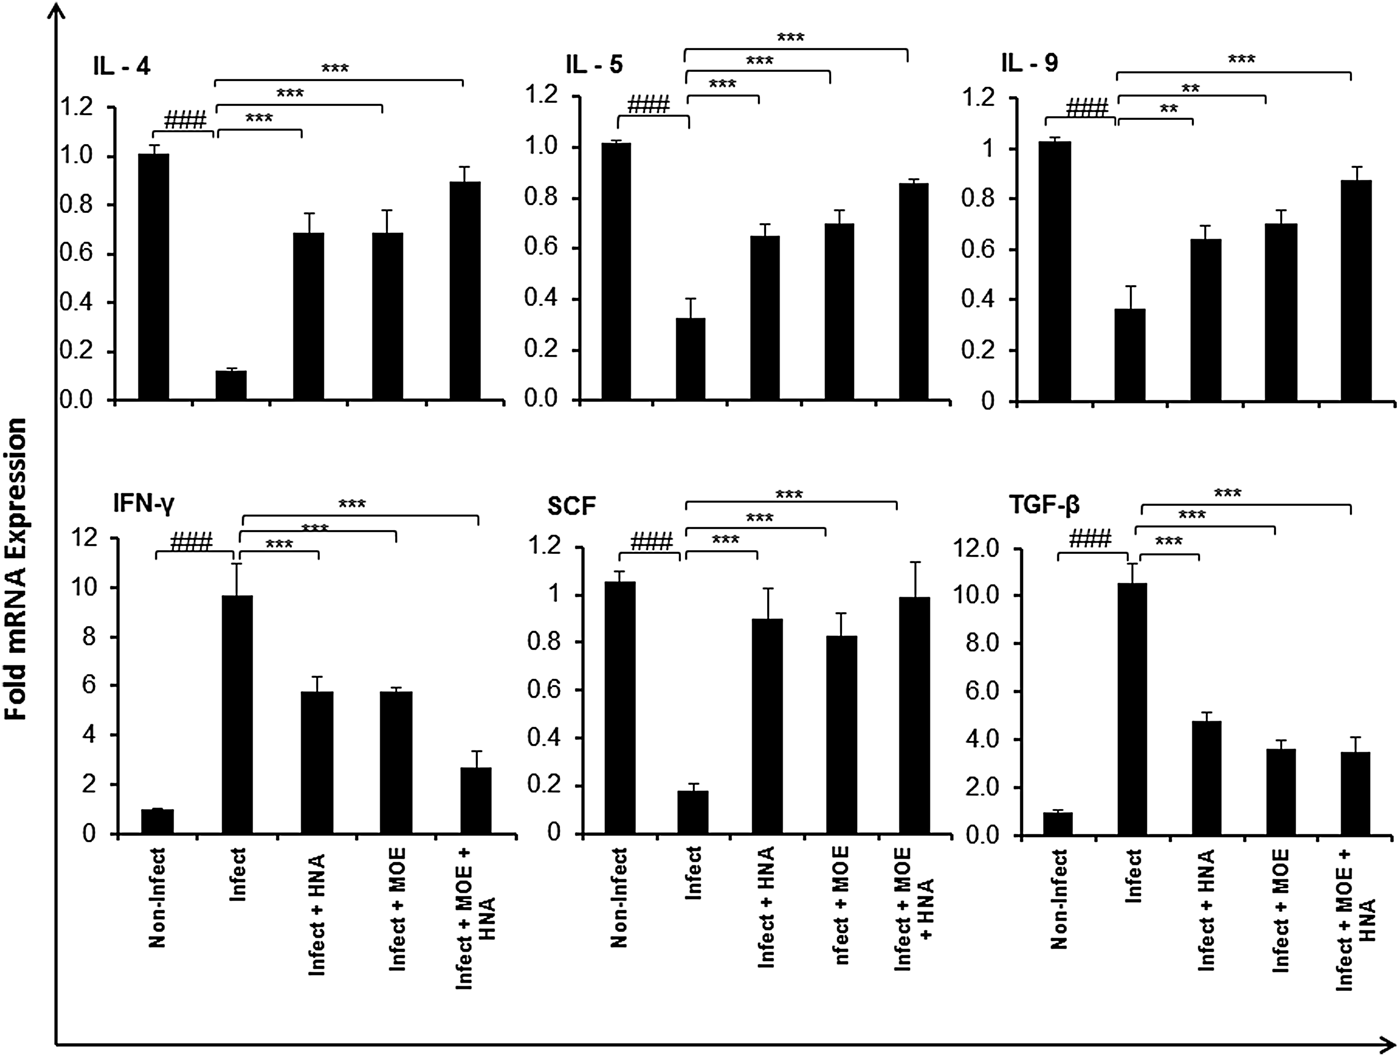
Compared to the non-infected group, mRNA expression of IFN-γ and TGF-β increased (P < 0.001) but IL-4, -5, -9 and SCF expression decreased (P < 0.001) in the infected control group (fig. 6). In contrast, IFN-γ and TGF-β decreased in HNA, MOE and MOE + HNA groups (P < 0.001) in comparison with the infected control. For other cytokines, such as IL-4, -5 and SCF, mRNA expression increased significantly (P < 0.001). For IL-9, MOE + HNA showed higher significance (P < 0.001) than either MOE or HNA alone (P < 0.01).
Effect of HNA, MOE or MOE + HNA on intestinal mRNA expression of IL-4, IL-5, IL-9, IFN-γ, SCF and TGF-β. Compared to the non-infected group, the infected group showed a decrease (P < 0.001) in IL-4, -5, -9 and SCF expression and an increase (P < 0.001) in IFN-γ and TGF-β. In relation to the infected group, treated groups indicated significant increases in IL-4, -5, -9 and SCF, and decreases in IFN-γ and TGF-β. # and * represent statistical P values for infected versus non-infected, and treated versus infected groups, respectively.

Discussion
MOE has been known as an anti-inflammatory medicinal plant because it could reduce pro-inflammatory mediators released by lipopolysaccharide-activated macrophages (Fard et al., Reference Fard, Arulselvan, Karthivashan, Adam and Fakurazi2015). It has also been found to increase cellular immunity against viral infection through increased production of IFN-γ (Kurokawa et al., Reference Kurokawa, Wadhwani, Kai, Hidaka, Yoshida, Sugita, Watanabe, Matsuno and Hagiwara2016).
In this study, MOE has been tested alone or in combination with HNA against H. nana infection in mice. MOE showed protective effects against infection through reduced adult worm and egg counts in the intestine and faeces, respectively. The results of immunization using MOE + HNA, compared to HNA, could indicate that MOE is a useful and protective mucosal adjuvant. This could be assigned to the anti-inflammatory and anti-oxidant effects of MOE. In addition, increased levels of IgA and modulation of cytokine responses to the infection were also found. MOE could obviously reduce alterations in intestinal histology caused by H. nana infection because of reduced adult worm counts and associated inflammatory reactions/oxidative stress. This plant extract was found previously to be a protective treatment against coccidian parasite infections (Ola-Fadunsin & Ademola, Reference Ola-Fadunsin and Ademola2013; Kifleyohannes et al., Reference Kifleyohannes, Terefe, Tolossa, Giday and Kebede2014). In vitro treatments were also effective against Trypanosoma and Leishmania parasites (Mekonnen et al., Reference Mekonnen, Yardley, Rock and Croft1999; Singh et al., Reference Singh, Paul, De and Chakraborti2015). Groups of mice treated with MOE or MOE + HNA could show relatively normal histological structures compared to HNA-treated groups. This could be a result of MOE treatment, due to the high percentage reductions in adult worm and egg counts after MOE treatments rather than HNA alone. Histological observations were also consistent with reduced and increased numbers of MMCs and GCs, respectively, after MOE compared to HNA treatments. Moreover, increased levels of intestinal wash IgA were found obviously in MOE alone or as adjuvant, and not in HNA treatments. Intestinal mastocytosis was found to increase during the response of mice to Hymenolepis infections, accompanied by GC hyperplasia (Starke & Oaks, Reference Starke and Oaks2001). Indeed, the contribution of MMCs to adult worm expulsion was controversial (McLauchlan et al., Reference McLauchlan, Roberts, Loxton, Wastling, Newlands and Chappell1999; Ishih & Uchikawa, Reference Ishih and Uchikawa2000). In the current study, MOE could reduce the MMC numbers and adult worms. This could lead to the conclusion that MMCs are not required for expulsion of adult worm (Featherston et al., Reference Featherston, Wakelin and Lammas1992). In contrast, the decrease in the number of GCs of infected controls was reversed after MOE treatments and was also confirmed by increased MUC2 expression. This could explain the mechanism of worm expulsion (Webb et al., Reference Webb, Hoque and Dimas2007). Both AB and PAS stains were used, to stain acid and neutral mucus, respectively (Adams & Dilly, Reference Adams and Dilly1989), to exclude the possibility of mucus extrusion from GCs rather than changes in cell numbers. Nevertheless, a change from neutral to acidic mucins together with alteration of terminal sugars in GCs was observed around the time of worm expulsion (Ishikawa et al., Reference Ishikawa, Horii and Nawa1993). The mechanisms for the protective role of mucins against infectious agents include parasite trapping in the mucus and inhibition of both parasite motility and feeding capacity (Khan & Collins, Reference Khan and Collins2004; Ishiwata & Watanabe, Reference Ishiwata and Watanabe2007). Intestinal IgA increased significantly in both MOE and MOE + HNA treatments, and this was consistent with higher reduction percentages in both adult and egg counts. Thus, IgA might also play a role in adult worm expulsion (Matsuzawa et al., Reference Matsuzawa, Abe, Shirakura, Zhao and Nakamura2008).
HNA could increase MUC2 expression but not GC number. Thus, the test for MUC2 expression showed that oral immunization with HNA was protective against infection by increased MUC2 expression independently of GC count. Mucin hypersecretion was found to be an important component of the innate immune system against gastrointestinal infection in IL-4-deficient mice (Shekels et al., Reference Shekels, Anway, Lin, Kennedy, Garside, Lawrence and Ho2001). However, in the current study, IL-4 and other cytokines, such as IL-5, -9 and SCF, were associated with increased mucin production.
Experimental infection with H. nana was associated with increased oxidative stress, as revealed by increased TBARS and iNOs expression versus decreased GSH. However, immunization with HNA could reduce such oxidative stress. Previously, oxidative stress was also found to increase after H. diminuta infection, but anti-oxidant activity of the worms against host oxidative stress was also found (Czeczot et al., Reference Czeczot, Skrzycki, Majewska-Wierzbicka, Podsiad, Salamatin and Grytner-Ziecina2013). Moreover, the reduction of oxidative stress after HNA injection could also be referred to the existence of anti-oxidant enzymes in strobilae (Skrzycki et al., Reference Skrzycki, Majewska, Podsiad, Czeczot, Salamatin, Twarowska and Grytner-Zięcina2011). Similarly, MOE could also have an anti-oxidant effect and inhibited iNOs expression, while MOE + HNA could show a synergetic effect. Generally, the anti-oxidant and iNOs inhibition effects for MOE were reported previously (Sinha et al., Reference Sinha, Das, Datta, Ghosh and Dey2012; Lee et al., Reference Lee, Jeong, Lee, Park, Chae, Chung, Chang, Kim, Choi, Kim, Moon and Chang2013). These results were also consistent with decreased IFN-γ expression.
Although MOE and HNA + MOE could increase the levels of IgA in both serum and intestinal washes, HNA was effective only in serum samples. This could also explain the higher protective effects of MOE or MOE + HNA against infection, compared to HNA. The IgA response was found to be associated with secondary infection and essential for resistance (Murray et al., Reference Murray, Foster and Passmore1984). Obviously, the increased IgA levels were consistent with increased mRNA expression of IL-4, -5, -9 and SCF, but not IFN-γ, TGF-β or MMC counts. Although intestinal IgA production was shown previously to depend on TGF-β (Kaneko et al., Reference Kaneko, Akiyama, Takimoto and Kumazawa2005), treatment with MOE seemed to have a different mechanism. This illustrated a predominance of protective T-helper cell type 2 (Th2) immune cytokines which elicited IgA levels (Fonseca-Coronado et al., Reference Fonseca-Coronado, Ruiz-Tovar, Pérez-Tapia, Mendlovic and Flisser2001; Artis, Reference Artis2006). Unlike IL-4, -5, -9 and SCF, the decreased IFN-γ and TGF-β response was consistent with decreased numbers of MMCs. This can be attributed predominately to the essential role of TGF-β in the regulation and differentiation of MMCs in mice and humans (Wright et al., Reference Wright, Brown, Knight, Thornton, Kilshaw and Miller2002; Gebhardt et al., Reference Gebhardt, Lorentz, Detmer, Trautwein, Bektas, Manns and Bischoff2005; Pemberton et al., Reference Pemberton, Brown, Wright, Knight and Miller2006). This also illustrated an MMC-independent IgA response to infection. In the human intestine, IFN-γ was found to increase MMC proliferation and decrease apoptosis (Sellge et al., Reference Sellge, Barkowsky, Kramer, Gebhardt, Sander, Lorentz and Bischoff2014). The findings of the current study could also clarify that the decreased IFN-γ expression was consistent with a decreased MMC count after MOE treatment.
Increased production of IL-5 has been found to be related to decreased worm fecundity (Ovington et al., Reference Ovington, McKie, Matthaei, Young and Behm1998), while SCF production was enhanced by intestinal smooth muscle as a response against infection (Morimoto, Reference Morimoto2011). These cytokines, together with IL-4 were reported previously as good proliferating agents for intestinal mast cells (Lorentz et al., Reference Lorentz, Wilke, Sellge, Worthmann, Klempnauer, Manns and Bischoff2005). The ability of MOE to reduce MMCs and increase the expression of these cytokines indicated that MOE could affect the cells independently of cytokines. The immune reaction against helminths has been shown to be dominated by CD4+ Th2 cytokines (e.g. IL-4, -5 and -13), which activated a battery of cell types (e.g. mast cells, eosinophils, goblet cells, B cells) and effector molecules (e.g. IgE, IgG1, complement) aimed at destroying the parasite (Finkelman et al., Reference Finkelman, Shea-Donohue, Goldhill, Sullivan, Morris, Madden, Gause and Urban1997; Hayes et al., Reference Hayes, Bancroft and Grencis2004; Persaud et al., Reference Persaud, Wang, Reardon and McKay2007). High IFN-γ production was observed during the tissue phase that follows an experimental egg infection. In contrast, a Th2 response, characterized by IL-4 and IL-5 production, was detectable during the lumenal phase (Conchedda et al., Reference Conchedda, Bortoletti, Gabriele, Wakelin and Palmas1997). Indeed, polarization of the Th response towards either Th1 or Th2 relies on conditions such as mouse strain, genetic factors, route of antigen administration and parasite-derived influence. This may illustrate why the levels of Th2 cytokines were low in the infected compared to the non-infected group in the present study.
Taken together, MOE was an anti-inflammatory plant extract that could induce protection against H. nana infection due to some obvious mechanisms, including polarization of the immune response toward Th2. It could increase GC number, MUC2 expression, IgA level and cytokine (IL- 4, -5, -9 and SCF) expression. Conversely, it could significantly reduce MMC numbers, IFN-γ and TGF-β. Compared to immunization with HNA, MOE as an adjuvant with HNA achieved higher reduction percentages of adult worms and eggs.
Acknowledgements
Professor Dr Rasha Rashad, Professor of Molecular Cell Biology, Zoology Department, Faculty of Science, Beni-Suef University is acknowledged for her great help in the staining of intestinal sections. The authors contributed equally to the article.
Financial support
The authors would like to express their sincere appreciation to Post Graduate Studies and Research Sector, Faculty of Science, Beni-Suef University, for supporting and funding the research project unit.
Conflict of interest
None.
Ethical standards
The authors assert that all procedures contributing to this work comply with the ethical standards of the relevant national guides on the care and use of laboratory animals and has been approved by the institutional committee (Zoology Department, Faculty of Science, Beni-Suef University).