I. INTRODUCTION
Considerable efforts have been dedicated to explore the deformation mechanisms of vertically aligned carbon nanotube (VACNT) forests, in part motivated by their wide range of potential applications in areas such as energy dissipation devices, electrical interconnects, thermal interface materials, microelectromechanical systems, and microelectronics.Reference McCarter, Richards, Mesarovic, Richards, Bahr, McClain and Jiao1–Reference Cho, Richards, Bahr, Jiao and Richards6 To date, instrumented indentation has been a common method for testing the mechanical behavior of VACNT films on substrates. However, due to the limitations of the displacement actuators, most of the existing studies are limited to shallow indentation depths (and strains), varying from a few hundred nanometers to several micrometers. Additionally, while VACNT forest films may have millimeter-sized lateral and vertical dimensions, they are composed of individual nanotubes with diameters in the nanometer range, which drives their mechanical response to be distinct from monolithic materials. Hence, the accurate estimation of the contact area between the VACNT film and the commonly used parabolicReference Waters, Guduru, Jouzi, Xu, Hanlon and Suresh7, Reference Pathak, Cambaz, Kalidindi, Swadener and Gogotsi8 and pyramidalReference Waters, Guduru, Jouzi, Xu, Hanlon and Suresh7 indenter tip geometries, necessary for indentation data analysis, poses a significant challenge.
In this work, we utilize flat-punch diamond indenter tips, resulting in a constant contact area with the sample, to conduct large displacement indentations into VACNT films grown using atmospheric pressure chemical vapor deposition (APCVD). Using both on-edge in situ and in-bulk ex situ flat-punch indentations, we examine the combined quantitative information (load–displacement) along with the concomitant morphological changes. To explore the effect of lateral boundary constraints, these findings are compared with our previous reportReference Pathak, Lim, Pour Shahid Saeed Abadi, Graham, Cola and Greer9 on uniaxial compressions of the same APCVD-grown VACNTs patterned into cylindrical bundles.
Mechanical response of VACNTs is a complex phenomenon occurring across multiple length scales due to its hierarchical structure. The collective behavior of these materials is expected to rely heavily on the properties of the individual carbon nanotubes (CNTs), as well as on the variations in the collective intertube interactions and inherent property gradients of the microstructure, which in turn are dictated by their synthesis techniques.Reference Kumar and Ando10–Reference Hutchens, Needleman and Greer12 A wide range of mechanical behavior has been reported in VACNTs as a result of such variations in their microstructure. These include modulus and buckling strengths ranging from sub-MPaReference Suhr, Victor, Sreekala, Zhang, Nalamasu and Ajayan13, Reference Tong, Zhao, Delzeit, Kashani, Meyyappan and Majumdar14 to tens of MPaReference Mesarovic, McCarter, Bahr, Radhakrishnan, Richards, Richards, McClain and Jiao15–Reference Zhang, Lu, Du, Dai, Baur and Foster17 to GPa,Reference Pathak, Cambaz, Kalidindi, Swadener and Gogotsi8, Reference Deck, Flowers, McKee and Vecchio18 as well as a complete gamut of recoverability—from nearly 100% recovery even after large deformationsReference Cao, Dickrell, Sawyer, Ghasemi-Nejhad and Ajayan5, Reference Pathak, Lim, Pour Shahid Saeed Abadi, Graham, Cola and Greer9, Reference Suhr, Victor, Sreekala, Zhang, Nalamasu and Ajayan13, Reference Xu, Futaba, Yamada, Yumura and Hata19, Reference Xu, Futaba, Yumura and Hata20 to permanent distortion even at modest strains.Reference Zbib, Mesarovic, Lilleodden, McClain, Jiao and Bahr2, Reference Hutchens, Hall and Greer11, Reference Zhang, Lu, Du, Dai, Baur and Foster17, Reference Cao, Reiner, Chung, Chang, Kao, Kukta and Korach21, Reference Maschmann, Qiuhong, Feng, Liming and Baur22 Such drastic differences in properties make it impractical to compare VACNTs synthesized by nonidentical growth techniques. In this work we focus on VACNTs grown by APCVD techniqueReference Pour Shahid Saeed Abadi, Hutchens, Taphouse, Greer, Cola and Graham23 and describe their response under indentation. These results are contrasted with our previous work on uniaxial compressions of 30 μm diameter ×30 μm tall cylindrical bundles.Reference Pathak, Lim, Pour Shahid Saeed Abadi, Graham, Cola and Greer9 The APCVD VACNT bundles are known to exhibit three distinct regimes in their compressive stress–strain curves: (i) a short initial elastic section, followed by (ii) a sloped plateau with characteristic wavy features corresponding to localized buckle formation, and (iii) a densification characterized by a rapid stress increase—all of which liken their deformation to that of a typical foam.Reference Cao, Dickrell, Sawyer, Ghasemi-Nejhad and Ajayan5, Reference Pathak, Lim, Pour Shahid Saeed Abadi, Graham, Cola and Greer9, Reference Hutchens, Hall and Greer11 Unlike foams, however, the compressive strain in VACNTs is accommodated entirely via the formation of localized folds or buckles forming progressively along their lengths.Reference Cao, Dickrell, Sawyer, Ghasemi-Nejhad and Ajayan5, Reference Hutchens, Hall and Greer11, Reference Qiu, Bahr, Zbib, Bellou, Mesarovic, McClain, Hudson, Jiao, Kiener and Cordill16, Reference Maschmann, Qiuhong, Feng, Liming and Baur22, Reference Maschmann, Zhang, Wheeler, Du, Dai and Baur24, Reference Bradford, Wang, Zhao and Zhu25 During compression of our particular APCVD VACNT system, such localized buckles fully recovered upon load release even from relatively large strains of 60–80% (i.e., the onset of densification) under fast displacement rates of 1000 nm/s. In addition, repeated cycling also revealed a distinctive hysteresis behavior for the VACNT bundle in compression, suggesting energy dissipation in every cycle.Reference Pathak, Lim, Pour Shahid Saeed Abadi, Graham, Cola and Greer9 However, since these properties were mainly documented for short height APCVD VACNTs under uniaxial compression, it is still largely unknown whether they demonstrate similar lucrative mechanical properties under different loading and boundary conditions.
In this work, we focus on the deformation response of 142-μm-tall APCVD-grown VACNT films under large displacement flat-punch indentations and compare it with that of uniaxial compressions of ∼30 × 30 μm (height × diameter) cylindrical pillars patterned into the same starting material. Thus, we directly compare the influence of the boundary conditions posed by the presence or absence of the external matrix. We use both an in situ nanoindentation methodology to observe the on-edge deformation in real time using a custom-built in situ nanomechanical deformation instrument, SEMentor,Reference Kim and Greer26 as well as more traditional ex situ indentation methods. Recent work by our groupReference Pathak, Lim, Pour Shahid Saeed Abadi, Graham, Cola and Greer9, Reference Hutchens, Hall and Greer11, Reference Pour Shahid Saeed Abadi, Hutchens, Taphouse, Greer, Cola and Graham23 and othersReference Qiu, Bahr, Zbib, Bellou, Mesarovic, McClain, Hudson, Jiao, Kiener and Cordill16, Reference Maschmann, Zhang, Wheeler, Du, Dai and Baur24 showed the efficacy of conducting in situ compressions inside the scanning electron microscope (SEM), which allows for uninterrupted observation of the real-time evolution of deformation morphology while simultaneously recording load versus displacement data. Unlike compression experiments, where the indenter tip applies an axial load to an individual structure readily visible in SEM, in situ indentation experiments have to be conducted on the edge of the sample, as opposed to in bulk, to facilitate uninhibited inspection of the material cross section.Reference Pour Shahid Saeed Abadi, Hutchens, Taphouse, Greer, Cola and Graham23 Although boundary conditions and constraints associated with such on-edge tests are different from those during in-bulk indentations, they are instrumental in providing useful information on morphological evolution in deforming VACNTs, not easily obtainable by other methods.
II. MATERIALS AND METHODS
A. CNT growth
VACNT films with thicknesses between 25 and 142 μm were grown using APCVD technique in a commercial chemical vapor deposition (CVD) system (Black Magic Pro 4″; Aixtron SE, Herzogenrath, Germany) as described in detail in Ref. Reference Pour Shahid Saeed Abadi, Hutchens, Taphouse, Greer, Cola and Graham23. A trilayer catalyst of Ti (30 nm)/Al (10 nm)/Fe (3 nm) was deposited by electron beam evaporation on Si substrates to seed the growth of the VACNT films. A gas mixture of 160/100/7500 sccm of C2H2/H2/N2 was used to maintain the chamber pressure at 750 mbar during growth, which occurred at ∼750 °C. Multiwall CNTs, with an average diameter of 8.8 ± 2.1 nm (average ± standard deviation) and average mass density (CNT mass divided by volume) of ∼80 mg/cm3, were produced by this process.Reference Pour Shahid Saeed Abadi, Hutchens, Taphouse, Greer, Cola and Graham23
B. Ex situ indentation tests
Two different VACNT films with thicknesses of ∼142 and 25 μm were selected for large displacement cyclic indentation tests. The indentation experiments were performed using the XP module of Agilent’s nanoindenter G200 (Santa Clara, CA) with adjustable software control methods as described in Ref. Reference Hutchens, Hall and Greer11. Tests were performed in air using a custom-made cylindrical diamond flat punch with ∼120 μm diameter and ∼80 μm height. For the 142-μm-thick VACNT sample, indentations were performed under a constant displacement control to varying indentation depths up to a maximum penetration depth of around 70 μm (restricted by the height limitations of the diamond flat punch). For the thinner samples, the maximum depth was limited to 90% of the film thickness. Tests were conducted in the interior of the samples (i.e., away from the sample edge) at three different constant displacement rates: 10, 100, and 1000 nm/s. Typically, five unload–reload cycles were performed at each displacement level. No hold time was applied at the maximum loads to maintain the cyclic nature of the tests. Minimum of 10 tests were conducted at each displacement rate. The indents were spaced at least 500 μm apart to eliminate any possible proximity effects.
C. In situ SEM indentation experiments
To visualize the morphological changes in the VACNT samples during indentation and correlate them with the concurrent load–displacement data, in situ tests were conducted in a custom-built mechanical deformation instrument, SEMentor,Reference Kim and Greer26 composed of a nanomechanical dynamic contact module (Agilent Corp., Santa Clara, CA) inside a SEM (Quanta 200; FEI, Hillsboro, OR). Tests in SEMentor were conducted with a conductive diamond flat punch with a rectangular flat cross section of ∼60 × 80 μm. The loading axis in SEMentor is inclined at ∼86° with respect to the electron beam, thus allowing continuous observation of the deformation morphology of the VACNT film cross section during the on-edge in situ experiments. Importantly, the outer constraints in on-edge indentations are different from those during in-bulk tests, and therefore, their stress–strain behavior is expected to be different, as well. SEM observations were recorded as a video file at 30 frames/s capture rate and synchronized with the indentation data to provide a real-time correlation between each video frame and the corresponding position on the load–displacement curve (see video files S1 and S2, shown at 15 and 10 times their original speeds, respectively, in the supporting online material). SEMentor tests were conducted to a maximum penetration depth of 30 μm (instrument limit). In addition, while nominally the experiments performed in both G200 and SEMentor are identical, one notable difference is that SEMentor tests are conducted in a vacuum environment while those in G200 are conducted in air. Further, in SEMentor experiments, the samples are constantly exposed to the electron beam, and they are oriented horizontally such that gravity is acting perpendicularly to the compression axis. Due to these subtle differences between the two instruments, the SEMentor-generated results were used only for visualization purposes in this study, while all data analyses were performed on tests conducted in air in the G200 nanoindenter.
D. Data analysis
The applied load, P, and measured displacement, h, were corrected for machine compliance following the procedure outlined in detail in Ref. Reference Hutchens, Hall and Greer11. We assumed negligible friction between the indenter sidewalls and the VACNT matrix—a reasonable approximation based on previous reports.Reference Tu, Jiang, Guo and Fu27, Reference Tu, Zhu, Hou and Guo28 The initial loading portion in a typical flat-punch indentation experiment often suffers from misalignment issues between the indenter tip and the sample surface requiring special care in reliable extraction of useful properties. On the other hand, applying the Hertzian contact model to the initial unloading segment of the measured load–displacement curve permits a reasonable estimation of the Young’s modulusReference Johnson29, Reference Oliver and Pharr30:
 $$E_{{\rm{eff}}} = {{\sqrt {\rm{\pi }} } \over 2}{S \over {\sqrt A }}\, = \,{S \over {2a}},\,\,\,\,\,\,\,\,\,\,\,\,{1 \over {E_{{\rm{eff}}} }}\, = \,{{1 - \nu _s^2 } \over {E_s }}\, + \,{{1 - \nu _i^2 } \over {E_i }},$$
where E eff denotes the effective modulus of the combined indenter–specimen system, S(=dP/dh) is the stiffness measured from the slope of the initial 30% of the unloading load–displacement curve, v and E are the Poisson’s ratio and the Young’s modulus, respectively, and the subscripts s and i refer to the specimen and the indenter, respectively. Following the common nanoindentation protocols, we chose the modulus of 1041 GPa and Poisson’s ratio of 0.07 for the diamond indenter tip. Since the APCVD-grown VACNT bundles have been shown to exhibit foam-like deformation with minimal lateral expansion under compressive load,Reference Pathak, Lim, Pour Shahid Saeed Abadi, Graham, Cola and Greer9 we assume a vanishing Poisson’s ratio of v = 0 for the VACNTs as has also been suggested previously.Reference Deshpande and Fleck31 We note that this choice may be an approximation since the deformation in VACNTs is highly localized. However, the error introduced is not expected to be significant since the accuracy of Es depends only weakly on v [see Eq. (1)]; e.g., a change in v from 0 to 0.3 causes only a 5.3% error in Es.
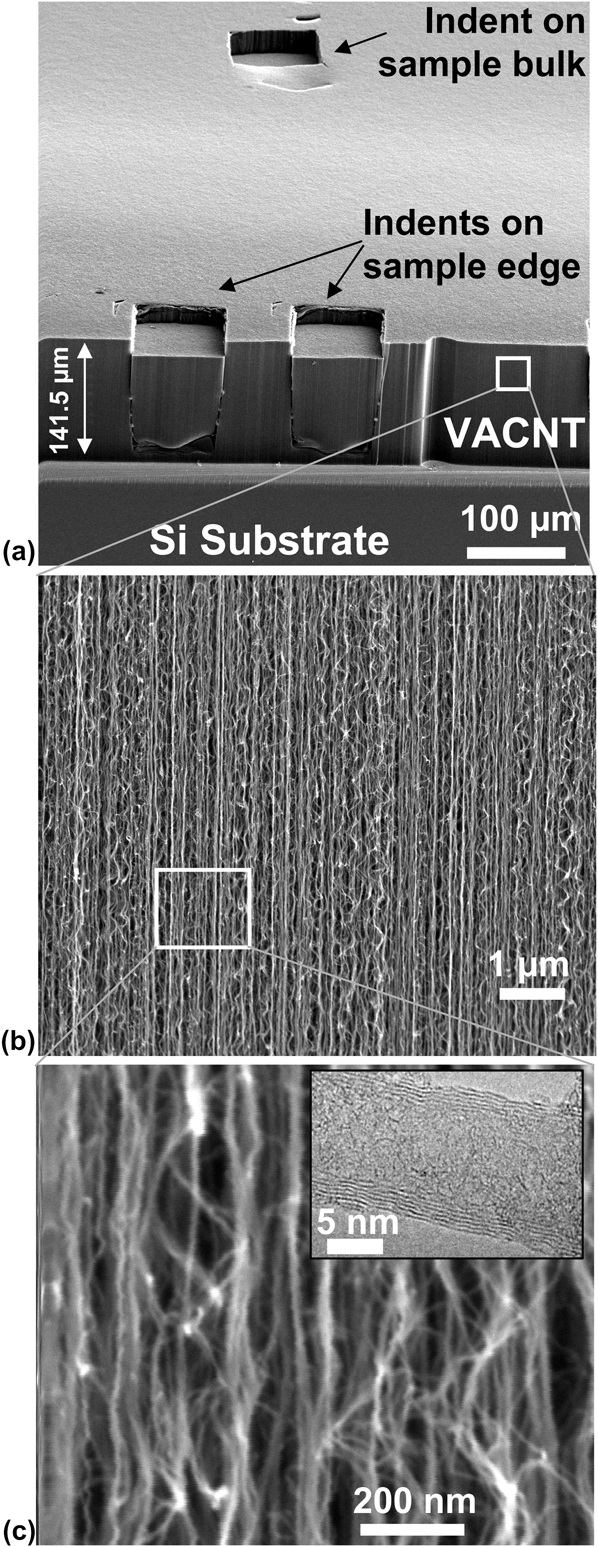
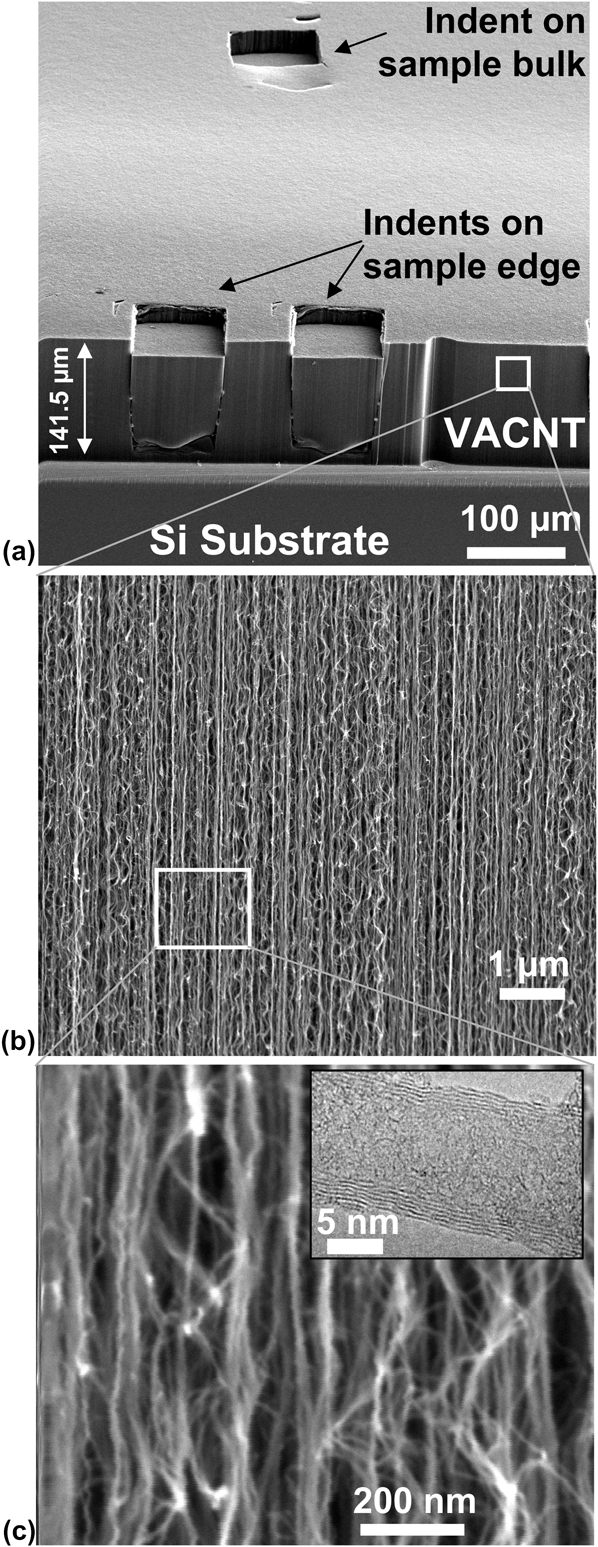
We also note that Eq. (1) treats the overall material behavior as that of an isotropic continuum medium, according to the inherent assumptions of the Hertz’s theory. VACNTs, on the other hand, demonstrate varying degrees of anisotropy at each level of its hierarchical microstructure (see Fig. 1), rendering our calculations of indentation moduli an approximation rather than an exact value. Nevertheless, isotropic continuum framework has been previously utilized in developing the constitutive relations in VACNTsReference Hutchens, Hall and Greer11 and foamsReference Deshpande and Fleck31 and appears to have accurately captured the qualitative features of outer deformation profile and the stress–strain curves. Despite the discrete constituents and apparent vertical alignment at low magnification, the continuum foundation was motivated by the nearly isotropic network of CNTs as revealed by images at or above magnifications of 240,000x [Fig. 1(c)] and above.
SEM images reveal the hierarchical morphology of the (a) 141.5-μm-thick VACNT films (magnification 260x), which consist of (b) nominally vertical aligned CNTs visible at a lower magnification of 30kx, and (c) a complex intertwined network seen at higher magnifications of 240kx. SEM pictures are taken at a 60° tilt angle. (c inset) Individual multiwalled CNTs of outer diameter 8.8 ± 2.1 nm (average ± standard deviation) are visible in the TEM image.
We define the percentage recovery (R) as the displacement recovered at the end of each cycle with respect to the maximum displacement, i.e., 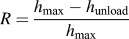 $R = {{h_{\max } - h_{{\rm{unload}}} } \over {h_{\max } }}$, where h max is the maximum displacement at the end of loading and h unloadis the displacement after unloading to 10% of the maximum load in each cycle.
The loss coefficient, η (a dimensionless quantity), measures the degree to which a material dissipates energy and is calculated asReference Ashby32:
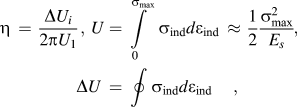 $${\rm{\eta }}\, = \,{{\Delta U_i } \over {2{\rm{\pi }}U_1 }},\,\,U = \int\limits_0^{{\rm{\sigma }}_{\max } } {{\rm{\sigma }}_{{\rm{ind}}} d{\rm{\varepsilon }}_{{\rm{ind}}} \, \approx \,{1 \over 2}{{{\rm{\sigma }}_{\max }^2 } \over {E_s }}} ,\,\,\Delta U\, = \,\oint {{\rm{\sigma }}_{{\rm{ind}}} d{\rm{\varepsilon }}_{{\rm{ind}}} } ,$$
where U 1 is the elastic energy stored in the material when it is loaded elastically to a stress σmax in the 1st cycle and ΔUi is the energy dissipated in the ith load–unload cycle [see Fig. 5(d)].
To compare the indentation response of VACNTs to its stress–strain behavior under compression, we define the average indentation stress (σind) and strain (εind) under a flat-punch cylindrical indenter of contact diameter 2a and contact area A as given below.Reference Hill33 In Eq. (3), the indentation response is assumed to free of any substrate effects:
 $${\rm{\sigma }}_{{\rm{ind}}} = {P \over A} = {P \over {{\rm{\pi }}a^2 }},\quad \quad {\rm{\varepsilon }}_{{\rm{ind}}} = {h \over {2a}}.$$
E. Viscoelastic characterization
The viscoelastic properties of the VACNT film were measured following the procedure outlined in Ref. Reference Hutchens, Hall and Greer11. In this method, the indenter is loaded into the sample in air at a constant displacement rate of 100 nm/s up to a specified indentation depth where the indenter head is oscillated at ∼8 nm amplitude across a range of frequencies from 1 to 50 Hz. The cutoff frequency of 50 Hz is dictated by the instrumental limit, as detailed in Refs. Reference Hutchens, Hall and Greer11 and Reference Herbert, Oliver and Pharr34. The procedure was repeated at seven different constant indentation depths: from 5 to 70 μm.
Viscoelastic materials are commonly characterized by their storage (E′) and loss (E″) moduli, where the former represents the stored energy or the elastic response and the latter corresponds to the amount of energy dissipated, or the viscous response, as well as their ratio—tanδ. Assuming linear viscoelastic behavior, these terms can be computed following the calculations described in Refs. Reference Herbert, Oliver and Pharr34–Reference Wright and Nix37 as follows:
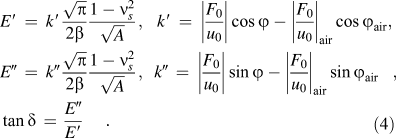 $$\eqalign{ & E′\, = \,k′{{\sqrt {\rm{\pi }} } \over {2{\rm{\beta }}}}{{1 - \nu _s ^2 } \over {\sqrt A }},\,\,\,\,k′\, = \,\left| {{{F_0 } \over {u_0 }}} \right|\cos \varphi - \left| {{{F_0 } \over {u_0 }}} \right|_{{\rm{air}}} \,\cos \varphi _{{\rm{air}}} , \cr & E″\, = \,k″{{\sqrt {\rm{\pi }} } \over {2{\rm{\beta }}}}{{1 - \nu _s ^2 } \over {\sqrt A }},\,\,\,k″\, = \,\left| {{{F_0 } \over {u_0 }}} \right|\sin \varphi - \left| {{{F_0 } \over {u_0 }}} \right|_{{\rm{air}}} \,\sin \varphi _{{\rm{air}}} , \cr & \tan {\rm{\delta }}\, = \,{{E″} \over {E′}}. } $$
Here, k′ and k″ are the storage and loss stiffnesses of the sample, obtained by finding the real and complex parts, respectively, of the stiffness differences between oscillating the indenter head on the sample at a fixed displacement and in air at the same raw displacement, and β is a constant (=1 for a flat-punch indenter). F 0 and u 0 are the load and displacement oscillation amplitudes, respectively, and ϕ is the phase angle between the load and displacement oscillations. We note that the accuracy in the values of E′ and E″ in Eq. (4) can be affected by several factors: uncertainties in Poisson’s ratio, since it may be frequency dependent, and ambiguity in contact area, especially at shallower indentation depths, where full contact may not have been established. On the other hand, calculation of tanδ is independent of the contact area and thus is ideally suited as a measure of the viscoelasticity of the indented material.Reference Pathak, Cambaz, Kalidindi, Swadener and Gogotsi8, Reference Pathak, Gregory Swadener, Kalidindi, Courtland, Jepsen and Goldman38
III. RESULTS AND DISCUSSION
A. VACNT microstructure
Figure 1 shows the SEM and transmission electron microscopy (TEM) images at different magnifications of a ∼142-μm-thick VACNT film on a Si substrate grown using the APCVD synthesis technique (see Sec. II). All SEM images [Figs. 1(a)–1(c)] were taken at a 60° tilt to visualize both top and edge surfaces of the sample. These figures show the complex hierarchical nature of the VACNT microstructure with their distinct organizational details across multiple length scales. Thus, while the VACNT appears as a continuous film at lower magnifications of 260x [Fig. 1(a)], the nominally vertical alignment of CNTs growing perpendicularly to the support substrate in the VACNT bundle becomes visible at a higher magnification of 30,000x [Fig. 1(b)]. Increased magnification of 240,000x reveals significant intertwining in the long curved lengths of individual CNTs, revealing the isotropic CNT network.Reference Hutchens, Hall and Greer11, Reference Hutchens, Needleman and Greer12, Reference Deshpande and Fleck31 As a result, in their as-grown states, certain segments of the CNT forest appear to be prebuckled/prebent, and the favorable contact energy between the tubes (van der Waals) is thought to balance the bending strain energy of their arrangement, resulting in a stable low energy configuration.Reference Mesarovic, McCarter, Bahr, Radhakrishnan, Richards, Richards, McClain and Jiao15 The diameters of the individual multiwalled (3–6 walls) CNTs (8.8 ± 2.1 nm) are visible at the nanometer length scale shown in the TEM image in Fig. 1(c) inset. Such hierarchy in the VACNT microstructure governs its overall mechanical behavior, which is a result of not only the properties of individual CNTs but also of their complex mutual interactions and distribution throughout the array.
Figure 1(a) shows the residual imprints of indentations (indicated by arrows): one ex situ, performed in the interior of the sample away from the edges, and two in situ indentations, performed on a sample edge inside the SEMentor using a rectangular ∼60 × 80 μm flat punch (see Sec. II). As can be seen clearly from this image, the indentations left a significant imprint on the surface of the VACNT film, suggesting marginal postmortem elastic recovery. This is in contrast with the nearly full recoverability exhibited by the same VACNTs patterned into micrometer-sized bundles and compressed to the same nominal strain.Reference Pathak, Lim, Pour Shahid Saeed Abadi, Graham, Cola and Greer9 This permanent shape change underneath the indenter appears to have occurred along the vertical edges via a single shear offset (see also Fig. 3). Notably, although the two indents on the sample edge shown in Fig. 1(a) are only 60 μm apart from one another, we see no evidence of any influence of the earlier (left) indent on the latter (right). This observation suggests that the lateral extent of the plastic zone size in VACNTs under the indenter is much narrower as compared with the rounded continuum indentation stress field contours spanning the regions as far as one indenter diameter away from the flat-punch indenter tip in monolithic materials.Reference Fleck, Otoyo and Needleman39 This further underlines the importance of understanding the hierarchical nature of VACNT materials as their postindent morphological signature is clearly of nonmonolithic nature, while its stress–strain response is akin to that of an open-cell foam.
B. In situ on-edge flat-punch indentations
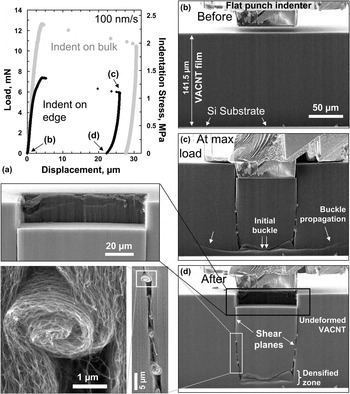
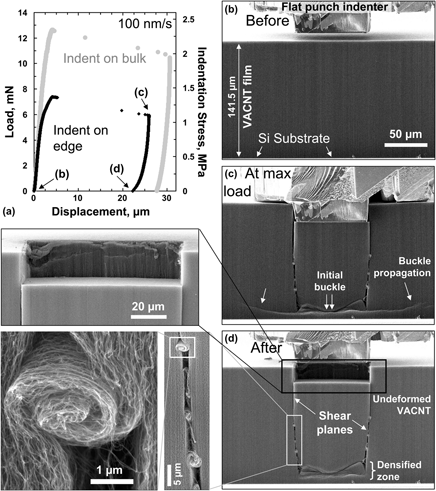
To correlate the morphological changes underneath the indenter with the details of the indentation load–displacement curve, a series of in situ indentations were performed in SEMentor using the procedures described in Sec. II. Figure 2(a) shows two representative load–displacement curves, with the respective indentation stress values plotted on the secondary y axis. These correspond to two of the three indentations shown in Fig. 1: one on the edge and another in the sample interior. Both tests were performed at a nominal displacement rate of 100 nm/s. This plot indicates that while the curves are similar in shape, the on-edge regions deform at significantly lower loads than in-bulk locations at equivalent indentation depths. This result is not surprising due to the less restrictive boundary conditions in the on-edge setup. In both cases, the load first increases steeply up to an instability manifested by a large displacement burst of ∼20 μm, after which the indenter tip is unloaded [Fig. 2(a)]. Video frames from the indent-on-edge setup are provided in supporting online video (file S1), with several representative snapshots shown in Figs. 2(b)–2(d). As revealed by these images, the first buckle marked by double arrows in Fig. 2(c) forms close to the substrate during the initial loading at the load of ∼6 mN. This buckle is initially observed only in the region just underneath the indenter tip—the lateral features outside of this region marked with single arrows appear after the displacement burst (see supporting online video S1). Interestingly, the first buckle location was always ∼9 μm above the substrate. Other tests on VACNT samples of different film thicknesses have also shown a similar response where the first buckle invariably formed close to the bottom substrate.Reference Pour Shahid Saeed Abadi, Hutchens, Taphouse, Greer, Cola and Graham23 This indicates that the presence of a stiff substrate results in localized buckle formation under both compressionReference Cao, Dickrell, Sawyer, Ghasemi-Nejhad and Ajayan5, Reference Pathak, Lim, Pour Shahid Saeed Abadi, Graham, Cola and Greer9, Reference Hutchens, Hall and Greer11, Reference Qiu, Bahr, Zbib, Bellou, Mesarovic, McClain, Hudson, Jiao, Kiener and Cordill16, Reference Maschmann, Qiuhong, Feng, Liming and Baur22 and nanoindentation.
(a) Comparative indentation load (and stress)–displacement curves at 100 nm/s loading rate of in situ SEM indentation tests conducted on the sample edge versus in the interior of the sample using a 60 × 80 μm rectangular flat-punch indenter. (b, c, and d) For the indent on edge, the indentation process was recorded as a video file from which individual picture frames were extracted corresponding to a particular event during the loading–unloading cycle (as indicated on the load–displacement graph). The double arrows in (c) mark the initiation of the first buckle at a load of around 6 mN. The wide lateral buckles marked by single arrows are formed after the first buckle and increase in size with loading. (d) Upon unloading, these lateral buckles disappear. (d inset top) The large displacement burst results in a vertical shear of the VACNT structure along the indenter edges. Note the clean edge of the shear wall. (d bottom insets) The shear appears to have been carried by a series of CNT “microrollers,” which act as effective lubricants protecting the rest of the VACNT structure from further damage. All SEM images except the bottom two insets for (d) were taken at 86° tilt angle. The bottom two insets for (d) were at 60° tilt angle.

Upon further loading the buckle extends laterally [region marked with the single arrows in Fig. 2(c)] until the load of ∼7.3 mN, where a sudden and extensive displacement burst of ∼20 μm occurs. SEM images obtained immediately after this burst (video capture frame rate was not fast enough to catch the details during the instantaneous burst) reveal that a portion of VACNT film sheared off nearly perfectly vertically along the edges of the indenter tip [Fig. 2(c)], and new buckle lines are visible next to the initial buckles.
Closer inspection of the sheared-off region conveys several noteworthy features. First, the deformation appears to be highly localized, occurring only at the shear offset regions and the buckles formed at the bottom of the sample. The remaining portions of the VACNT film appear completely unaffected [Fig. 2(d) top inset]. Second, the shear appears to have been carried by a series of tangled CNTs, or “microrollers,” seen in the magnified inset images in Fig. 2(d), whereby originally vertical strands of several entangled CNT collectively coiled themselves into helical structures. Three pairs of such coiled strands of CNTs can be seen on either side of the sheared region. We find the length of the coiled CNTs in each microroller to be ∼6 μm, and thus, the total displacement carried by the rollers is ∼18 μm. This distance is in reasonable agreement with the displacement burst extent of ∼20 μm shown in Fig. 2(a). We hypothesize that these microrollers provide a low-friction path during the shear process.
The shear event and the formation of the CNT microrollers [Figs. 2(c) and 2(d)] are unique characteristics seen only in the intertwined VACNT systems. Neither foams,Reference Sudheer Kumar, Ramchandra and Ramamurty40, Reference Flores-Johnson and Li41 where the deformation is confined only to regions directly beneath the indenter, nor noninteracting VACNTs,Reference Pantano, Parks and Boyce42 where such shear would propagate without any microroller formation, show the unique features seen in Fig. 2. As shown before in Fig. 1, the hierarchical design of these materials results in considerable interlinking between the individual struts. Thus, in spite of their nominally vertical structure, the CNTs along the shear plane of the VACNT film can perform as highly efficient lubricants by collectively coiling themselves and thereby carrying the shear strain in response to axial loading. The effectiveness of this “lubrication process” is evidenced by the very rapid nature of the burst and the resulting shear event under the indenter. Comparing SEM images at maximum load and after unload [Figs. 2(c) and 2(d)] shows that this shear event caused permanent damage to the material structure, as unloading the indenter tip results in minimal recovery. Upon unloading, the CNT microrollers did not uncoil, and the only observed difference in the morphology of the before and after deformation material was that the buckle contours, which extended laterally beyond the sheared block, disappeared upon unloading.
C. Ex situ in-bulk large displacement indentations
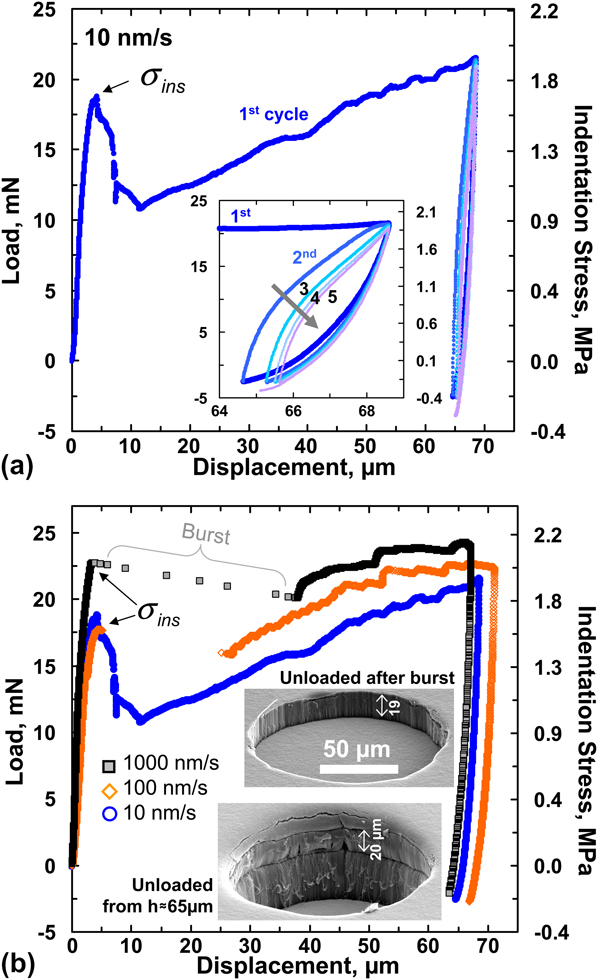
To analyze the deformation beyond the initial large burst, ex situ indentation tests were conducted in air in the Agilent G200 nanoindenter (see Sec. II) to larger depths of ∼70 μm in the interior of the as-grown VACNT film away from the edges. This maximum indentation depth was chosen based on the height of the cylindrical punch (∼80 μm) and to avoid the influence of the rigid Si substrate. Figure 3(a) shows a typical indentation load (stress)–displacement curve for a representative test conducted at the displacement rate of 10 nm/s up to a final displacement of 70 μm on the 142-μm-thick VACNT film. Similar to the compression experiments on the same VACNT system,Reference Pathak, Lim, Pour Shahid Saeed Abadi, Graham, Cola and Greer9 three distinct regions are apparent: (i) a short elastic regime, followed by a (ii) sudden instability, which results in a 40% load drop at ∼4.3-μm displacement and a subsequent (iii) sloped plateau region with a small positive slope starting at the displacement of ∼11 μm, where the load increases more gradually with displacement and contains several undulations. We calculate σins at the point of instability to be ∼1.6 MPa, a value nearly 40% below the buckling stress of ∼2.5 MPa exhibited by this material system when patterned into 30 × 30 μm, height × diameter, bundles under compression in the same instrument.Reference Pathak, Lim, Pour Shahid Saeed Abadi, Graham, Cola and Greer9 Probable causes for this difference between the indentation and compression tests are detailed in the following sections.
(a) Five load–unload cycles during indentation (in bulk) on a 141.5-μm-thick VACNT film at 10 nm/s loading rate using a 120-μm-diameter flat-punch indenter showing three distinct regimes; elastic, drop in load at a critical instability stress σins, and plateau regime. (a inset) Successive load–unload cycles to the same maximum displacement reveal a gradual drop in recovery in every cycle, suggesting progressive damage accumulation in the material. The corresponding indentation stress values are shown along the secondary y axis. (b) Indentations at different displacement rates showing a large displacement burst and more pronounced buckling signatures at the faster rates. The inset images show the residual impressions of two different indentations conducted at a rate of 100 nm/s, one when the indenter is unloaded just after the burst versus when it is unloaded from a maximum displacement of ∼65 μm. (color online)
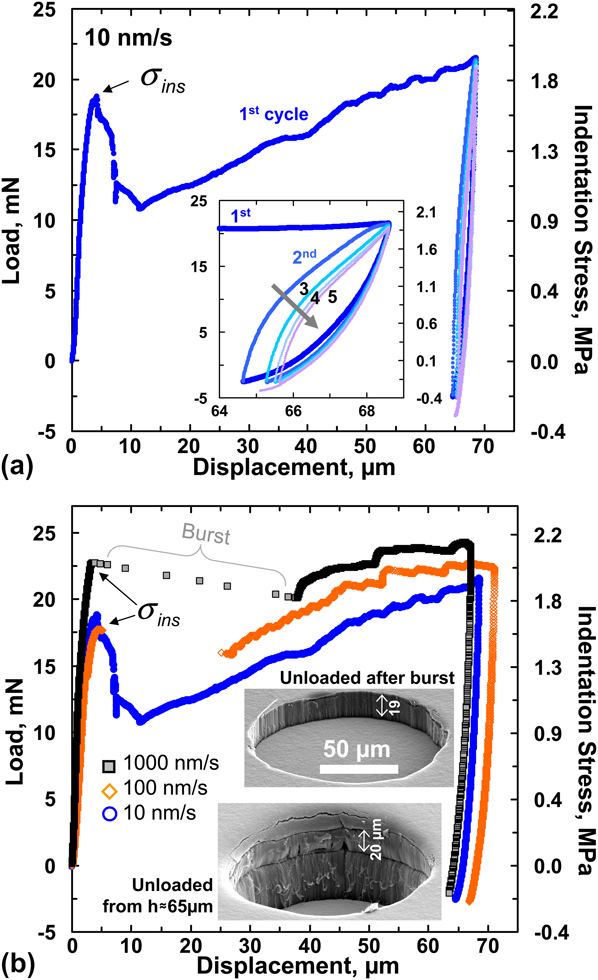
Figure 3(a) also shows the effect of unload–reload cycling and hysteresisReference Pathak, Cambaz, Kalidindi, Swadener and Gogotsi8 demonstrating that the material recovers only slightly after the first cycle, while subsequent cycling results in a substantially higher relative recovery. This renders the first cycle distinctly different from all subsequent loading cycles, as has been widely observed for CNT foams.Reference Misra, Greer and Daraio4, Reference Cao, Dickrell, Sawyer, Ghasemi-Nejhad and Ajayan5, Reference Pathak, Lim, Pour Shahid Saeed Abadi, Graham, Cola and Greer9 The inset in Fig. 3(a) shows the zoomed-in load–unload segments during cycling and indicates that both the amount of hysteresis, corresponding to the energy dissipated per cycle, and the recovered displacement after unloading diminish with each subsequent cycle. Although each cycle was specified to be unloaded to only 10% of the maximum load from the previous cycle, in some cases, the applied loads were measured as slightly negative, likely due to the adhesion between the VACNT tips and the diamond indenter.Reference Hutchens, Needleman and Greer12, Reference Mesarovic, McCarter, Bahr, Radhakrishnan, Richards, Richards, McClain and Jiao15
Several indentation load (and stress)–displacement curves for three different displacement rates are shown in Fig. 3(b). Although the general behavior across the different rates is similar in appearance, several important distinctions can be made. For example, at the faster loading rates of 100 and 1000 nm/s, there appears to be a rapid extensive displacement burst of ∼20 μm or larger immediately upon attaining σins, resulting in a temporary loss of contact between the sample and the indenter tip. The burst size appears to increase with loading rate. This is in contrast to the gradual load removal, where contact is maintained at all times, shown in the tests conducted at the slowest rate of 10 nm/s. Based on the in situ indentation tests described in Fig. 2, it appears that the burst may be caused by a rapid vertical shearing of the material directly underneath the indenter tip along the indenter edges. Indeed, when the test was stopped at the moment of the burst [top SEM image in Fig. 3(b) at 100 nm/s], we observe the formation of a large imprint of depth ∼19 μm mirroring the shape of the indenter, with the residual depth equivalent to the displacement burst. Closer inspection of the imprints indicates that the material directly underneath the indenter is mostly unperturbed, with all deformation—again—appearing to have been localized in the vertical shear region along the rim of contact between the sample and the indenter tip.
Further loading beyond the first burst is characterized by the reappearance of the sloped plateau. Such sloped plateau regions have been observed previouslyReference Pathak, Lim, Pour Shahid Saeed Abadi, Graham, Cola and Greer9, Reference Hutchens, Hall and Greer11 and were attributed to an inherent property gradient in the VACNT microstructure along its height. Current authors have reported a similar gradient to be present in APCVD VACNT films where both the CNT number and mass densities were found to vary as a function of the film height.Reference Pour Shahid Saeed Abadi, Hutchens, Taphouse, Greer, Cola and Graham23 It is, therefore, reasonable to assume that a similar density variation is present in the samples described here, resulting in the indenter punch encountering a denser, and hence stiffer, material in the deeper regions. This requires the application of a higher stress to form each successive buckle, leading to an increasing global slope in the plateau region. While the slopes of the plateau region appear to be similar among all three rates shown in Fig. 3(b), samples deformed at the faster rates sustain higher stresses, a behavior considered typical for viscoelastic solids.Reference Lakes43
The plateau region is composed of several undulations or kinks for all three loading rates. Such features have been observed previously during in situ compression experiments of 60-μm-tall VACNT bundlesReference Hutchens, Hall and Greer11 and in ex situ tests,Reference Cao, Dickrell, Sawyer, Ghasemi-Nejhad and Ajayan5, Reference Hutchens, Hall and Greer11, Reference Qiu, Bahr, Zbib, Bellou, Mesarovic, McClain, Hudson, Jiao, Kiener and Cordill16, Reference Maschmann, Qiuhong, Feng, Liming and Baur22, Reference Maschmann, Zhang, Wheeler, Du, Dai and Baur24, Reference Bradford, Wang, Zhao and Zhu25 as well as more recently by the present authors for in situ compressions of 30 × 30 μm height × diameter VACNT micropillars made from the same APCVD process.Reference Pathak, Lim, Pour Shahid Saeed Abadi, Graham, Cola and Greer9 The in situ compression studies of Hutchens et al.Reference Hutchens, Hall and Greer11 revealed that the formation of each undulation corresponded to the formation of localized folds or buckles along the pillar height, with the faster rates showing drops of larger amplitude.Reference Pathak, Lim, Pour Shahid Saeed Abadi, Graham, Cola and Greer9, Reference Hutchens, Hall and Greer11 While—unlike in compression experiments—direct observation of buckle formation is not possible during indentation in the interior of the sample, it is reasonable to assume that a similar deformation mechanism operates during flat-punch indentations. Thus, the series of load drops in the load–displacement curves likely correspond to the coordinated sequential lateral collapse events somewhere below the indenter, with the force required to cause them being much smaller than that of the initial instability.
Unloading from a depth of ∼65–70 μm results in very little recovery as shown by the residual imprint in the bottom SEM image of Fig. 3(b) inset. The imprint also shows the remnant of the first large burst, which is seen as a shear line at a depth of ∼20 μm along the walls of the crater. The vertical walls of the indent imprint indicate a clear shearing of the VACNTs along the rim of the indenter.
D. Effect of substrate on buckle formation
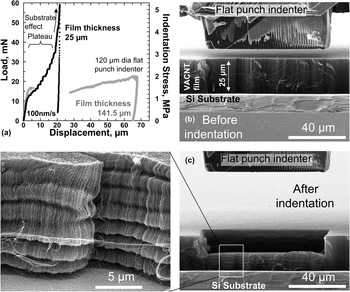
Figure 3 and video S1 indicate that the buckle formation in the VACNT film is strongly influenced by the constraints imposed by the stiff substrate. In the taller ∼142-μm-thick sample shown in Figs. 1 and 2, the location of the initial buckle is always close to the substrate, while the region underneath the indenter tip remains largely unaffected. Further loading is thought to cause additional localized folds to continuously form along the VACNT film height, and the indenter starts probing the folded/collapsed densified region—an effect similar to that observed during compression experiments on these VACNTs patterned into micrometer-sized bundles.Reference Pathak, Lim, Pour Shahid Saeed Abadi, Graham, Cola and Greer9 It stands to reason that such a response can be observed under indentation by using a shorter sample. This is shown in Fig. 4(a) where the indentation response of a shorter 25-μm-thick VACNT film is compared to a thicker ∼142-μm-thick film. Both tests shown in Fig. 4(a) were conducted in the samples’ interior. It is evident that while the initial loading portions of both samples are similar, the shorter VACNT film has a significantly higher slope in its plateau up to an indentation depth of ∼19 μm, suggesting a higher degree of stiffening in the shorter sample. Moreover, the plateau region of the shorter sample shows more prominent undulations than during indentation of the thicker sample at the same rate. Beyond the indentation depth of 19 μm, the effect of the stiff Si substrate becomes significant in the shorter sample as displayed by a steep rise in the load–displacement response. Consistent with these observations, stiffnesses calculated from the unloading portions of the load–displacement curves were an order of magnitude higher than those of the thicker film, showing the combined effects of densification and of the substrate influence in the shorter films.
(a) Comparative load–displacement curves at 100 nm/s loading rate of indentation tests conducted on a thin (25 μm) VACNT film versus a thick (141.5 μm) VACNT film. These indentations were performed on the interior of the sample far away from edge effects using a 120-μm-diameter cylindrical flat-punch indenter. The film morphology (b) before and (c) after in situ SEM indentations using a 60 × 80 μm rectangular flat-punch indenter on the edge of the sample help reveal the (c inset) progressive buckling seen in the shorter (25 μm) VACNT film sample. All SEM images except the bottom (c inset) were taken at 86° tilt angle. The (c inset) image was at 60° tilt angle.

To gain insight into the possible distinctions in morphological features between samples with different thicknesses, we conducted in situ indentation experiments in SEMentor of the shorter 25-μm-thick VACNT film sample. As shown in Figs. 4(b) and 4(c) and supporting online video S2, these tests were conducted on the edge of the VACNT film [unlike the in-bulk tests shown in Fig. 4(a)]. As in the case of the thicker samples (Fig. 2), the deformation extent in the shorter sample is localized to a zone directly underneath the indenter tip [compare Figs. 2 and 4(c)]. However, unlike the thicker samples, clear evidence of densification can be seen in the shorter VACNT film sample [Fig. 4(c) inset]. Figure 4(c) inset also shows that substrate proximity has resulted in multiple folds or buckles in the shorter VACNT film.
E. Analysis of indentation response
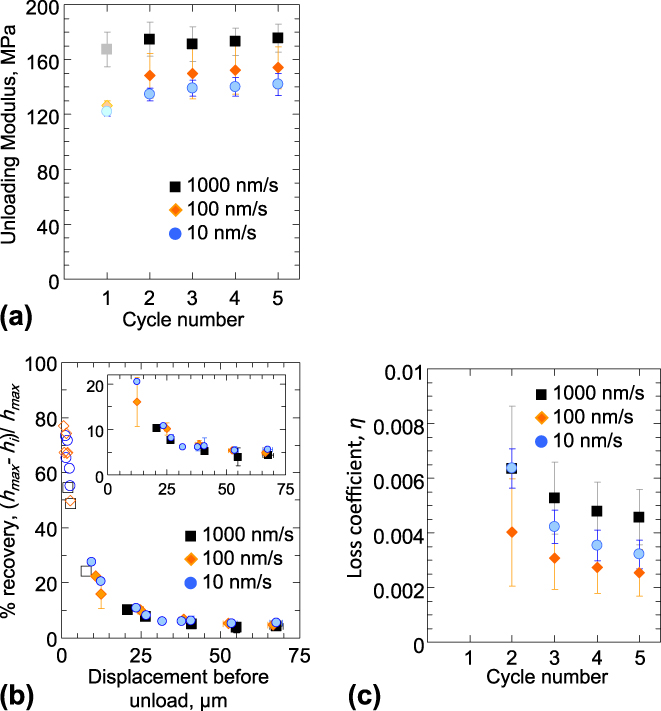
Figure 5 shows the results of indentation experiments conducted on the ∼142-μm-thick VACNT film sample. Only the data from the sample interior (i.e., no on-edge tests) are shown. Unloading modulus, defined in Eq. (1), is plotted as a function of loading cycle number in Fig. 5(a). This plot reveals that the modulus varies within a range of 120–175 MPa as a function of displacement rate and load–unload cycle number. These moduli further demonstrate a strong rate effect, with the fastest rate of 1000 nm/s consistently resulting in the highest moduli for all load–unload cycles. Such a rate dependence of the material stiffness is a known characteristic of viscoelastic solids.Reference Lakes43 In contrast, repeated cycling appears to have only a marginal effect on the sample modulus, remaining nearly constant during subsequent cycles for each displacement rate, although there is a small increase from the first to the second cycle. We note that the above method of calculation of unloading moduli inherently assumes indentation of an elastic half-space, usually represented well by a monolithic material.Reference Oliver and Pharr30, Reference Doerner and Nix44 Therefore, they may not be suitable for VACNT indentation—particularly for the first load–unload cycle where a block of material separates from the outer matrix. In spite of these aspects, Fig. 5(a) helps to underscore the higher degree densification of the VACNT film at faster rates. We also find that the higher modulus at faster rates leads to greater instability stress (Fig. 3), which increases from 1.49 ± 0.2 MPa at 10 nm/s to 1.54 ± 0.2 MPa at 100 nm/s to 1.75 ± 0.3 MPa at 1000 nm/s (average ± standard deviation over 10 or more measurements). Importantly, the indentation moduli shown in Fig. 5(a) match well with those measured during compression of APCVD VACNT micropillar samples [160–180 MPa,Reference Pathak, Lim, Pour Shahid Saeed Abadi, Graham, Cola and Greer9 see table in Fig. 7(b)].
(a) The unloading modulus (average ± standard deviation) at three different loading rates as a function of the load–unload cycle number. The lighter shade of the modulus values calculated from the first unload cycle reflects the uncertainty in their accuracy due to the approximations inherent in their calculations. (b) % recovery as a function of maximum displacement before unload. Unloading the indenter before the displacement burst (open symbols) shows significantly higher values of % recovery than after the burst (filled symbols). (c) The loss coefficient values as a function of load–unload cycles showing very poor energy dissipation under indentation. (color online)
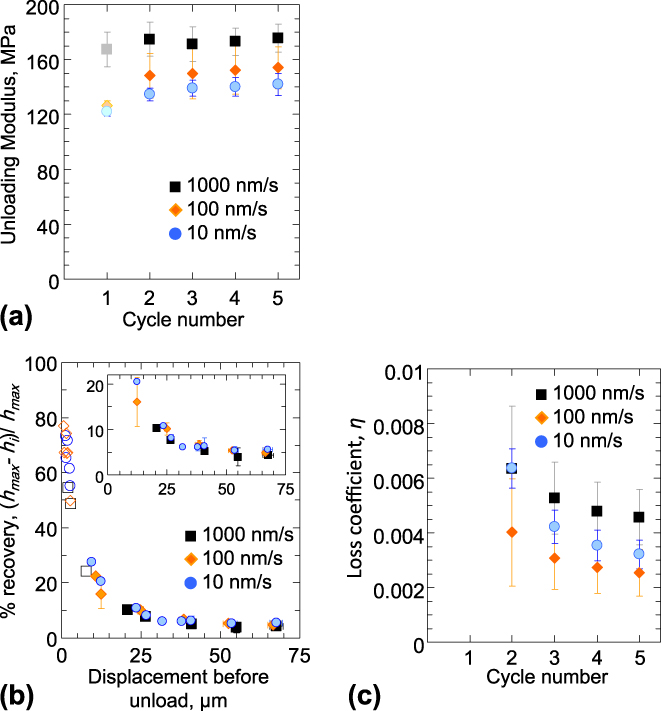
Figure 5(b) shows the trend in the % recovery as a function of maximum displacement before final unload across the three loading rates. Two distinct regions can be identified in this figure: (i) a segment of higher recovery between 50–80% when the indentation tests are stopped before the large initial displacement burst [open symbols in Fig. 5(b)], while (ii) loading beyond the burst (filled symbols) results in a very low (<10%) recovery. This indicates that the shear event, manifested by the large displacement burst in the indentation curve, results in permanent damage of the VACNT structure and significantly compromises its recoverability. We note that the virtually nonexistent material recovery from postdisplacement burst during indentation is in stark opposition to the almost full (∼100%) recovery seen in these materials under compression experimentsReference Pathak, Lim, Pour Shahid Saeed Abadi, Graham, Cola and Greer9 [see table in Fig. 7(b)]. We did not observe any significant deformation rate effects on the % recovery.
The loss coefficient η (see Sec. II) is shown in Fig. 5(c) as a function of load–unload cycle number. The data contain only those results for the tests loaded beyond the displacement burst. As a consequence of the marginal recovery [Fig. 5(b)], the loss coefficient associated with nanoindentation into this material is also very low, on the order of 0.003–0.006, a value nearly an order of magnitude lower than those for compression of the same materialReference Pathak, Lim, Pour Shahid Saeed Abadi, Graham, Cola and Greer9 [table in Fig. 7(b)].
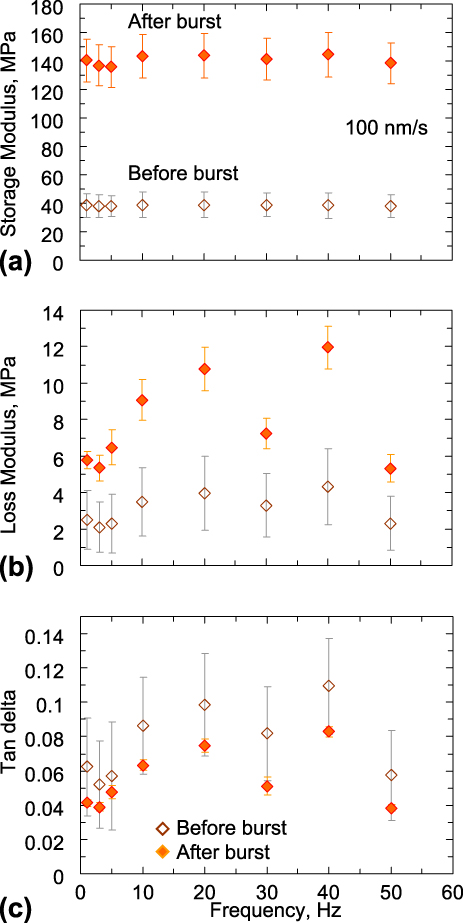
The viscoelastic indentation response of the VACNT film, in terms of the measured values of their storage modulus (E′), loss modulus (E″), and tanδ values, is shown in Fig. 6. Similar to the % recovery results, two distinct responses are seen in this figure depending on whether the indenter is oscillated before the large initial displacement burst (open symbols in Fig. 6) or after (filled symbols). Both E′ and E″ increase by a factor of ∼3–4 once the displacement burst has occurred [Figs. 6(a) and 6(b)], while tanδ decreases by 20–30% after the burst [Fig. 6(c)]. Before the burst, these parameters depend more strongly on the applied load during oscillations, as evidenced by the larger spread in the data.
We find the storage modulus to be frequency independent over the range of frequencies probed. On the other hand, the loss modulus (and the tanδ) strongly increases with increasing frequency, although two local minimas exist at 30 and 50 Hz [Figs. 6(b) and 6(c)]. Unfortunately, the cutoff frequency (50 Hz) of our instrument prevents further study of this behavior at higher frequencies.
The viscoelastic indentation response of the VACNT film at a loading rate of 100 nm/s, in terms of the measured values (average ± standard deviation) of their (a) storage modulus, (b) loss modulus, and (c) tanδ values, as a function of frequency. (color online)
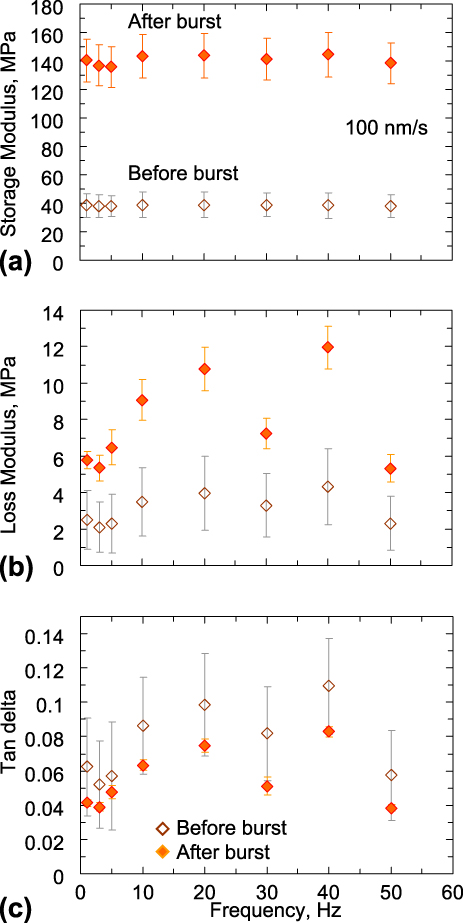
As shown earlier (Figs. 2 and 3), the large displacement burst occurring in the initial loading stages results in significant buckling. Thus, the higher E′ characteristic of the postburst structure indicates that the material is capable of storing a higher amount of energy in this state, with the excess energy presumably being stored in the buckled regions. The corresponding increase in E″—related to the dissipated energy—is at a lower proportion, thus leading to a less pronounced viscous response (lower values of tanδ) after the burst. The post-burst decrease in tanδ is likely caused by the increased adhesion between the individual nanotubes in the buckled regions when they are brought into proximity of one another after buckling. A similar response has been observed in polymeric materials like rubber,Reference Ward and Sweeney45 where an increase in cross-linking leads to a decrease of the viscoelastic response. We note that the trends reported in Fig. 6 are similar to those reported previously for other VACNT microstructures under indentation.Reference Pathak, Cambaz, Kalidindi, Swadener and Gogotsi8 The storage modulus E′ shown in Fig. 6(a) matches well with the unloading modulus shown in Fig. 5(a).
F. Comparing indentation and compression
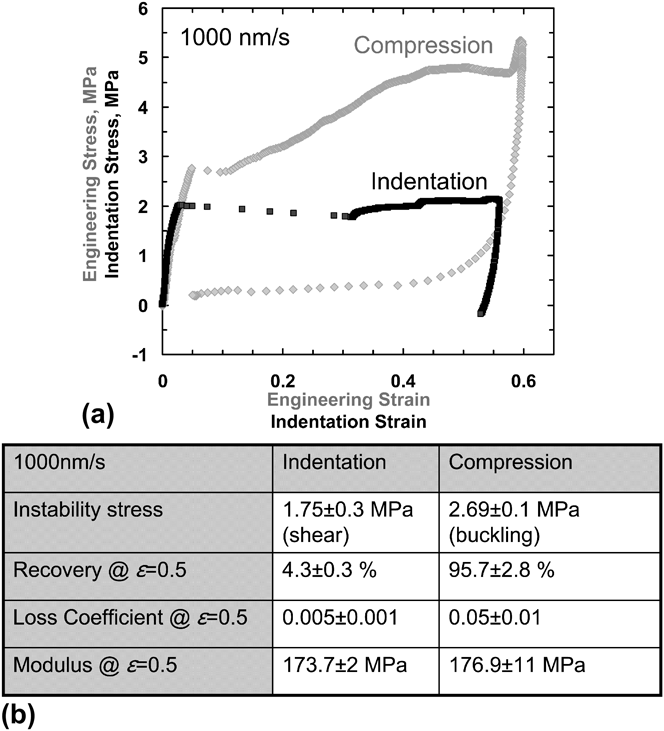
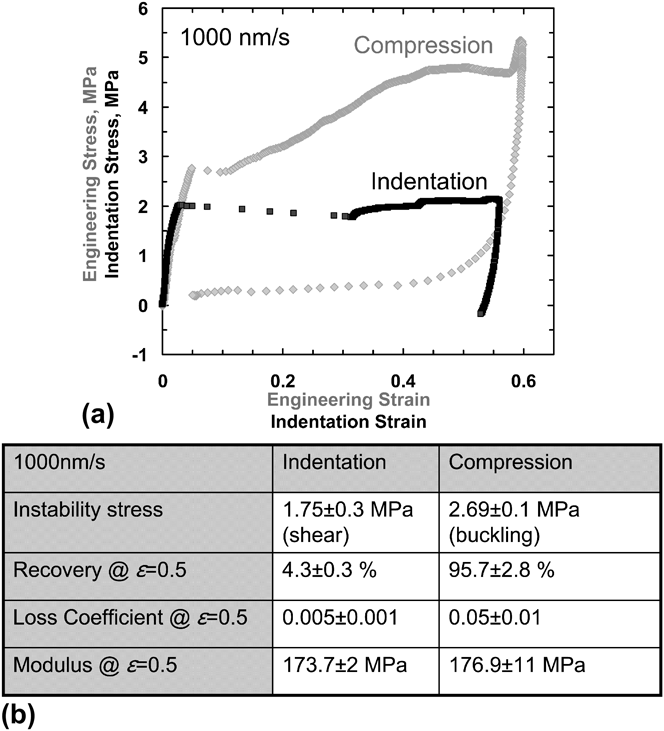
Figure 7(a) displays a comparative analysis between indentations into the ∼142-μm-thick APCVD VACNT films in this study and the compressions on 30 × 30 μm (diameter × height) APCVD VACNT micropillars from our previous work.Reference Pathak, Lim, Pour Shahid Saeed Abadi, Graham, Cola and Greer9 All tests were conducted at the loading rate of 1000 nm/s. The indentation stress (σind) and strain (εind) values were calculated using Eq. (3). The following observations can be made from this comparison: (i) instability stress in compression is ∼1.5 times higher than that in indentation, (ii) indentation is characterized by a significantly larger strain burst of (Δε = 0.3) after the instability as compared to compression (Δε = 0.05). This can be explained by the different deformation mechanisms associated with the bursts. During indentation, a single global shear event is responsible for such a burst, while under compression, a relatively small burst is sometimes observed just after yielding, which has been attributed to a temporary loss in the pillar–indenter contact.Reference Pathak, Lim, Pour Shahid Saeed Abadi, Graham, Cola and Greer9, Reference Hutchens, Hall and Greer11 (iii) After yield, the slope of the plateau region in compression is significantly higher (by a factor of almost 6) than during indentation. Thus, while the compressive stresses rise from ∼2.8 MPa at yield to 4.8 MPa at the strain of 0.6 (i.e., before the onset of densification), the stresses at equivalent strains in indentation are relatively constant, in the 2.0–2.1 MPa range. Finally, (iv) after unloading (to 10% of maximum load), the material under indentation shows negligible (<5%) recovery, while compression leads to an almost complete (>95%) recovery.
(a) Comparative stress–strain curves of VACNT in indentation and compression. (b) Table comparing the measured values from indentation (this study) versus compression (Ref. Reference Pathak, Lim, Pour Shahid Saeed Abadi, Graham, Cola and Greer9).
While determining the underlying physics of the described observations requires rigorous multiscale modeling, some of these phenomena can be understood in terms of the differences in boundary conditions between the two loading configurations (indentation versus compression), in combination with the overall similarity of the VACNT deformation to that of open-cell foam materials.Reference Gibson and Ashby46 The characteristics of flat-punch indentations into VACNT films closely resemble those reported for metallicReference Sudheer Kumar, Ramchandra and Ramamurty40, Reference Andrews, Gibson and Ashby47 and polymeric foams.Reference Flores-Johnson and Li41, Reference Gibson and Ashby46 In the spirit of foam-like deformation, the indentation zone for VACNTs is confined to the region directly beneath the indenter, while the surrounding regions are unaffected (see Fig. 2). The lack of lateral spread in the deformed region is typical for foams, whereby it can be attributed to the nonexistent Poisson’s ratio.Reference Zbib, Mesarovic, Lilleodden, McClain, Jiao and Bahr2, Reference Sudheer Kumar, Ramchandra and Ramamurty40, Reference Gibson and Ashby46 This is diametrically opposite to monolithic materials, where the plastic zone underneath the indenter tip is typically represented by a continuous hemispherical plastic zone.Reference Fleck, Otoyo and Needleman39 Another common characteristic between indentation into conventional foams and VACNTs is the appearance of a so-called “tear line”Reference Sudheer Kumar, Ramchandra and Ramamurty40, Reference Flores-Johnson and Li41 along the corner of the flat-punch indenter where the shear force is largest. The depth of this shear line in a foam generally depends on its strength.Reference Sudheer Kumar, Ramchandra and Ramamurty40, Reference Flores-Johnson and Li41 Unlike foams, however, the constituents of the VACNT system—the individual CNTs themselves—are nominally vertically aligned with respect to the indenter tip [Fig. 1(b)], and thus, the vertical plane is expected to be the plane of lowest shear strength in the VACNT matrix. Once the critical shear stress is attained during loading, the shear-off proceeds catastrophically along this vertical plane through the thickness of the VACNT film down to the underlying substrate. This results in highly localized deformation along the shear plane, with no notable perturbation in other regions. Subsequent loading initiates folding or buckling of the material close to the substrate but not in the sheared-off block. In the extreme case of indenting a short VACNT film (Fig. 4), subsequent densification of the already folded/buckled CNTs commences.
On the contrary, under uniaxial compression, the shear stresses acting on the VACNT matrix are negligible. Instead, the applied compressive strain is accommodated entirely via the formation of lateral folds or buckles along the length of the bundle, while the remaining portion remains virtually unscathed.Reference Pathak, Lim, Pour Shahid Saeed Abadi, Graham, Cola and Greer9, Reference Hutchens, Hall and Greer11 Thus, the first instability shown in the compression stress–strain response in Fig. 7(a) is related to the onset of the first buckle formation in the VACNT matrix. Further loading beyond yield results in the compression of the collapsed buckles. The resulting densification of the matrix, in combination with a possible property gradient in the VACNT structure,Reference Pathak, Lim, Pour Shahid Saeed Abadi, Graham, Cola and Greer9, Reference Hutchens, Hall and Greer11 results in the strong positive slope of the compression stress–strain curve in the plateau region.
A comparison of the instability stresses between compression (buckling, 2.69 ± 0.1 MPa) and indentation (shear, 1.75 ± 0.3 MPa) on the APCVD VACNT samples indicates that the instability stress in indentation is 40% lower than that of compression [Fig. 7(b)]. Interestingly, this observation is opposite to that of traditional indentation tests into monolithic materials, where yield in indentation typically requires 1–3 times higher stresses than for the uniaxial case for most solidReference Johnson29 and porousReference Fleck, Otoyo and Needleman39 as well as foamReference Sudheer Kumar, Ramchandra and Ramamurty40, Reference Gibson and Ashby46, Reference Andrews, Gioux, Onck and Gibson48 materials. The two distinct modes of deformation in VACNTs—shear under indentation and buckling in compression—are likely responsible for this apparent reversal in their instability stress values, i.e., during indentation, the APCVD VACNT film reaches its critical shear stress before it can buckle.
While our findings may be representative of the overall CNT film deformation, it is important to recognize that both the shear strength and the deformation behavior of the VACNT matrix are strongly affected by its microstructural details such as tube and node density and tortuosity. These parameters govern the entanglement of the individual CNTs within the matrix, and hence, our observations are valid only for the particular APCVD VACNT film studied in this work. Further, even the standard APCVD growth techniques for VACNTs are notoriously difficult to control. For example, despite the growth recipe to create the 30-μm-tall VACNT pillars studied in Ref. Reference Pathak, Lim, Pour Shahid Saeed Abadi, Graham, Cola and Greer9 and the 142-μm-tall VACNT films investigated in this work being nominally identical (other than the growth time), it is reasonable to expect substantial differences in the VACNT density, alignment, and tortuosity, and, especially, their respective variations along the sample heights. Both of these parameters have proved to be very difficult to quantify experimentally. Similarly, the two VACNT film thicknesses shown in Fig. 4 may also show a similar difference since they were grown in different batches. Our related work on VACNTs produced using other CVD methodsReference Pathak, Mohan, Decolvenaere, Needleman, Bedewy, Hart and Greer49 as well as that of others in the fieldReference Bradford, Wang, Zhao and Zhu25 have yielded a wide range in instability stresses under both indentation and compression, which are thought to be a consequence of the particular details (e.g., density, degree of entanglement, etc.) of the CNT structure and arrangement in their matrix.
We attribute the large difference in recoverability of the VACNT matrix in indentation (4.3% ± 0.3%) versus compression (95.7% ± 2.8 %) to the different deformation modes and boundary conditions under these two loading modes. The almost complete recovery of the VACNT structure under compression in Ref. Reference Pathak, Lim, Pour Shahid Saeed Abadi, Graham, Cola and Greer9 is related to the elastic unfolding of the buckles created during loading. This has been explained by the intertube interactions of the CNTs where the zipping and unzipping of CNTs in contact have been proposed as the primary criteria for the superior viscoelasticity and creep recovery of VACNTs.Reference Xu, Futaba, Yamada, Yumura and Hata19, Reference Xu, Futaba, Yumura and Hata20, Reference Bradford, Wang, Zhao and Zhu25, Reference Gogotsi50 On the contrary, recovery in indentation is inhibited by the additional constraints of the surrounding VACNT material. Thus, even at lower strains (before the large shear burst), the recovery under indentation is still lower [50–80%, Fig. 5(b)] than that in compression. After the displacement burst, recovery of the VACNTs in indentation is further compromised by the permanent nature of the damage caused by the shearing of a large block of the material from the matrix.
Similarly, the viscoelastic properties of the VACNT matrix are also different in indentation (Fig. 6) versus compression (Ref. Reference Pathak, Lim, Pour Shahid Saeed Abadi, Graham, Cola and Greer9). While the frequency dependence of tanδ is similar in both cases, the values of tanδ in indentation (as measured after burst) were 20–30% lower than those in compression, suggesting a lower viscous response.
IV. CONCLUSIONS
In summary, we demonstrate that under large displacement indentations, APCVD-grown VACNT films deform by a single vertical catastrophic shear-off event along the rim of the indenter tip, manifested by an extensive ∼20–40-μm-long displacement burst in the load–displacement curve. Similarly, to foam materials with negligible Poisson’s ratios, the indentation in VACNTs is also exclusively confined to regions directly beneath the indenter. Through in situ nanomechanical indentation experiments, we show that the axial strain during the catastrophic shearing event is accommodated by rolling of several coiled-up CNT sections, or “microrollers.” We hypothesize that such coiling provides a low-friction path for deformation, which may explain the lower stresses associated with indentation. Loading beyond the initial shear event causes a 20–30% decrease in the material’s viscous response. We also find progressive buckling in the VACNT structure, with the buckles forming primarily near the stiff underlying substrate. Comparison of indentation versus compression experiments indicates that APCVD-grown VACNT films reach their critical shear stress before buckling in indentation, which results in the catastrophic shear formation in their microstructure. As a result, these materials demonstrate negligible recovery in indentation, as compared to their almost perfect recoverability under compression.
Supplementary Material
Supplementary materials can be viewed in this issue of the Journal of Materials Research by visiting http://journals.cambridge.org/jmr.
ACKNOWLEDGMENTS
The authors acknowledge S. Hutchens and A. Needleman for helpful insights and guidance, E. Lim for data analysis, financial support from the Georgia Institute of Technology Foundation through the Joseph Anderer Faculty Fellowship, and the Institute for Collaborative Biotechnologies (ICB) for financial support through Grant No. W911NF-09-0001 from the U.S. Army Research Office. The content of the information does not necessarily reflect the position or the policy of the Government, and no official endorsement should be inferred. S.P. gratefully acknowledges support from the W.M. Keck Institute for Space Studies Postdoctoral Fellowship program for this work. We gratefully acknowledge critical support and infrastructure provided for this work by the Kavli Nanoscience Institute at Caltech.