


Introduction
Control is fundamental, either implicitly or explicitly, to psychopathology. An inability to control intrusive thoughts, for example, is linked to various forms of psychopathology (Moore and Abramowitz, Reference Moore and Abramowitz2007). The scope of psychological problems where control is identified directly is large. Difficulties with weight-control, mood control, and impulse control are all commonly associated with psychological distress. The scope widens even further if instances where control is referred to indirectly are included. Concepts such as “dysregulation”, for example, clearly refer to control processes.
If control is a central component of psychological distress it makes sense to argue that psychotherapy, when it is effective, helps people regain control. Through psychotherapy people learn various ways of controlling their mood, or their behaviours, or their thoughts, or their thoughts about their thoughts, or even their focus of attention. The third wave of cognitive behavioural psychotherapies could be characterized, at least in part, by a shift away from behavioural and cognitive control strategies to strategies designed to control attention or the focus of awareness (e.g. Teasdale, Segal and Williams, Reference Teasdale, Segal and Williams1995).
It has been suggested that an organizing, integrative, conceptual model is needed for psychotherapy (Foster and Mash, Reference Foster and Mash1999; Kazdin, Reference Kazdin1999). Given the centrality of the concept of control to both conceptualizations of psychopathology and developments in psychotherapy, it may be that a theoretical account of control could provide the framework that is needed. Perceptual Control Theory (PCT; Powers, Reference Powers2005) might be one such theory. Carver and Scheier (Reference Carver and Scheier1982), for example, noted that PCT had potential application in the area of clinical psychology while more than 20 years later Mansell (Reference Mansell2005) provided a comprehensive discussion of the implications of the principles of PCT for clinical psychology.
Perceptual control theory
From the perspective of PCT control is regarded as a characteristic of life (Bourbon, Reference Bourbon, Roitblat and Meyer1995; Marken, Reference Marken1988). Control requires the simultaneous occurrence of three processes: perception, comparison, and action (Powers, 1998). In order to control one's fitness level, for example, one must be able to: perceive current fitness; compare current fitness to desired fitness; and act to reduce any discrepancy that exists so as to maintain a match between perceived fitness and desired fitness. The same process applies across the range of lived experiences such as controlling one's perception of self, controlling one's mood, or controlling one's body temperature.
In order to control a range of perceptual experiences it is suggested that a network of control systems is organized in parallel and hierarchically with higher level systems controlling more complex perceptions than lower level systems (Powers, Reference Powers2005). The higher level systems control their perceptual signals by adjusting the set points of lower level systems. The control hierarchy is constructed and maintained through a process of reorganization that randomly alters the parameters of identified control systems in order to improve control abilities and reduce error (Powers, Reference Powers2005).
Through simulation models reorganization has been demonstrated to be an efficient way of improving abilities of control systems (Runkel, Reference Runkel2005). Reorganization makes random changes to the parameters of control systems with the basic guideline being “if this change reduces error persist with this change, if not change again”. Reorganization, however, needs a way of being directed so that only control systems that are functioning less than optimally are reorganized. In PCT it is proposed that reorganization follows awareness. That is, whatever the focus of awareness is at any particular point in time it will be the area subject to reorganizing processes.
PCT suggests that the phenomenon of awareness and the process of reorganization are essential to psychotherapy success. PCT is not the first explanation to incorporate awareness as an important component of psychotherapeutic change. Winston and Muran (Reference Winston, Muran, Dickstein, Riba and Oldham1996), for example, suggest that many psychotherapies work by raising the patient's awareness and developing new insights. Similarly, Segal and Shaw (Reference Segal, Shaw, Dickstein, Riba and Oldham1996) suggest that a goal of many psychotherapies is to help patients step back or distance themselves from the problem so that new information can be considered. Elliott (Reference Elliott2001) also describes a key role of treatment as helping clients develop their own awareness and understanding of current difficulties and Shapiro (Reference Shapiro1995, p. 15) claims “Most, if not all, psychotherapies involve the client learning something new about him- or herself.” Beitman and Soth (Reference Beitman and Soth2006) argue self-observation is a core process in psychotherapy and that self-observation emerges from self-awareness. Moreover, many current innovations in cognitive behaviour therapy such as mindfulness approaches, meta-cognitive therapy, and Acceptance and Commitment Therapy (ACT) all emphasize the importance of awareness. The role played by awareness from a PCT perspective, however, in terms of directing reorganization, may be novel.
In order to discuss the importance of awareness and reorganization to problems of control it is first necessary to outline a PCT formulation of psychological problems. PCT suggests that an event will be experienced as a problem to the extent that it interferes with a person's ability to control. In PCT the main psychological (meaning that the physical integrity of the control systems is not compromised) problem occurs when two control systems specify incompatible or opposite experiences. For example, if one control system specifies driving at 40 kilometres per hour and another control system, within the same hierarchy, specifies driving at 110 kilometres per hour, as each control system acts to reduce their discrepancies between perceived and desired speeds, they will increase the discrepancy for the other control system. This is just to say that as the speed moves closer to 110 that will reduce the discrepancy for one control system but simultaneously increase the discrepancy for the other control system. The same situation occurs if someone wants to do things their own way and also be accepted by others, or wants to pursue career ambitions but also wants to build strong and loving family relationships, or wants to stop being bullied but doesn't want to involve people in positions of authority.
The situation in which two opposing experiences are specified simultaneously is called conflict in PCT (Powers, Reference Powers2005; Carey, Reference Carey2006b). Psychological distress, therefore, arises as a by-product of control systems being chronically conflicted (Carey, Reference Carey2008). So, within a PCT framework, helping people psychologically will involve helping them regain control by resolving conflict. From a PCT perspective, a person's thoughts, behaviours, or emotional states are regarded as symptoms of the problem rather than the problem itself. It is the distress associated with any particular thought, behaviour, or emotion that is seen as important as an indicator of a possible conflict underlying the presenting symptoms.
PCT has not introduced conflict to the psychotherapy field. Stiles et al.'s (Reference Stiles, Elliott, Llewellyn, Firth-Cozens, Margison, Shapiro and Hardy1990) assimilation model describes psychological problems as conflicts. Wells (Reference Wells2005) alludes to conflict when he asserts that people with generalized anxiety disorder are in “two minds about worrying” (p. 110). Therapies such as motivational interviewing (Bell and Rollnick, Reference Bell, Rollnick, Rotgers, Keller and Morgenstern1996) and ACT (Strosahl, Hayes, Wilson and Gifford, Reference Strosahl, Hayes, Wilson, Gifford, Hayes and Strosahl2004) also incorporate the concept of conflict. PCT's contribution, however, is to provide an explanation for the structure and manifestation of conflict. For a more in depth discussion of conflict from a PCT perspective see Carey (Reference Carey2008).
It is proposed that conflict occurs across at least three levels of the hierarchy of control systems (Carey, Reference Carey2006b, Reference Carey2008). The first level is where the behavioural, cognitive, and emotional symptoms are experienced. The second level is where the opposing goals are situated and the highest level contains the control system that has created the opposing set points for the two lower level systems. Conflict will be resolved when this highest level is reorganized so that different signals are sent to the lower levels. Experientially this might be described with terms such as insight or an “Aha!” moment or an epiphany. Ironically, however, when people are in conflict they usually spend most of their time attending to the two lowest levels. Since their attention is at these levels this is where reorganization will occur, yet reorganization at these levels will have no lasting effect on the existence of the conflict. This may provide an explanation for the persistence of chronic conflict. It is only when awareness is directed to the highest level and reorganization alters this control system that conflict, and therefore psychological distress, resolves.
The Method of Levels
The hypothesis from a PCT perspective is that psychotherapy is successful when it helps patients shift their awareness to a higher perceptual level so that reorganization can alter the control system generating the conflict. Any psychotherapy will be effective to the extent that it helps patients achieve this shift. Thus, the psychotherapeutic method developed from PCT focuses exclusively on redirecting a patient's awareness to higher levels of perceptual control. This technique is called the Method of Levels (MOL; Carey, Reference Carey2006b).
Conversing in MOL
MOL capitalizes on the mobility of awareness. When people are engaged in conversation they can become aware of topics that are different from the topic currently being discussed. Often, these shifts in awareness can be observed as interruptions to the person's dialogue flow. The person might pause, for example, or look away or smile or shake their head or give some other indication that their current stream of thought was briefly broken. A therapist using MOL would observe these disruptions and direct the person's attention more fully to this fleeting occurrence. An anonymous reviewer pointed out that focusing on disruptions is also fundamental to many dynamic therapies. Attending to disruptions may be analogous to making people more aware of background thoughts in cognitive behaviour therapy (CBT). In MOL, however, the shift in attention could be to an image or an auditory perception just as much as a thought. Often these jumps in awareness will reveal meta or evaluative comments such as “What I'm saying doesn't make any sense” or “I'm wasting my life the way I'm currently living” or “My partner would hate to hear me saying these things”. From a PCT perspective a meta comment is regarded as coming from a higher level. The reason for directing and sustaining a person's awareness at this level is to move reorganization to a higher level in the hierarchy. Also, as this higher level is discussed, a new disruption is likely to occur and a yet higher level may be revealed, at which point the process repeats.
Characteristics of MOL therapy
MOL is an iterative process of shifting a person's awareness to higher perceptual levels so that reorganization can ultimately modify the control system creating the conflict. As such, MOL could be described as a focused and transdiagnostic form of cognitive therapy. Each session is seen as a discrete problem-solving-by-reorganization episode. MOL is not arranged into a program of a set number of sessions. Given that people can be expected to reorganize at different rates and in different time periods, people are invited to access the amount of MOL they feel they require.
Inside a MOL session
A MOL session begins, therefore, with a patient explaining a current problem to the clinician. The clinician engages the patient in conversation by asking questions about the problem but remains alert to possible shifts in awareness indicated by disruptions to the patient's dialogue flow. When a shift is thought to have occurred the clinician redirects the patient's attention to the focus of this shift and engages them in conversation at this level by further questioning. Then, the clinician remains alert for further shifts in awareness and the process begins again. Ideally, the process finishes when the patient indicates that there is nothing left to discuss on this topic. When this occurs the patient might feel calm and relaxed or sometimes confused and in need of time to sort through various ideas. Sometimes appointment scheduling dictates the end of a session and, in this case, the discussion can be resumed when the patient next books an appointment if this topic is still relevant to them. For more detail about conducting MOL, including the nature of the conversation, see Carey (Reference Carey2006b) which includes a DVD of a MOL session along with a transcript of that session.
Investigating MOL empirically
This paper builds on previous work (Carey, Reference Carey2005; Carey and Mullan, Reference Carey and Mullan2007, Reference Carey and Mullan2008) and describes a study using four clinicians working over a 12-month period. In each of the studies conducted it has been a priority to evaluate MOL in the clinical settings within which it is intended to be used. This approach fits with methodological developments that recognize the value of conducting psychotherapy research in naturalistic settings. These methodological advances acknowledge the importance of effectiveness as well as efficacy studies (Charman, Reference Charman and Charman2004; Kopta, Lueger, Saunders and Howard, Reference Kopta, Lueger, Saunders, Howard, Spence, Darley and Foss1999; Nathan, Stuart and Dolan, Reference Nathan, Stuart and Dolan2000; Seligman, Reference Seligman1995).
A potential drawback to these naturalistic evaluations has been the lack of a control group. This has partly been because the evaluations have occurred during routine clinical practice but also because it was considered pre-emptive to include control or comparison groups until it was established that there was actually an effect worth comparing. The main advantage of a control group is that it allows competing hypotheses to be ruled out so that conclusions regarding the effectiveness of the therapy can be made with some confidence. In lieu of a control group, however, the studies have sought to access patients' views about the therapy they received. This is quite uncommon in outcome research but provides valuable information regarding the patients' experiences in therapy.
The studies also span a time period rather than a particular number of sessions. It is well recognized in the literature that patients do not attend therapy for either the number of sessions various therapies are designed for (Lambert, Reference Lambert2007) or for the number of sessions therapists think they should attend (Carey, Reference Carey2006a; Lambert and Asay, Reference Lambert, Asay and Charman2004; MacKenzie, Reference MacKenzie, Dickstein, Riba and Oldham1996). Patients who end their psychotherapy sessions before psychotherapists expect them to, however, are not necessarily treatment failures (Pekarik, Reference Pekarik1983, Reference Pekarik1985). Typically, most patients attend for very few sessions, with Talmon (Reference Talmon1990) reporting that the modal number of sessions attended is one. This may relate to the fact that the largest gains occur in the first few sessions of psychotherapy, with more sessions required for similar gains as psychotherapy progresses (Howard, Kopta, Krause and Orlinsky, Reference Howard, Kopta, Krause and Orlinsky1986; Lambert, Hansen and Finch, Reference Lambert, Hansen and Finch2001; Orlinsky and Howard, Reference Orlinsky, Howard, Garfield and Bergin1986; Pekarik and Wierzbicki, Reference Pekarik and Wierzbicki1986; Shapiro et al., Reference Shapiro, Barkham, Stiles, Hardy, Rees, Reynolds and Startup2003).
The setting of the National Health Service (NHS) of the United Kingdom provides an ideal context to investigate attendance patterns since psychological treatment is provided freely in the NHS. There was some scope, therefore, to establish what attendance patterns might be like if patients were provided unlimited access to the service. Using MOL we have obtained results consistent with other studies mentioned in the literature (e.g. Shapiro, et al., Reference Shapiro, Barkham, Stiles, Hardy, Rees, Reynolds and Startup2003). Typically, a large number of patients attend for a small number of sessions and a small number of patients attend for a large number of sessions (Carey, Reference Carey2005; Carey and Mullan, Reference Carey and Mullan2007, Reference Carey and Mullan2008). MOL acknowledges and accommodates this variation in attendance patterns. In MOL the focus is on providing the maximum therapeutic assistance in whatever time frame is suitable to the patient.
Method
Participants
Clinicians. Three male clinicians and one female clinician provided MOL sessions. Three clinicians were trained as cognitive behaviour psychotherapists while one clinician was trained as a clinical psychologist. The clinicians had between one and three years experience providing MOL in NHS settings.
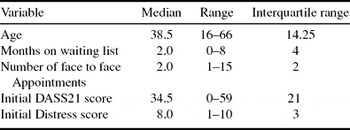
Patients. Once the study commenced, each clinician kept data on the first 30 patients to attend at least one session. Of the 120 participants in the study, 82 were female and 38 were male. Table 1 provides information about the sample. Medians rather than means are reported because many of the variables showed considerable skewness.
Summary information for patient variables

The most common reasons for referral were depression, anxiety, or a combination of these. A total of 77 patients (64% of the sample) were referred for these disorders. The remaining 43 patients were referred for other problems such as panic, eating disorders, anger, and comorbid presentations.
Setting
Three clinicians provided MOL in primary care NHS settings and the other clinician provided MOL in secondary care NHS settings.
Procedure
Patients were offered sessions in the order that they were referred. Three clinicians were the only providers of psychotherapy in the settings they worked in whereas one clinician selected patients from a pooled waiting list from which other colleagues also selected patients.
At the first session patients completed the Depression Anxiety Stress Scale – Short Form (DASS21, described below; Lovibond and Lovibond, Reference Lovibond and Lovibond1995). After the first session, patients accessed further sessions as required with no limit being placed on the number of sessions or their frequency. Data were collected for 12 months.
Whenever patients had not attended treatment for one month a letter was sent to them asking them to complete a DASS21 and another questionnaire assessing their perceived level of distress. A stamped, self-addressed envelope was provided to patients at this time. Once the questionnaires had been sent, patients were followed up with a maximum of two telephone calls to ensure that they had received the questionnaires and to prompt questionnaire completion and return. For this study, 63 patients returned follow-up questionnaires (52.5%).
After a 3-month time period had elapsed since the patients last session, the patient's treatment was deemed to have concluded. Three months was chosen because this was the standard time period for closing files in the departments within which we worked.
Of the patients seen by each clinician, five were randomly selected to have their first session audiotaped. These audiotapes were reviewed by a minimum of three out of five authors of this paper. Reviews occurred with the use of prepared forms that enabled a consistency of focus. Additionally, fortnightly peer supervision was conducted with all authors of this paper where different aspects of the research were discussed, including treatment adherence. MOL was used exclusively as the only treatment in this study; that is, the only treatment experienced by every patient in every session was MOL.
Questionnaires
The DASS21. The Depression Anxiety Stress Scale – Short Form (DASS21) was used for three reasons: it has good reliability and validity statistics from other studies as well as UK normative data (Henry and Crawford, Reference Henry and Crawford2005; Lovibond and Lovibond, Reference Lovibond and Lovibond1995); it is in the public domain; it is relatively brief yet provides scores across different problem areas.
The distress perception questionnaire. Along with the DASS21, patients were asked to rate their perceived level of distress before and after treatment. Scales were numbered from 0–10 with zero representing no distress and 10 representing maximum distress. Patients were also asked to provide comments on the treatment they had received.
Research questions
The main question of interest was “What happens when MOL is used in routine clinical practice?”. From this primary research question two further questions were articulated.
Research question 1: What are the attendance patterns of patients accessing MOL?. Psychological treatment is a service provided freely to patients in the NHS. MOL is a form of psychotherapy with no planned time frame. It was of interest, therefore, to investigate how often patients would attend if they were offered unlimited access to the service.
Research question 2: Do people who receive MOL report beneficial effects?. An important component of this study is determining whether or not it is reasonable to continue developing MOL as an approach to psychological treatment. Although comparisons with established treatments were considered pre-emptive at this stage, it was of interest to learn about patients' experiences of the treatment they received.
Data analysis
Preliminary analyses. Classification and regression trees (CART) explain the variation of a single response variable by one or more explanatory variables (De'ath and Fabricius, Reference De'ath and Fabricius2000). Given that 63 patients returned follow-up questionnaires and 57 patients did not, it was of interest to explore whether any differences existed between these groups on the variables measured. The only variable that significantly differentiated the groups was time spent on the waiting list. Patients who spent more than 4 months on the waiting list were more likely to return questionnaires (p < .05). Questionnaire returners and nonreturners, therefore, could not be differentiated by age, initial symptom severity, or the number of sessions they attended.
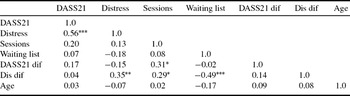
Since this study offered an unlimited service to patients it was of interest to assess various relationships concerning symptom severity and attendance. Attendance data are provided in Table 1. Table 2 provides further information by quantifying relationships.
Correlations between variables related to symptoms, attendance, and age

***p < .001; **p < .01; *p < .05.
DASS – initial total DASS21 score; Distress – initial distress score; Sessions – the number of face to face sessions; Waiting list – the number of months spent on the waiting list; DASS dif – the difference between the first and last total DASS21 score; Dis dif – the difference between initial and final distress scores; Age – age in years.
Table 2 indicates that initial DASS21 and distress scores were positively correlated. Interestingly, however, there was no relationship between initial scores and difference scores for the DASS21 even though difference scores and initial scores were significantly correlated for distress. Both DASS21 and distress difference scores, however, were related to the number of sessions patients attended. There was also a significant inverse relationship between the distress difference score and the number of months spent on the waiting list, suggesting that the less time spent on a waiting list the greater the change in distress. Notably, perhaps are the nonsignificant correlations between the number of sessions and initial symptom severity, age, and time spent on the waiting list.
Statistical significance. Although resampling methods were conceptualized in the 1930s, the numerous calculations required made their use impractical at that time and less powerful, less accurate parametric approximations such as t tests became standard practice (Good, Reference Good2006). With the advent of modern computers, however, resampling methods became feasible and their lack of reliance on parametric assumptions means they are widely applicable. In this study permutation tests (Good, Reference Good2006) and bootstrap confidence intervals were used (Efron and Tibshirani, Reference Efron and Tibshirani1993). Data were analysed using the R software environment (R Development Core Team, 2005).
For both the calculation of the confidence intervals and also the derivation of p values through permutation tests the null hypothesis being tested was that there was no improvement in symptom severity following MOL. Since a large number of iterations increases the precision of the calculations (Good, Reference Good2006), 10 000 iterations were conducted on the vectors of difference scores. The confidence intervals are reported in Table 3. Neither of the confidence intervals contained zero so the null hypothesis of no improvement can be rejected in both cases.
Bootstrap confidence intervals for mean difference scores

Lambert (Reference Lambert1985) reports that, while larger samples do not necessarily improve the robustness of a permutation test, choosing a robust statistic does. Since the median can be considered more robust than the mean (Lambert, Reference Lambert1985), the median was used in these calculations. To derive a p value, 1000 iterations were performed in which the data were resampled and a new median calculated on each iteration. Table 4 indicates that the observed medians were very unlikely to have occurred by chance and, once again, the conclusion of rejecting the null hypothesis is supported. Also, the pre-post effect sizes were 0.77 for the DASS21 and 1.36 for the distress scale.
p values calculated from permutation tests

Personal significance. Relying on questionnaire scores to assess the meaningfulness of change for an individual may not be entirely adequate. We decided, therefore, to ask patients directly. After rating their distress on the distress perception questionnaire, patients were also asked “How do you feel about your current level of distress?” and “What comments do you have about the therapy you received?”
Analysis of the comments provided was based on Ritchie's and Lewis's (Reference Ritchie and Lewis2003) framework approach. The framework approach is an iterative qualitative analysis method involving the identification of themes in the data. From the themes that are developed categories are classified and refined.
In answer to the question “How do you feel about your current level of distress?” four categories were delineated. Patients' comments were generally positive although some indicated that their problems had not resolved at the time they completed the questionnaire. The first category concerned what the patient can or cannot do in relation to: feelings (“I feel the calmest I have been in a long time”); actions (“I'm getting better at dealing with life's stresses and more confident”; “I still can't go out myself and do things”); and thoughts (“Some days I get up and feel nothing can get in my way or stop me”). The second category concerned an assessment of their current state (“It is very much better, I feel I am almost back to full health”). The third category was issues of control (“I feel more in control”). The final category concerned what the therapist had given them (“suggested other ways of looking at issues/problems”).
An analysis of the second question “What comments do you have about the therapy you received?” provided five categories. In the first category, patients identified what had helped in terms of the following: judgement (“I was so glad of being able to talk to someone that didn't judge me”); listening (“I have nothing but praise for the way you have listened to my ranting”); self-help (“Between the sessions of therapy I received and a good self-help book”); medication (“If not for the medication I would be in a mess”); talking (“The talking has been reassuring and helped me with some insights”); understanding and support (“tries to help you understand how and why you feel the way you do at the time”); and advice given (“I am coping well since receiving your advice”; “It has definitely helped although the advice given was little”).
The second category included comments that were an assessment of the therapy (“Excellent, I've found therapy very beneficial”; “I felt the therapy I received was pointless”; “At first I didn't think it helped but when I thought about it deeper, it did help a lot”). The third category focused on what is happening now in terms of the following: feelings (“I feel a great deal better in myself”); actions (“I was able to be more decisive and this has been of great value since I have been back at work”); and thoughts (“It made me take a step back and think about it differently, which I don't think I would have done myself”).
The fourth category concerned patients' expectations of therapy (“I went into therapy thinking I would get an answer. Unfortunately it doesn't work like that”). The fifth category contained comments regarding patients' difficulties with therapy (“I find it very difficult to speak about myself. I have always rather spoken about others”; “Not sure it was the right course for me, but it was the therapist who made me look at things and realise that”).
Discussion
Perceptual control theory (PCT) informed the development of a focused form of cognitive therapy called the Method of Levels (MOL). This study explored the use of MOL in naturalistic settings with four clinicians and 120 patients. Patient attendance patterns using MOL are similar to attendance patterns reported generally in the literature. A large number of patients attended a small number of sessions, with a few patients attending for longer. The number of sessions was related to the amount of change between initial and final DASS21 and distress scores. The number of sessions, however, was unrelated to initial DASS21 and distress scores, the age of patients, and the amount of time they spent on the waiting list. The effects of MOL were highly significant. Analysis of qualitative data produced themes and categories that suggested that MOL was generally a useful experience.
Studies conducted in naturalistic settings often have a lack of experimental controls and this was the case for our study. We did not use a control group, patients were not randomly sampled from the population of patients, and we did not use stringent exclusion or inclusion criteria. Also, only approximately 50% of the patients receiving MOL returned post-treatment data. The extent to which our conclusions can be generalized, therefore, is limited. The presence of a control group, for example, is important for answering questions of relative effectiveness. Thus, we can not say, from the results of our study, that patients receiving MOL improved more than patients on a waiting list or patients receiving some other form of treatment. We can say that many patients who received MOL and returned questionnaires seemed to benefit from MOL according to both changes in questionnaire scores and their own reports. A control group would also help to rule out factors such as spontaneous remission as a possible reason for symptom reduction. In the absence of a control group, however, patients' comments about their experience of therapy is perhaps another way of understanding the benefits that occur while attending treatment. How these benefits compare to the benefits from other forms of psychotherapy is a question for future studies.
Despite these limitations, the results appear to replicate earlier findings (Carey, Reference Carey2005; Carey and Mullan, Reference Carey and Mullan2007, Reference Carey and Mullan2008). That MOL is effective with any patient is perhaps remarkable considering what is omitted from treatment. MOL seeks to maximize the time spent therapeutically so formal assessments, engagement activities, formulations, homework, advice, and other tasks that are standard in various psychotherapies are not routinely provided. Generally, the only task in MOL is helping patients shift their awareness to higher perceptual levels so that reorganization can resolve the conflict they are experiencing.
Given the minimalistic nature of MOL it might be useful in future research to compare MOL with other approaches that include some of the components mentioned above. Does an approach that includes a formal assessment have outcomes superior to MOL? Does the routine inclusion of engagement activities or the presentation of a formulation lead to better outcomes?
Future research might also benefit from considering the formulation of psychological distress as conflict more closely. Why do some people seem to get “stuck” in conflicts while other people are able to resolve similar dilemmas? Do current diagnostic groupings approximate conflicts at different levels of the perceptual hierarchy? What methods could be used to assess the strength of a conflict and its resolution?
The reliance on patient decision making to determine session attendance is another feature of MOL. Since MOL sessions are designed to be discrete problem-solving episodes, as much or as little support as patients require can be provided. It appears that when patients are able to attend as often and as frequently as they require, they mostly attend for a small number of sessions. A very few patients appear to require much more support; however, since most patients attend for few sessions, resources are available to provide for those patients who require more support. Shapiro et al. (Reference Shapiro, Barkham, Stiles, Hardy, Rees, Reynolds and Startup2003) reported that a small number of patients typically consume a disproportionate amount of clinicians' time. Also, Lambert (Reference Lambert2007) claimed that treatment length should be driven by the response of the patient to treatment rather than theoretical or cost-based decisions. MOL is an approach to treatment that accommodates both these aspects.
MOL then appears to be emerging as a useful way of helping people who are experiencing the distress of internal perceptual conflict. The relative effectiveness of this approach and the extent of its applicability are issues for future research to investigate. The results suggest, however, that continued examination of MOL is warranted.





Comments
No Comments have been published for this article.