I. INTRODUCTION
3-aminopropyltriethoxysilane (APTES) is a widely used silane that allows facile amine functionalization of hydroxylated inorganic substrates. The amine functionality of APTES has been used to immobilize polymersReference Annaka, Yahiro, Nagase, Kikuchi and Okano1 and proteins,Reference Kim, Cho, Seidler, Kurland and Yadavalli2 as well as to promote cell adhesion.Reference Zhang, Crozatier, Le Berre and Chen3, Reference Ranieri, Bellamkonda, Jacob, Vargo, Gardella and Aebischer4 APTES is also used to strengthen the interface between polymer and inorganic phases in composites.Reference Bikiaris, Matzinos, Larena, Flaris and Panayiotou5, Reference González-Benito6
Although the effect of deposition and curing conditions on the surface morphology of APTES films has been reported,Reference Kim, Cho, Seidler, Kurland and Yadavalli2, Reference Kim, Seidler, Wan and Fill7–Reference Kim, Holinga and Somorjai11 the methods used do no not probe the internal structure of the films, and accordingly they provide no insight into the origin of improved hardness and wear resistance of APTES films. APTES films deposited from toluene and heptane, for example, are over two orders of magnitude harder than those prepared from polar or hydrated solvent systems.Reference Amemiya, Hatakeyarna and Shimamoto12 It also appears that multilayered APTES films are more wear resistant,Reference Gu and Cheng13 hinting that multilayered APTES films prepared from nonpolar solvents may be structurally unique.
In this article, we explore the relationship between reported performance improvements and the internal film structure. The internal structure and surface morphology of APTES films were measured using specular x-ray reflectivity (XRR), complemented by atomic force microscopy (AFM) and dye-binding analysis of the surface-active amine functionality. This is the first study of evolution and degradation of the internal structure of multilayer APTES films.
XRR provides structural information perpendicular to the substrate, extending from a few Ångström (Å) up to a micrometer. Structure is revealed through the scattering length density (SLD) profile perpendicular to the surface. In most cases the x-ray SLD is proportional to the electron density, which in turn depends on mass density and chemical composition. The SLD profile is obtained by inverting the XRR data using numerical techniques. For a typical coating system the SLD profile reveals layer density, layer thickness and interfacial roughness.Reference Dong, Wang, Argekar and Schaefer14
XRR analysis shows the formation of homogeneous and smooth APTES films. The film density varies markedly as a multilayer structure evolves with multilayered films being denser (∼1.26 g/cm3), than sub-bilayer counterparts (<1 g/cm3) and films prepared in the presence of water.Reference Heiney, Grüneberg, Fang, Dulcey and Shashidhar15 The density is not significantly affected by thermal curing. However, a high-temperature (HT) cure is necessary for hydrolytic stability. The observed densification effect is unusual and explains previously reported hardness and wear resistance improvements.
Aggregated structures have been observed at the APTES–air interface.Reference Vandenberg, Bertilsson, Liedberg, Uvdal, Erlandsson, Elwing and Lundström8–Reference Howarter and Youngblood10, Reference Amemiya, Hatakeyarna and Shimamoto12, Reference Heiney, Grüneberg, Fang, Dulcey and Shashidhar15, Reference Simon, Cohen-Bouhacina, Porte, Aime and Baquey16 However XRR indicates that these aggregates do not significantly affect the underlying film structure. Evidence is also presented in this article regarding the nature of the amine functionality in APTES films. A majority of amine groups remain embedded and unreactive in the film. To our knowledge this is the first analysis of the relationship between the internal structure of APTES films and its effect on film reactivity, stability, hardness and tribological behavior.
II. EXPERIMENTAL SECTION
A. Materials
N-doped single-side polished silicon (1 0 0) wafers (0.5-mm thick) were obtained from College Wafers, Inc (South Boston, MA). 3-aminopropyltriethoxysilane (APTES, 99%) was purchased from Aldrich, purified using vacuum distillation and stored refrigerated in a desiccator until used. Toluene (ACS grade, Pharmaco-AAPER) was dried over calcium hydride (Aldrich), distilled, and stored in a desiccator. Acetone (ACS grade, Pharmaco-AAPER), sulfuric acid and hydrogen peroxide (Fisher scientific) were used as supplied. All glassware was rinsed using deionized water and acetone, and dried for at least 24 h in a drying oven at 120 °C prior to use.
B. Pretreatment of silicon wafers
The received silicon wafers were cut into approximately 70 × 15 mm coupons. To facilitate the removal of organic contaminants, the coupons were initially rinsed using acetone, ethanol and deionized water before immersion in piranha solution [3:1 (v/v) sulfuric acid: hydrogen peroxide] for at least 2 h. The coupons were then rinsed with copious amounts of deionized water, dried under a stream of nitrogen and heated briefly (120 °C, 1 min) to remove residual water. The APTES deposition was carried out immediately after cleaning and drying of the silicon wafers.
C. APTES film deposition on silicon
A 1% (v/v) solution of APTES in anhydrous toluene was prepared in 40-mL glass vials. Pretreated silicon coupons were immersed in the APTES solution; the vials were flushed with nitrogen and sealed during deposition. After deposition, the APTES-coated coupons were rinsed using toluene and acetone, and dried under a stream of nitrogen.
D. Curing of deposited APTES film
We explored two curing protocols; an extended room-temperature (RT) cure, and a brief HT cure. The RT cure was carried out by placing the treated APTES-deposited silicon coupons in sealed 40-mL glass vials for 24 h. For the HT cure, the APTES coated coupons were cured at 120 °C in an oven for 1 h.
E. Stability of APTES film under neutral aqueous conditions
To determine the hydrolytic stability of APTES films, the as-is and cured APTES-coated coupons were exposed to neutral phosphate buffer (pH = 7.0 ± 0.1) for varying lengths of time. The samples were then removed from the buffer solution, rinsed with deionized water, and dried under a stream of nitrogen. The structure of the films was observed using XRR. Following this step, the samples were again exposed to the phosphate buffer.
F. X-ray reflectivity measurements
X-ray reflectivity measurement was performed using a diffractometer [XRR; model PANalytical X’pert Pro Materials Research Diffractometer (Westboro, MA) at the Advanced Materials and Characterization Center, University of Cincinnati]. The x-ray source (Cu Kα = 1.542 Å) was operated at 1.8 kW (45 mV, 40 mA). A typical alignment and reflectivity scan takes approximately 1 h. The normalized reflectivity data were analyzed using PANalytical X’Pert reflectivity software version 1.1. The simplest model (involving the least number of layers) that adequately fits the collected data was accepted. Based on the model obtained, the SLD profile (SLD dependence on perpendicular distance from the interface) was generated using Irena Macros 2.38 for Igor Pro 6.10.Reference Ilavsky and Jemian17
During fitting, the silicon substrate roughness was allowed to vary between 3–7 Å. We set the native oxide layer density at 2.2 g/cm3. To account for substrate variability, the native oxide layer thickness was allowed to vary slightly (13 ± 3 Å).
G. AFM measurements
Atomic force microscopic images were gathered using a microscope (AFM; Digital Instrument model Veeco Metrology Dimension 3100 AFM, Plainview, NY, with a Nanoscope IIIa controller in the tapping mode). The scans were performed on 10 × 10 and 0.5 × 0.5 μm areas on 24 h deposited APTES thin-films and roughness analysis was performed using Nanoscope 6.13b28 (Plainview, NY).
H. Chemical composition
The surface density of accessible amine groups was measured using a staining method.Reference Coussot, Perrin, Moreau, Dobrijevic, Le Postollec and Vandenabeele-Trambouze18 Silicon coupons of known surface area were masked on the unpolished side with electrical tape (3 M 1739-7 tape). Masked coupons were stained with 0.5 mg/mL Coomassie Brilliant Blue G-250 [thin layer chromatography (TLC)-purified] for 5 min at RT in 10% methanol/5% acetic acid with gentle shaking. After five washes in 0.3 mL of 10% methanol/5% acetic acid, the bound dye was stripped off using a solution of methanol and sodium carbonate (100 μL of a 1:1 mixture of 100% methanol: 0.25 M Na2CO3) for 1 min at RT with gentle shaking. After reacidification of the extracts with 2 μL of 6.85 M HCl (to maximize the blue color and absorbance at 610 nm), the concentration of dye in solution was calculated using visible light spectrophotometry at 610 nm. An extinction coefficient of 83,100 cm−1M−1 was used to calculate the number of moles of dye, which is equivalent to the number of moles of amino groups, from which the surface density of amino groups was calculated.
III. RESULTS AND DISCUSSION
A. Time-dependent evolution of the APTES film structure
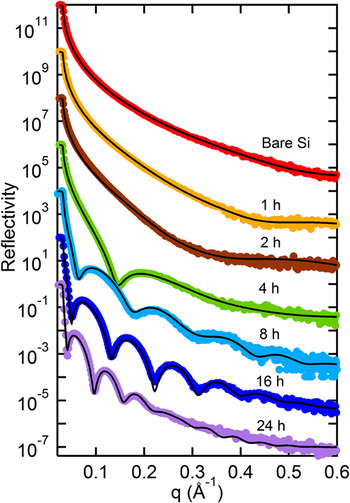
Typically the deposition of APTES films from nonpolar solvents is carried out utilizing 0.2–2% (v/v) concentration of APTES.Reference Kim, Cho, Seidler, Kurland and Yadavalli2, Reference Gu and Cheng13, Reference Simon, Cohen-Bouhacina, Porte, Aime and Baquey16, Reference Kim, Seidler, Fill and Wan19 We chose a concentration of 1% (v/v) to study the evolution of APTES film structure. XRR data and corresponding best-fits for APTES-coated samples at different stages of film deposition are shown in Fig. 1. A discernible change to the XRR profile occurs in 1 h and the film continues to evolve over the entire 24 h deposition period.
X-ray reflectivity data (colored solid dots) and corresponding fits (black lines) showing evolution of APTES film on silicon under anhydrous deposition conditions. The curves are shifted from each other by two orders of magnitude for clarity.

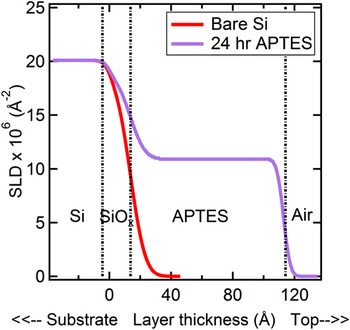
A two-layer structure (APTES over the native oxide) adequately fits the reflectivity data (Fig. 2). The film structure deviates from models used for long-chain silanes, which are typically fit using the expected profile based on the structure of the molecules.Reference Richter, Yu, Datta, Kmetko and Dutta20 Such detailed molecular structures are not required for short-chain silanes, which are adequately represented by a uniform layer with a broadened interface.
SLD profile for a representative 24 h deposited APTES as compared with a bare silicon wafer. The APTES layer is modeled as a single film of material over the native oxide film on the bare wafer.

Under the assumption that APTES is uncured, the 24 h film SLD implies a density of 1.26 ± 0.13 g/cm3. Partial curing (formation of Si–O–Si bonds) may occur during anhydrous deposition, especially at the oxide layer interface,Reference Kim, Seidler, Wan and Fill7 potentially compromising the density measurement. As cured and uncured APTES have nearly the same SLD (±4%), however, the value obtained from the XRR fits reliably represents APTES film density.
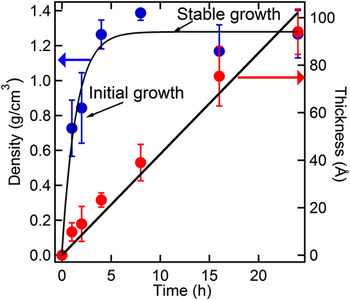
The evolution of APTES layer thickness and density with time is shown in Fig. 3. After 1 h of deposition the layer thickness (10 ± 4 Å) is close to that expected for an APTES monolayer. At 2 h, a two-molecule-thick layer accumulates. Over the entire deposition period, the APTES layer thickness increases linearly at ∼4.2 Å/h. In contrast to the linear thickness increase, the evolution of layer density shows two distinct stages. During the initial stage (from 0–4 h) the density increases rapidly but stabilizes after 4 h at 1.26 g/cm3. At 1 h the layer density is 0.72 ± 0.16 g/cm3, somewhat less than the neat silane (0.94 g/cm3).
Thickness (red dots) and density (blue dots) evolution of APTES layers under anhydrous deposition conditions.

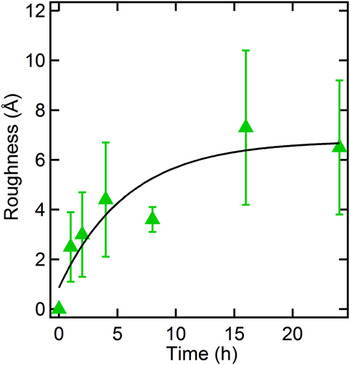
The evolution of APTES—air interfacial roughness is shown in Fig. 4. After 1 h of deposition, the single-layer film shows a roughness of ∼3 Å, which increases to ∼7 Å after 24 h. When compared with the thickness of the 24 h deposited APTES layer (94 Å) however, this roughness remains small. The increase in roughness is not proportional to film thickness, indicating the films become relatively smoother with increasing deposition timespan.
Evolution of APTES-air interfacial roughness for anhydrous deposition.

The observed APTES deposition profile can be explained by adsorbed water on the silicon wafer interface. Deposition is strongly affected by adsorbed waterReference Vandenberg, Bertilsson, Liedberg, Uvdal, Erlandsson, Elwing and Lundström8 as APTES hydrolyzes and condenses rapidly in the presence of water.Reference Beari, Brand, Jenkner, Lehnert, Metternich, Monkiewicz and Siesler21 In the initial stages of deposition, surface-adsorbed water contributes to the partial hydrolysis and condensation resulting in covalent bonding of APTES at the silicon substrate. Irreversible bonding produces poorly packed molecules with substantial unoccupied volume, accounting for the observed sparse initial coverage. This view is supported by the fact that APTES films generated in the presence of water exhibit lower density.Reference Heiney, Grüneberg, Fang, Dulcey and Shashidhar15
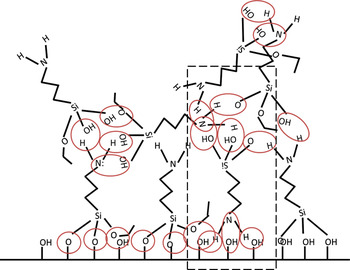
After consumption of the surface adsorbed water, hydrogen bonding increasingly influences deposition. Spectroscopic studies indicate that hydrogen bondingReference Vandenberg, Bertilsson, Liedberg, Uvdal, Erlandsson, Elwing and Lundström8, Reference Kim, Holinga and Somorjai11, Reference Kim, Seidler, Fill and Wan19 is the key mechanism involved in APTES deposition under anhydrous conditions. Hydrogen bonding can result in unhydrolyzed APTES molecules with intact ethoxy groups adsorbing on the initial covalently bound APTES layer. A schematic of a partially hydrolyzed APTES molecules deposited at the native oxide interface is shown in Fig. 5.
Schematic structure of APTES films under anhydrous deposition conditions. Some condensation may occur between APTES molecules and the native interface. However, the APTES molecules are held at the substrate by hydrogen bonds. Red circles denote bonding (both covalent and hydrogen bonding) while the highlighted section is meant to demonstrate that APTES molecules are bound at multiple sites through the film.

The film continues to increase in density as further deposition ensues through hydrogen bonding with further APTES deposition compressing the layers closest to the substrate. The film density stabilizes after 4 h of deposition to a level 27% denser than the neat silane (0.942 g/cm3). This densification effect has not been observed for other silanes. Richter et al.,Reference Richter, Yu, Datta, Kmetko and Dutta20 for example, report an SLD of (8.0 ± 0.3) × 10−6/Å2. for octadecyltrichlorosilane monolayers from heptane, which is slightly less than that of the neat silane, 9.11 × 10⁻⁶/Å2. Wasserman et al.Reference Wasserman, Whitesides, Tidswell, Ocko, Pershan and Axe22 report similar SLD's for long-chain silane monolayers.
The densification effect is also not observed for APTES films deposited from aqueous or dilute solutions. For instance, Heiney et al.Reference Heiney, Grüneberg, Fang, Dulcey and Shashidhar15 deposited prehydrolyzed APTES on Si wafers in the presence of water, and reported that layer densities were comparable to the neat silane. Zhang et al. used a low concentration (0.24% v/v) of APTES in toluene, and reported multilayer formation with sparse layer density (0.46 g/cm3). Only Birkholz et al.Reference Birkholz, Zaumseil, Kittler, Wallat and Heyn23 reported a dense APTES film (1.21 g/cm3) using chloroform as the solvent, at a significantly higher silane concentration (6.6% v/v). It appears that dense APTES film formation depends on concentration of the silane.
We believe the observed high density of APTES films is due to partial curing of APTES films. In the cured state, the APTES structure is smaller than the uncured molecule due to absence of ethoxy groups. The density of uncured APTES is also sensitive to the nature of the alkoxy groups. For instance, 3-aminopropyltrimethoxysilane (APTMS) with its three methoxy groups is significantly denser (1.027 g/cm3) than APTES, which has three ethoxy groups. The extreme limit due to (Si–O–Si) linkages at the interface is silicon dioxide (SiO2), whose density is twice that of APTES. Indeed, Vallée et al.Reference Vallée, Goullet, Granier, van der Lee, Durand and Marlière24 find a 100% increase in density on condensation of tetraethyl orthosilicate (TEOS) films. Given these facts, a 27% increase observed in APTES films is quite credible. The absence of ethoxy groups and increased hydrogen bonding within the partially cured APTES molecule may account for the observed increase in film density.
Tribological studies have shown that APTES films, formed using anhydrous deposition, are harder, more stable and show greater wear resistance than those generated from aqueous deposition.Reference Amemiya, Hatakeyarna and Shimamoto12, Reference Gu and Cheng13, Reference Simon, Cohen-Bouhacina, Porte, Aime and Baquey16 The observed densification effect accounts for these observations.
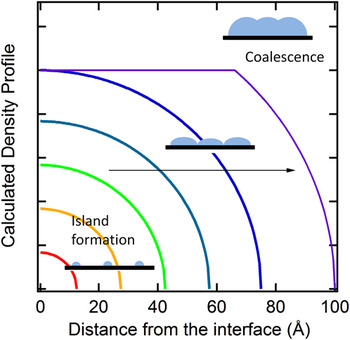
The measured interfacial roughness at the APTES-air interface also remains small during deposition. Silane deposition may occur due to either island growthReference Bierbaum, Grunze, Baski, Chi, Schrepp and Fuchs25 or a gradual buildup at the interface, without recognizable island-like structures.Reference Wasserman, Whitesides, Tidswell, Ocko, Pershan and Axe22
Island growth predicts significantly rougher interfaces during island nucleation, followed by a smoothening of the interface during coalescence.Reference Kellerman, Chason, Adams, Mayer and White26 The theoretical density profiles for hemispherical island growth demonstrate this phenomenon (Fig. 6). These profiles differ significantly the profile shown in Fig. 2 leading us to reject island type growth.
Calculated density profiles for island-based deposition mechanism. As islands grow, the layer roughens until coalescence starts, after which the layer tends to smooth out. Such profiles are not observed in our experiments.

Instead, the interfacial roughness increases rapidly in the initial stages of deposition and levels out as deposition continues (roughness ∼6 Å). We believe partial condensation of APTES molecules in the initial stages of deposition may result in poor packing, resulting in a lower surface density and slightly elevated roughness. Further APTES deposition, driven by hydrogen bonding allows for some restructuring of the film resulting in a slower rate of increase in roughness. XRR data are consistent with a gradually accumulating APTES layer, in contrast to previously reported island-based growth.Reference Gu and Cheng13
Our observation of smooth films seems to conflict with AFM and scanning electron microscopy (SEM) studies on multilayer APTES films generated under similar deposition conditions,Reference Vandenberg, Bertilsson, Liedberg, Uvdal, Erlandsson, Elwing and Lundström8–Reference Howarter and Youngblood10, Reference Amemiya, Hatakeyarna and Shimamoto12, Reference Heiney, Grüneberg, Fang, Dulcey and Shashidhar15, Reference Simon, Cohen-Bouhacina, Porte, Aime and Baquey16 which report aggregate formation during deposition leading to much rougher film surfaces. For instance, Howarter et al.Reference Howarter and Youngblood10 find a rougher (root mean square roughness 118 Å), and thinner film (50 Å) with multiple island formations. These authors claim that partially hydrolyzed APTES can perpetrate self-condensation locally, which leads to aggregated structures formed in solution that deposit on the surface.
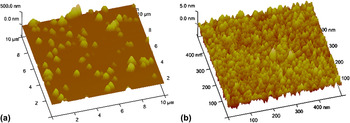
We performed AFM analysis on dry, 24 h deposited APTES films [Fig. 7(a)] that confirms a much higher value of surface roughness (∼270 Å). The apparent inconsistency in roughness can be explained by the differences in the surface characterization techniques.
(a) Tapping mode AFM images for 24 h deposited APTES film (10 × 10 μm). Aggregated structures are seen studding underlying the smooth APTES film observed by XRR. The AFM roughness is 270 Å. (b) Tapping mode AFM images for a 24 h deposited APTES film, showing a close up section (500 × 500 nm) of the substrate without aggregate structures. The calculated roughness is 5.5 Å.

XRR is sensitive to variations in roughness of the APTES—air interface. Sparsely placed large-scale structures show little scattering and are nearly invisible to XRR. In contrast, roughness values from AFM include the aggregated structures deposited over the APTES film. Our reflectivity measurements imply that these aggregates do not alter the homogeneity of the underlying APTES film. AFM roughness values (5.5 Å) for regions without aggregates correlate well to XRR-measured interfacial roughness (∼6 Å) [Fig. 7(b)]. Our XRR studies and complementary AFM analysis indicate that the APTES film is deposited smoothly over the silicon substrate, occasionally studded with aggregated structures. Importantly, however, the underlying film structure is uniform.
B. Stability of uncured APTES films
The evolution of APTES multilayers under anhydrous conditions indicates that a majority of molecules are uncured and held together by hydrogen bonds. Hydrogen-bonded APTES can be washed away by protic, polar solvents. To determine the extent of loosely bound APTES, we exposed 24 h freshly deposited coupons to a pH-neutral aqueous phosphate buffer. The uncured coupons are not subjected to any post-deposition cure. Minimal curing may have occurred, however, during sample preparation and XRR measurements (∼1 h).
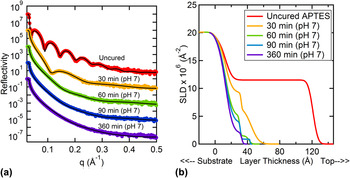
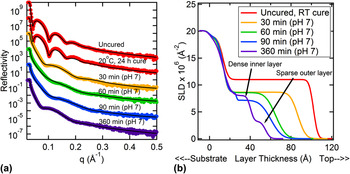
The XRR data and corresponding fits for uncured APTES films before and after exposure to neutral buffer solution are shown in Fig. 8(a). After only 30 min, both thickness and density of the APTES layer decreased substantially, with an over 70 Å thickness reduction [Fig. 8(b)].
(a) Stability of uncured APTES films exposed to neutral phosphate buffer. The reflectivity data (colored dots) and best fits (solid black lines) have been shifted for clarity. The uncured sample was measured immediately after deposition and not subjected to any post deposition curing. (b) SLD profiles for uncured APTES exposed to neutral phosphate buffer. The detailed shape of the curves for times greater than 60 min is less reliable due to the featureless nature of the reflectivity profiles in Fig. 8(a).

The layer-structure can be described as a sparse, rough (0.7 g/cm3) top layer with a denser region closer to the interface (1.0 g/cm3), whose density is approximately that of neat APTES. Continued exposure to pH 7 buffer further reduces layer density and thickness. After 360 min, a diffuse APTES layer structure remains, with a SLD of 2 × 10⁻⁶/Å2, corresponding to a layer density of 0.22 g/cm3 and layer thickness of 20 Å, with over 90 mass% of APTES lost from the film.
The thickness of the remaining APTES corresponds well to that of a 4-h deposited APTES layer, indicating that APTES deposited during the initial stages is covalently bound to the substrate, and is not washed away by aqueous buffer. Thus, the morphology of the film may be described as an easily removed “carpet” of hydrogen bonded APTES over the covalently bound surface layer. These results imply that curing is essential to stabilize APTES films, especially for applications where long-term stability of the film under aqueous conditions is necessary. There may be partial curing of APTES throughout the layer but the extent is not sufficient to prevent dissociation from the surface.
C. Effect of curing on the stability of APTES films
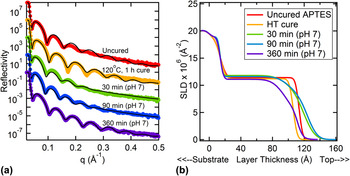
We investigated the effect of time and temperature of curing on the stability of the multilayer APTES film. Specifically, room-temperature (RT, 24 h) and high-temperature (HT, 120 °C, 1 h) cures were used (details described in Sec. II.). The XRR data for uncured APTES, followed by postdeposition RT cure and subsequent exposure to pH 7 buffer are shown in Fig. 9(a). The corresponding SLD profiles are shown in Fig. 9(b). Figure 10(a) shows XRR data for HT-cured films subsequently exposed to pH 7 buffer, while Fig. 10(b) shows the corresponding SLD profiles.
(a) Stability of RT-cured APTES films exposed to neutral phosphate buffer. The reflectivity data (colored dots) and best fits (solid black lines) have been shifted vertically for clarity. The uncured sample was measured immediately after deposition, followed by RT curing for 24 h. (b) SLD profiles for RT-cured APTES exposed to a pH 7 buffer for increasing times. Both uncured and RT cured profiles are identical, indicating no changes in the morphology of the APTES film due to the cure.

Stability of HT-cured APTES films exposed to neutral phosphate buffer. The reflectivity data (colored dots) and best fits (solid black lines) have been shifted vertically for clarity. The uncured sample was measured immediately after deposition, followed by HT curing (120 °C, 1 h). (b) SLD profiles for HT-cured APTES exposed to a pH 7 buffer for increasing times. HT cure results in a reduction in film thickness. The film remains stable over long time durations when exposed to pH 7 buffer.

The effect of RT cure on the morphology of the APTES layers was inconsistent (not shown). Some samples showed small increases (in the thickness range up to 5 Å), while others showed almost no change in the layer morphology as in Fig. 9(a). The small morphological changes are attributed to partial APTES condensation, as the Si–O–Si bonds formed during condensation are flexible and may allow for layer restructuring.
A 24 h RT cure leads to some improvement in stability under neutral aqueous conditions. Thirty-minute exposure to the neutral buffer results in a decrease in both SLD (8.64 × 10⁻⁶/Å2) and thickness (74 Å) of the layer, following a similar trend to the uncured APTES films [Fig. 8(b)]. However, the magnitude of material loss is less for the RT-cured films. The film density stabilizes, while thickness continues to decrease from 30–60 min. Longer exposure to the neutral buffer further decreases the film thickness, and a two-layer structure is formed, with the denser layer closer to the substrate and a sparse outer layer. After 360 min of exposure, the inner layer and outer layer exhibit SLDs of 8.64 × 10⁻⁶/Å2 and 3.21 × 10⁻⁶/Å2 respectively. We did observe slight roughening at the native oxide–APTES interface, which may occur due to reorganization of the remaining APTES molecules.
RT curing increases the APTES layer stability, but only marginally [compare Figs. 8(b) and 9(b)]. This observation agrees with curing studies by Vandenberg et al.Reference Vandenberg, Bertilsson, Liedberg, Uvdal, Erlandsson, Elwing and Lundström8 After 30 min of exposure to the neutral buffer, the amount of material remaining in the RT cured film is three times greater than for the uncured APTES. The two-layer structure with a denser layer at the native oxide interface implies that degradation in the neutral buffer solution proceeds inward from the film-solution interface. The two-layered structure also suggests that greater APTES condensation and stronger bonds are formed closer to the native oxide layer.
In contrast to RT curing, where no loss of material is seen during the cure [Fig. 9(b)], HT curing results in some loss of material from the APTES films [Fig. 10(b)]. On HT curing the APTES layer SLD remains almost constant at 11 × 10−6/Å2 while the thickness decreases by 7 Å [Fig. 10(b)], corresponding to a ∼9% loss of mass, indicating shrinkage of the layer.
The HT curing substantially increases film stability. Exposure to neutral buffer results in minimal change in SLD when compared with the uncured state [Fig. 10(b)]. Some roughening of the air-APTES interface is seen, but the internal structure (i.e., SLD) is stable. Interestingly, for 1 h after immersion of the film in water, some swelling is observed (∼17% increase in mass), along with roughening at the air-APTES interface. The swelling of amine-containing silane films is not unique to APTES. Previous vapor swelling neutron reflectivity and FTIR analyses have shown up to 33 volume% swelling of bis-aminosilane films upon exposure to D2O vapor.Reference Wang, Wang, Kohls, Hamilton, Schaefer and Mittal27
APTES films can also show swelling behavior.Reference Jang and Kim28 It is possible that some water is trapped in the APTES film after exposure to the buffer solution. Neutron reflectivity studies will be needed to generate the necessary contrast to determine water distribution in the APTES film. XRR cannot accurately identify the composition of the APTES film after exposure to the buffer.
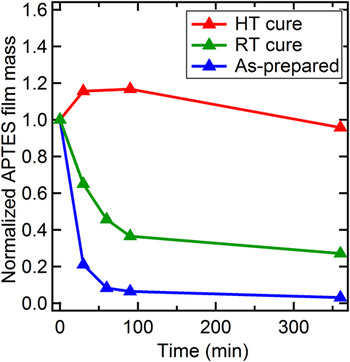
The area under an SLD profile is quantitatively related to the total mass in the film. We calculated total material in the APTES films before and after exposure to the neutral buffer. The resulting mass-loss curves were normalized to show the effect of curing on the relative stability. The effect of curing on total mass is summarized in Fig. 11.
Effect of curing on the normalized total mass of APTES exposed to a pH 7 buffer. The mass increase observed for the HT cure may be due to initial water uptake.

Two important observations can be made regarding mass loss. (i) A majority of material is lost in 90 min of exposure to the neutral buffer. (ii) HT cured films are very stable in neutral aqueous solution. After 360 min of exposure to the neutral buffer, the HT cured films retain an order of magnitude more APTES than uncured films. The initial increase in film mass reflects an initial 17% water swelling effect.
An approximate calculation of the extent of condensation shows that the HT curing accounts for 20% of the total Si–O–Si crosslinks. Silane-curing occurs in two steps: (i) hydrolysis of the alkoxysilane resulting in released ethanol; (ii) condensation between silanol groups, and between silanol and alkoxysilane groupsReference Howarter and Youngblood10 resulting in release of water. Complete curing results in the incorporation of three water and release of six ethanol molecules for every two APTES molecules in the film. However, care was taken to prevent hydrolysis of APTES film prior to anhydrous deposition. Some molecules necessary for the hydrolysis of the alkoxysilane therefore may be generated from APTES molecules themselves, following initial hydrolysis and condensation at the silicon substrate. Water necessary for hydrolysis may also be absorbed from moisture in the air after anhydrous deposition. For the purpose of this calculation we assumed water is already present in the film, and only ethanol is released upon HT cure. This calculation shows that approximately 15 molecules/nm2 of ethanol are released from 34 molecules/nm2 of uncured APTES corresponding to one molecule of ethanol for every two APTES molecules. A complete cure of APTES from the unhydrolyzed or condensed state would result in the release of six ethanol molecules. Therefore, the HT cure results only in ∼20% curing of the layer. Assumption that a complete cure is obtained after HT cure, the uncured APTES film is roughly 80% crosslinked.
We must point out however that this analysis can only reveal a possible maximum extent of curing value prior to the HT cure. XRR analysis of the APTES layer cannot specifically identify the lost material. Future studies to determine extent of water and ethanol loss may provide more accurate information regarding the extent of precuring and water absorption prior to a HT cure. Nonetheless, the information obtained reveals that some condensation occurs in APTES films prior to curing. Whatever the level of crosslinking, it is insufficient to prevent penetration of water into the film. HT cure drives covalent bonding in the APTES layer, while maintaining its density with some shrinkage. Thus curing of the APTES film maintains its dense layer morphology, while improving the hydrolytic stability of the film.
These observations show that curing of APTES films is essential for the stability needed for most applications. Uncured films rapidly lose integrity. RT curing helps somewhat, but such films still hydrolyze in a matter of hours. HT curing is essential to assure long-term stability. Even with HT curing, we observed some water penetration and degradation of the APTES - air interface, indicated by its roughening after an extended time; however the HT cure is superior to other curing approaches. Our results are in qualitative agreement with previous reports on the effect of curing.Reference Vandenberg, Bertilsson, Liedberg, Uvdal, Erlandsson, Elwing and Lundström8, Reference Kim, Seidler, Fill and Wan19
D. Accessibility of amine functionality in APTES films after curing
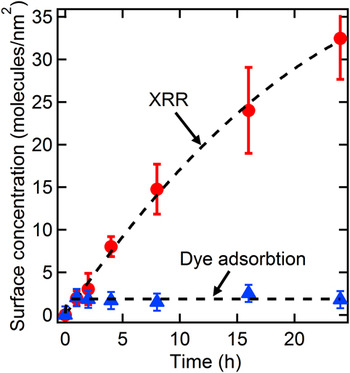
To ascertain the impact of dense APTES film structure on reactivity of the amine functionality the accessible amine concentration from HT-cured APTES films was determined on the basis of Coomassie blue dye adsorption. Coomassie blue primarily binds to the positive charges contributed by the amine groups that are unhindered, so dye concentration is proportional to accessible amine groups.Reference Coussot, Perrin, Moreau, Dobrijevic, Le Postollec and Vandenabeele-Trambouze18 The surface areal coverage of APTES was calculated from XRR and compared with the accessible amine density calculated from dye binding. The results are shown in Fig. 12.
Comparison of accessible amine functionality (determined by Coomassie blue dye adsorption) and total surface APTES molecule concentration (determined by XRR) as a function of APTES deposition time in HT cured APTES films.

XRR shows that APTES surface concentration continually increases as a function of APTES deposition time. After 1 h a surface areal coverage of 2 molecules of APTES molecules/nm2 is obtained, increasing to 3 molecules/nm2 in 2 h as multilayers accumulate. APTES surface density monotonically increases to 33 ± 4 molecules/nm2 in 24 h. It must be noted that quantification of surface areal coverage obtained from XRR is based on the assumption of uncured APTES films. If we assume curing within the film, surface areal coverage values would be considerably higher.
The measurement of the dye-accessible amine groups shows a different trend. After 1 h of deposition, the accessible amine concentration is the same as the APTES molecules accumulated on the surface (∼2 amine groups/nm2). However the accessible amine concentration does not increase as APTES multilayers are formed. The accessible amine concentration remains constant independent of deposition time. Jang et al.Reference Jang and Liu29 report similar deposition-time-independent immobilization of fluorescein isothiocyanate (FITC) on APTES thin films. However the amine density was not measured. Interestingly, our dye-binding amine concentration is an order of magnitude higher than reported by Vaughn et al.Reference Wang and Vaughn9
Although thick APTES layers are formed at longer deposition times, the amine groups within the layer are masked and inaccessible. This sequestration is due to the density of the cured APTES layer. A dense layer prevents penetration of dye. Our results indicate that only amine groups at the APTES-air interface are chemically reactive. Kim et al.Reference Kim, Holinga and Somorjai11 have recently reported that curing reorganizes anhydrously deposited APTES and forms well-ordered reactive amino groups. However, the current results indicate that, while reorganization of APTES molecules may occur during curing, a majority of amine groups within the film remain inaccessible.
IV. CONCLUSIONS
XRR was used to study anhydrous deposition of APTES, complemented by AFM and chemical analysis. We studied the evolution of the APTES film structure, noted the effect of curing on film stability and identified the accessibility of amine groups in the multilayered films. Our significant conclusions are:
(1) The deposition of APTES over inorganic substrates from nonpolar solvents occurs in two stages: Initially, a less dense (∼1 g/cm3) covalently bound APTES film is formed at the interface, followed by a significantly denser multilayer film (∼1.26 g/cm3), held at the interface through hydrogen bonding.
(2) The interfacial roughness also increases rapidly during the initial stage of APTES deposition, and stabilizes as the layer thickens (roughness ∼6 Å). XRR data indicate that APTES is uniformly deposited during film evolution, as opposed to the island growth.
(3) Aggregated structures previously reported to form on APTES films were confirmed using AFM. However XRR data show the underlying film structure is uniform. Therefore the topology of the multilayer APTES film can be described as a smooth interface occasionally studded with large aggregated structures.
(4) The film density is higher than the native silane and is maintained as the APTES film grows. Densification above the precursor liquid value has not been observed in other silane films and explains the tribological observations by Gu et al.Reference Gu and Cheng13 and Simon et al., Reference Simon, Cohen-Bouhacina, Porte, Aime and Baquey16 and hardness enhancements reported by Amemiya et al.Reference Amemiya, Hatakeyarna and Shimamoto12
(5) Although a dense multilayer film is formed during anhydrous deposition, the APTES molecules at the air-film interface are hydrolytically unstable and easily washed away after exposure to a neutral buffer. Over 90% mass of the film is lost. After exposure only a thin, covalently bound APTES film remains at the substrate interface.
(6) The density of the APTES film also affects the accessibility of amine groups. Although multilayers of APTES are readily formed by anhydrous deposition, the majority of amine functionalities is trapped within the dense APTES layer and is chemically inactive. Independent of the deposition time, the reactive amine accessibility remains constant. Therefore, for the purposes of interfacial modification, single-layer films are just as effective as thick layers.Reference Jang and Liu29–Reference Metwalli, Haines, Becker, Conzone and Pantano31
(7) A HT cure is essential for the stability of APTES films. A 120 °C cure results in covalent binding of the APTES molecules both to themselves and to the surface-bound APTES layer, thereby dramatically improving layer stability.
ACKNOWLEDGMENTS
The authors thank the University of Cincinnati and the Membrane Applied Science and Technology Center for support for this research. The authors also thank Mike Starr for valuable discussions.