INTRODUCTION
Since the pioneering work of Anderson and May nearly 30 years ago (Anderson and May, Reference Anderson and May1978, Reference Anderson and May1979, Reference Anderson and May1981; May and Anderson, Reference May and Anderson1978, Reference Anderson and May1979), there has been a vast body of research aimed at developing mathematical models to study the population dynamics and epidemiology of host-parasite interactions. The original models were based on simplified 1-host-1-parasite systems, with different model formulations describing systems involving either microparasites (those that replicate within the host, such as viruses or bacteria; Anderson and May, Reference Anderson and May1981) or macroparasites (those that do not replicate within the host, such as parasitic helminths; Anderson and May, Reference Anderson and May1978; May and Anderson, Reference May and Anderson1978). A variety of modifications has been made to these models in the intervening years, including the incorporation of alternative host species (Begon et al. Reference Begon, Bowers, Kadiankis and Hodgkinson1992; Dobson, Reference Dobson2004), acquired immunity (Woolhouse, Reference Woolhouse1992; Roberts, Reference Roberts1999) and seasonality (Altizer et al. Reference Altizer, Dobson, Hosseini, Hudson, Pascual and Rohani2006). As a result there is a reasonable understanding of the key factors that affect parasite transmission, the incidence of disease and the stability and dynamics of host-parasite systems in general. However, one factor that has surprisingly remained unexplored is how the presence of different co-infecting parasite species affect each other's epidemiology, abundance and population dynamics.
In recent years there has been a growing interest in parasitic co-infection, due to the recognition that the vast majority of host individuals are typically co-infected with a diverse variety of parasite species (Petney and Andrews, Reference Petney and Andrews1998; Cox, Reference Cox2001; Pedersen and Fenton, Reference Pedersen and Fenton2007). Empirical studies into parasite co-infection have tended to follow one of three avenues of research. The first involves laboratory studies aimed at determining how co-infecting parasites alter immune responses within individual hosts (Romagnani, Reference Romagnani1996; Stewart et al. Reference Stewart, Boussinesq, Coulson, Elson, Nutman and Bradley1999). The second approach examines parasite abundance or prevalence data for evidence of interactions between co-infecting parasite species (Behnke, Ali and Jenkins, Reference Behnke, Ali and Jenkins1984; Poulin and Valtonen, Reference Poulin and Valtonen2002; Lello et al. Reference Lello, Boag, Fenton, Stevenson and Hudson2004). The third avenue of research follows a more applied angle, evaluating the impact of co-infecting parasites on disease occurrence within human populations, either through correlative patterns of abundance or following treatment (Correa-Oliveira et al. Reference Correa-Oliveira, Golgher, Oliveira, Carvalho, Massara, Caldas, Colley and Gazzinelli2002; Fleming et al. Reference Fleming, Brooker, Geiger, Caldas, Correa-Oliveira, Hotez and Bethony2006; Kelly-Hope et al. Reference Kelly-Hope, Diggle, Rowlingson, Gyapong, Kyelem, Coleman, Thomson, Obsomer, Lindsay, Hemingway and Molyneux2006). These studies have shown that the presence of one parasite can affect the occurrence and impact of another parasite, even if they are of completely different types (e.g. a macroparasite affecting disease caused by a microparasite). For example, gastrointestinal helminth infection can significantly increase infection rates and disease progression of both malaria (Spiegel et al. 200; Druilhe et al. Reference Druilhe, Tall and Sokhna2005) and HIV (Maggi et al. Reference Maggi, Mazzetti, Ravina, Annunziato, Decarli, Piccinni, Manetti, Carbonari, Pesce, Delprete and Romagnani1994; Bentwich, Kalinkovich and Weisman, Reference Bentwich, Kalinkovich and Weisman1995). Therefore co-infecting parasite species can and do interact within their hosts with important consequences not only for disease severity at the individual level but also, as shown here, for patterns of parasite occurrence at the population level. This means that effective long-term disease control programmes can only truly be designed based on a thorough understanding of the consequences for the wider parasite community. To date, however, the only attempts to develop models of multiple co-infecting parasite species have been restricted to multi-macroparasite (Dobson, Reference Dobson1985; Roberts and Dobson, Reference Roberts and Dobson1995; Gatto and De Leo, Reference Gatto and De Leo1998; Pugliese, Reference Pugliese2000; Bottomley, Ishasm and Basanez, Reference Bottomley, Isham and Basanez2005; Bottomley et al. Reference Bottomley, Isham and Basanez2007) or multi-microparasite species or strain models (Gog and Grenfell, Reference Gog and Grenfell2002; Pugliese, Reference Pugliese2002; Rohani et al. Reference Rohani, Green, Mantilla-Beniers and Grenfell2003); as yet there is no formal theoretical framework that allows predictions of the epidemiological consequences of microparasite-macroparasite co-infection.
The aim of this paper is to present an appropriate theoretical framework for understanding the population dynamic consequences of a host population comprising individuals that may be simultaneously infected with both a microparasite and a macroparasite. This framework is used to explore how a variety of host and parasite life-history traits affect parasite co-existence, the stability of the community and the quantitative abundance of the component species, before exploring how microparasite-macroparasite co-infection affects the outcome of control measures targeting one or other of the parasite species. At this stage the model is deliberately kept highly generic, rather than tailoring it to any specific empirical systems, to illustrate how co-infection per se alters the predictions of the standard 1-host-1-parasite models. Therefore the parameter values used do not relate directly to any host-parasite systems in particular, but are chosen to reflect key features of macroparasite and microparasite systems in general (e.g. high macroparasite fecundity, high degree of macroparasite aggregation, potentially high microparasite virulence).
METHODS
The microparasite-macroparasite model framework comprises a hybrid of the two separate models developed by Anderson and May (Anderson and May, Reference Anderson and May1978, Reference Anderson and May1981, Reference Anderson and May1992; May and Anderson, Reference May and Anderson1978). First these models are described separately and the parameters and state variables introduced, before they are combined to produce the full co-infection model. In what follows the subscripts ‘V’ (for “virus”) and ‘W’ (for “worm”) distinguish between parameters that may apply to either the microparasite or macroparasite respectively.
The microparasite model (Anderson and May, Reference Anderson and May1981; Fig. 1A)
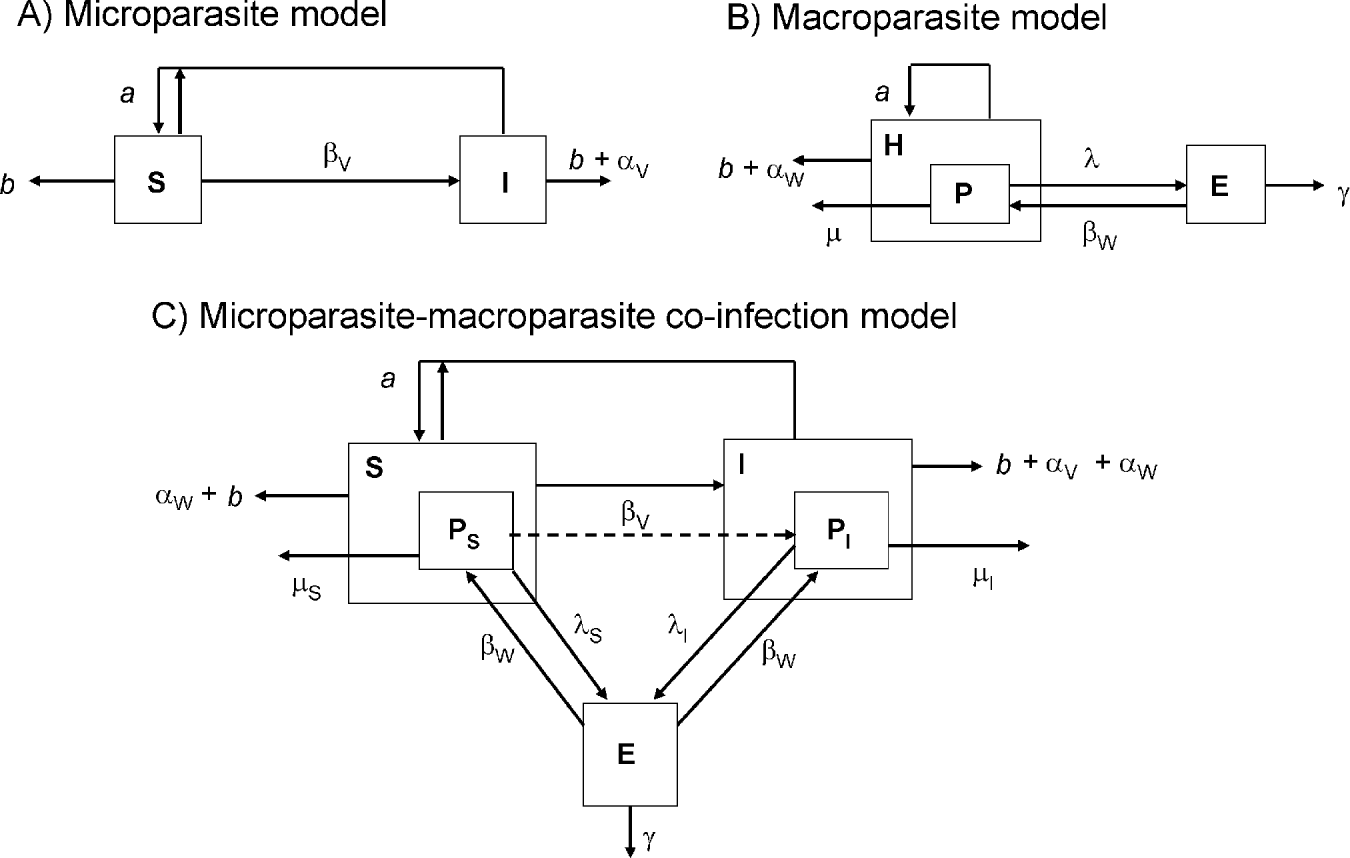
Since microparasites replicate within the host the basic microparasite model ignores parasite load and simply tracks host status (i.e. whether hosts are susceptible, S, or infected, I). At this stage the possibility of recovery following infection is ignored (i.e. the models are primarily ‘SI’ in nature), but the possibility of recovery (an ‘SIR’ model) is considered later. New susceptibles are produced at rate a from susceptible individuals and at rate a′ from infected individuals, where a′⩽a to allow for the possibility of reduced reproductive ability in infected hosts (although for the majority of the results presented here it is assumed that a′=a). Susceptibles become infected as a result of contact with an infected host, at rate βV-note that, in accord with the original model framework (Anderson and May, Reference Anderson and May1981), microparasite transmission is assumed to be linearly dependent on host density. Both susceptibles and infecteds die at background rate b, and infecteds die at an additional rate αV, which represents the virulence of the microparasite (hence, the net mortality rate of infected hosts is d=b+αV). A schematic representation for this model is shown in Fig. 1A, and all parameters are defined in Table 1.
Schematic diagrams of (A) the host-microparasite model, (B) the host-macroparasite model and (C) the microparasite-macroparasite co-infection model.

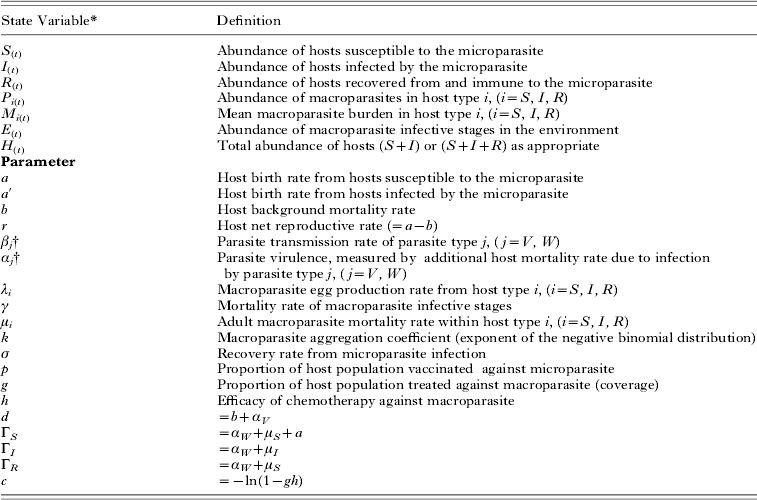
State variable and parameter definitions

Abundance is expressed in absolute numbers; mean burden=number of parasites per host; rates have dimensions per unit time; proportions are dimensionless.
* For notational convenience the subscript (t) is omitted from the equations in the main text.
† Parameters may be subscripted ‘V’ or ‘W’ to denote when they apply to microparasites (‘viruses’) or macroparasites (‘worms’) where appropriate.
The macroparasite model (May and Anderson, Reference May and Anderson1978; Fig. 1B)
For macroparasites it is important to keep track of the number of parasites within each host, since the infection burden influences both the degree of parasite-induced host mortality or morbidity (i.e. disease severity typically increases with increasing worm burdens) and also any density-dependent constraints acting on worm survival or fecundity. For this reason the basic model keeps track of the size of the host population, H, and the size of the parasite population, P, across all hosts. From this the mean worm burden can be calculated as M=P/H. As before, hosts reproduce at rate a and die at background rate b. However, the parasite may increase host mortality in a burden-dependent manner at rate αW (i.e. αW is the per capita virulence of an individual worm). Adult parasites die within the host at rate μ, due to a combination of natural and immune-mediated mortality, and produce eggs at rate λ, which pass into the environment to form infective stages, E. These infective stages either die at rate γ, or are picked up by new hosts at rate βW, where they become adult parasites. These adult parasites are assumed to be distributed among the hosts in an aggregated manner, described by the parameter k of the negative binomial distribution as parameterised by Elliot (Reference Elliott1977), where k is an inverse measure of the degree of overdispersion; very small values of k suggest the parasites are highly aggregated such that most hosts harbour very few parasites but some hosts have very high burdens, whereas high values of k suggest the parasites are distributed approximately randomly across the host population. A schematic representation for this model is shown in Fig. 1B, and all parameters are defined in Table 1.
The microparasite-macroparasite co-infection model (Fig. 1C)
The two models described above can be combined simply by keeping track of the separate worm burdens P S and P I within hosts susceptible to, or infected by, the microparasite, respectively (see Appendix A for details, also Perkins and Fenton, Reference Perkins and Fenton2006). Now, hosts susceptible to the microparasite, S, die at a rate determined by their background mortality rate, d, and the burden-dependent degree of macroparasite-induced mortality, αW, based on their mean burden (M S=P S/S). Similarly, hosts infected by the microparasite, I, die at a rate determined by b, αV (due to infection by the microparasite) and αW, based on their mean burden (M I=P I/I). Macroparasites from both host types produce eggs which pass into a common pool in the environment, but parasites from susceptible hosts (S) produce eggs at rate λS, whereas parasites from infected hosts (I) produce eggs at rate λI. If λS≠λI then this suggests some degree of within-host interference between parasites, possibly by impacting on the host's immune response to each parasite type, such that the presence of the microparasite either enhances (λI>λS) or reduces (λI<λS) macroparasite fecundity. Similarly, macroparasite mortality rates within each host type may vary (μS within hosts susceptible to the microparasite and μI within hosts infected by the microparasite), to allow for possible interactions between parasite types affecting macroparasite survival. Finally, it should be noted that when a susceptible host becomes infected by the microparasite the model adjusts the macroparasite burdens accordingly, since its macroparasites which previously contributed to P S now contribute to P I. A schematic representation for this model is shown in Fig. 1C, all parameters are defined in Table 1 and the equations of this model are:


Standard analytical techniques (see Appendices) are used to explore how microparasite-macroparasite co-infection affects the predictions of the standard single-parasite models.
Once again we emphasise that the primary concern of this paper is to show how co-infection per se affects the predictions of simple host-parasite models and that the choice of parameter values is not intended to reflect any host-parasite systems in particular. Clearly the following predictions are limited to the set of parameter values used. However, one of the main advantages of this model, and of the single-parasite models on which it is based (Anderson and May, Reference Anderson and May1978, Reference Anderson and May1981; May and Anderson, Reference May and Anderson1978), is that it has relatively few biologically-intuitive parameters which allow it to easily be tailored to a specific host-parasite system as appropriate.
RESULTS
The population dynamic consequences of microparasite-macroparasite co-infection
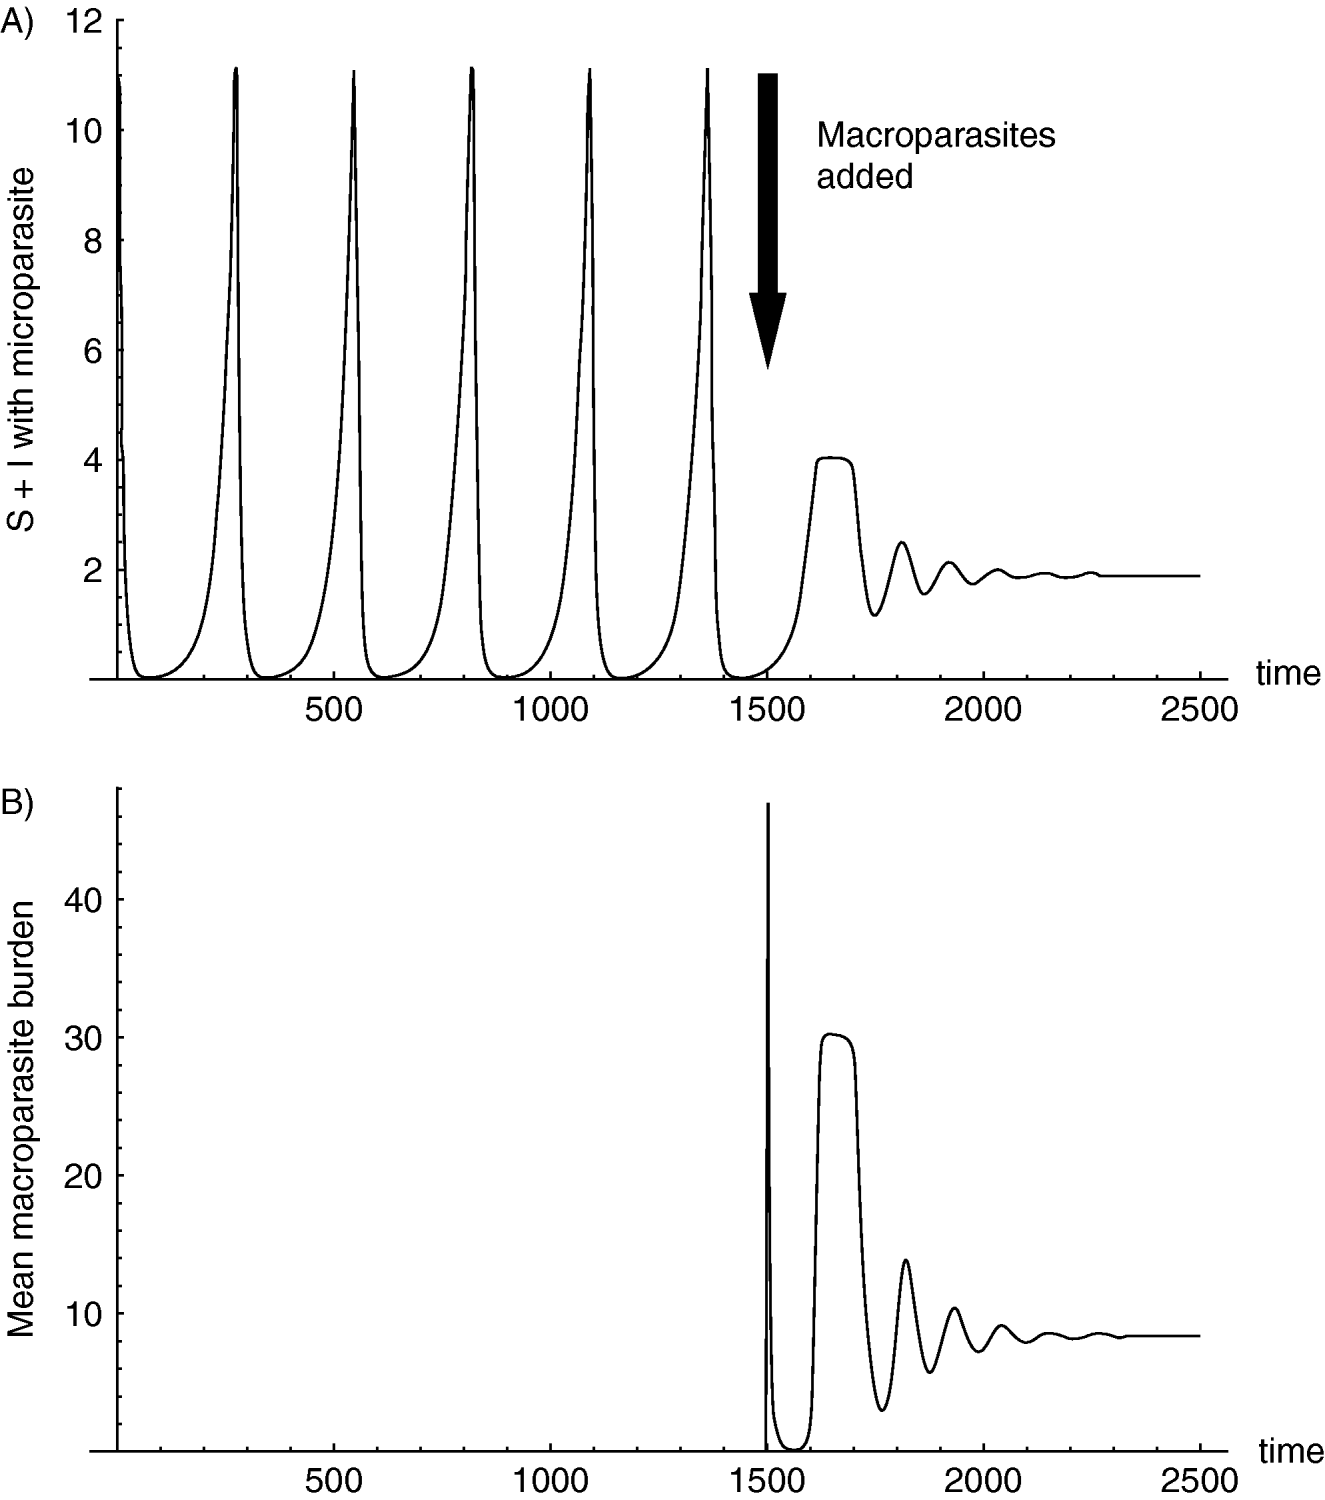
Firstly, by way of illustrating the importance of considering co-infection when developing models of host-parasite dynamics, the model was run initially with just the host and microparasite present, to show what a standard model would predict, before introducing the macroparasite and following the changes in dynamic behaviour of the community. For this the simplest model possible was used, with no reproduction by infected hosts (a′=0).
In the absence of the macroparasite the host-microparasite systems exhibited sustained oscillations, with recurrent microparasite epidemics over time (Fig. 2A). However, once the macroparasite was introduced the system rapidly settled down to a stable equilibrium where the host and the two parasite species coexisted in a stable community, resulting in endemic microparasite and macroparasite infection (Fig. 2A, B). This is due to the density-dependent mortality imposed by the macroparasite on the host population. The epidemic cycles observed in the absence of the macroparasite were neutrally stable, similar to those observed in the standard Lotka-Volterra predator-prey model, sitting on the knife-edge between stability and instability (May, Reference May1974; Begon, Harper and Townsend, Reference Begon, Harper and Townsend1996). Therefore, once the stabilising impact of density-dependent macroparasite-induced host mortality was introduced into the system it was rapidly stabilised to the observed equilibrium.
Population dynamics of the co-infection model, initially run with no macroparasites present, showing sustained oscillations in total host (S+I) abundance. Macroparasites were added at time=1500. a=0·05 time−1, b=0·02 time−1, a′=0 time−1, βV=0·08 time−1, βW=5×10⁻⁵ time−1, αV=0·1 time−1, αW=0·001 time−1, λS=λI=1000 time−1, μS=μI=0·05 time−1, k=0·1, γ=0·5 time−1.

The impact of co-infection on each parasite's basic reproduction ratio (R0)
One of the most important features of existing host-parasite models is the basic reproduction ratio (R 0) of the parasite (Anderson and May, Reference Anderson and May1992). This defines the reproductive potential of a parasite in a completely naïve (to that parasite species) host population in the absence of any density-dependent factors. By calculating R 0 for the microparasite and macroparasite alone (R 0,V0 and R 0,W0, respectively) or in the presence of the other parasite (R 0,VW and R 0,WV, respectively) a measure of how co-infection affects the reproductive potential of each parasite species can be obtained (see Appendix B for mathematical details). For the microparasite, R 0 in the presence of the macroparasite is:

The microparasite's basic reproduction ratio in the absence of the macroparasite (R 0,V0) is given by a similar expression, but with M I=0. Therefore the presence of a macroparasite always reduces a microparasite's reproductive potential, at a rate inversely proportional to the macroparasite's per capita virulence (αW). This is because the additional mortality due to infection by the macroparasite reduces the number of hosts infected by the microparasite, thereby reducing its force of infection. Therefore this model predicts that co-infection with a macroparasite will tend to be detrimental to the microparasite, providing the macroparasite causes increased host mortality. Clearly if the macroparasite is relatively benign (αW≈0) then co-infection will have little impact on the microparasite's R 0, assuming that the transmission coefficient of the microparasite is independent of infection by the macroparasite.
For the macroparasite, R 0 in the presence of the microparasite is given by:

where ΓS′=b+μS+αW and ΓI′=b+μI+αW+αV. To illustrate the impact of the microparasite on the macroparasite's basic reproduction ratio it was assumed that the macroparasite is very rare (M S=M I→0) and the microparasite was allowed to reach endemic equilibrium such that the values of S and I in the expression for R 0,WV are given by the equilibrium values S* and I* obtained by solving the simple host-microparasite model. Effectively this shows how the initial growth rate of a novel macroparasite introduced into a naïve host population is affected by the presence of an existing microparasite.
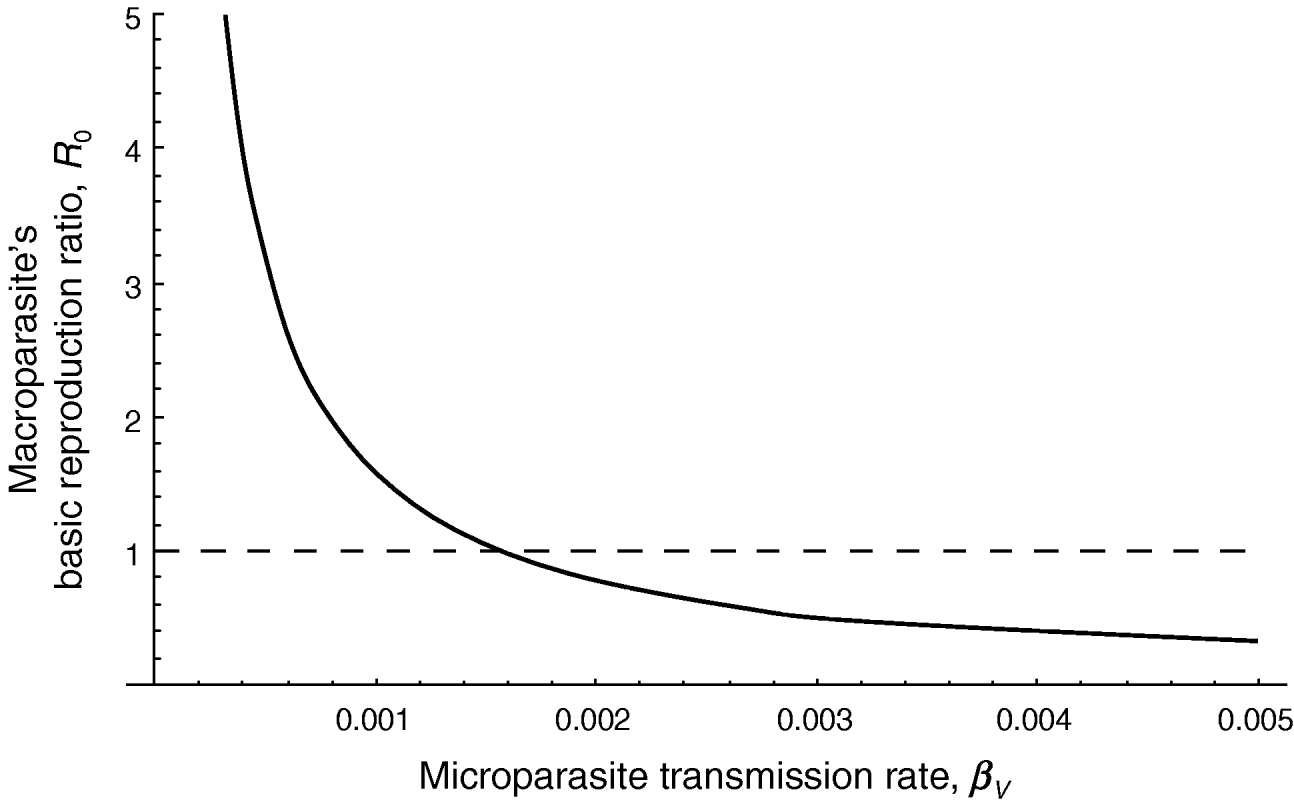
Once again, co-infection is detrimental to the parasite's basic reproduction ratio (Fig. 3); as the transmission rate of the microparasite (βV) increases so the macroparasite's R 0 decreases, due to the additional mortality caused by the microparasite reducing both the number of hosts available for the macroparasite and the size of the parasite population and therefore its reproductive potential. For sufficiently high values of βV the macroparasite's R 0 drops below the threshold value of 1, and the macroparasite dies out, as a result of co-infection.
The impact of microparasite transmission rate (βV) on the macroparasite's basic reproduction ratio, R 0,W. The dashed horizontal line shows the threshold value for macroparasite persistence at R 0=1. a=a′=0·05 time−1, b=0·02 time−1, βW=5×10⁻⁷ time−1, αV=0·1 time−1, αW=0·001 time−1, λS=λI=1000 time−1, μS=μI=0·05 time−1, k=0·1, γ=0·5 time−1.

Factors affecting microparasite-macroparasite co-existence
Next the conditions under which stable microparasite-macroparasite co-existence could occur were determined and how this was affected by different host and parasite life-history traits. Stability analysis was carried out using an invasibility analysis (see Appendix B for details), identifying regions of parameter space where the microparasite persists alone, or the macroparasite persists alone, or where both microparasite and macroparasite coexist.
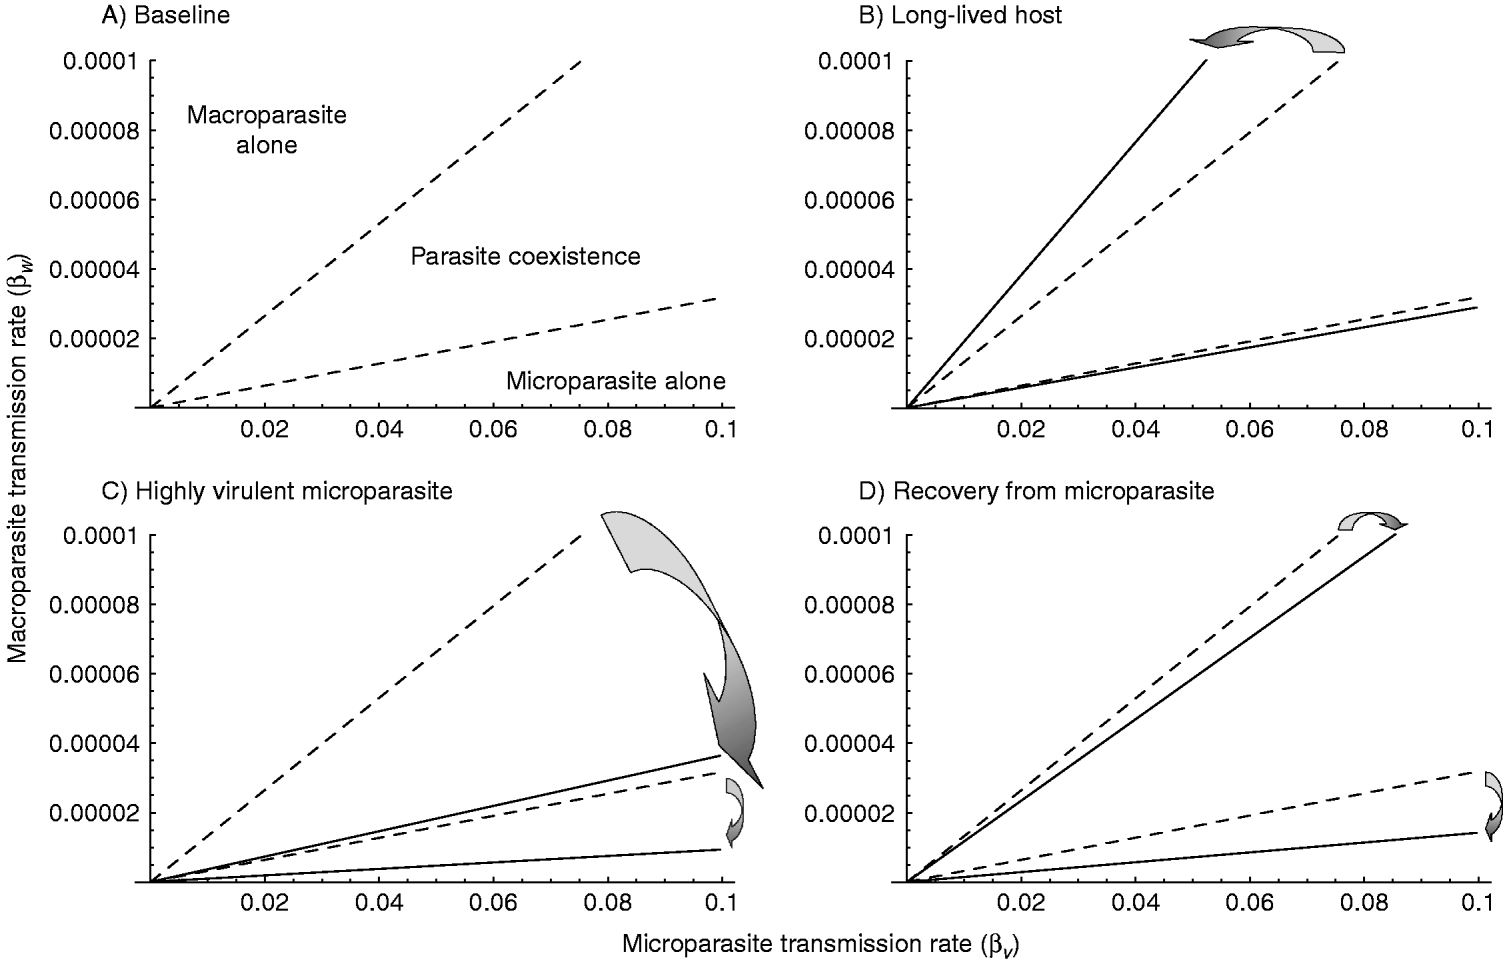
Broadly speaking, parasite coexistence is favoured if neither parasite is too infectious (Fig. 4A); very high levels of infectiousness by either parasite (i.e. high values of βV or βW) result in loss of the other parasite, as the size of the available host population is driven below the minimum threshold level needed for persistence of the other parasite. This illustrates the need to consider co-infecting species when exploring the factors affecting parasite persistence; in the absence of a microparasite (effectively when βV=0), the macroparasite can establish for any βW>0 because, in the absence of other regulating factors, the host population will eventually reach sufficient size for the macroparasite to persist. However, in the presence of the microparasite (i.e. when βV>0) the host population is regulated, thereby setting a minimum threshold value of βW, below which the macroparasite is unable to persist.
Results of stability analysis of the co-infection model, showing regions in βV – βW parameter space where (i) the microparasite persists alone, (ii) the macroparasite persists alone and (iii) microparasite and macroparasite coexist. (A) using ‘baseline’ parameter values, (B) increasing host longevity (b=0·002), (C) increasing microparasite virulence (αV=0·5), (D) allowing recovery from microparasite infection. The dashed lines show the boundaries as predicted by the baseline model and the solid lines show their location under each parameter adjustment; the major boundary shifts are indicated by the grey arrows. a=a′=0·05 time−1, b=0·02 time−1, αV=0·1 time−1, αW=0·001 time−1, λS=λI=1000 time−1, μS=μI=0·05 time−1, k=0·1, γ=0·5 time−1, σ=0·02 time−1.

Using this framework as a baseline it is possible to explore how different host and parasite traits affect parasite coexistence. For example, long-lived hosts (low b) favour parasite coexistence (Fig. 4B), particularly allowing the persistence of microparasites with low transmission rates. However, if either parasite species is too virulent then the likelihood of species coexistence may be drastically reduced (Fig. 4C), because this forces the host population below the critical threshold for the other parasite to establish. Finally, if hosts can acquire perfect immunity from microparasite infection such that they recover and cannot be re-infected (see Appendix C for details) this allows macroparasites to invade and persist at very low transmission rates, where they would otherwise be excluded by the presence of the microparasite (Fig. 4D).
The population-level consequences of within-host interspecific parasite interactions
The results presented so far assume that the different parasite species do not interact within the host; the observed impacts of co-infection arise purely as a result of the dynamic impact of both parasite species on host abundance. However, lab studies have shown that macroparasites and microparasites may interact in complex ways within individuals via the host's immune system. One often cited, although simplified, mechanism of interaction involves the way microparasites and macroparasites stimulate different arms of the T-helper (Th) response (Mosmann and Sad, Reference Mosmann and Sad1996; Romagnani, Reference Romagnani1996, Pritchard, Hewitt and Moqbel, Reference Pritchard, Hewitt and Moqbel1997). Typically intracellular microparasites stimulate the production of Th1 cells and their associated cytokines (e.g., interferon-γ and interleukin 12, IL-12), whereas macroparasites such as extracellular parasitic helminths stimulate the production of Th2 cells and their associated cytokines (e.g. IL-4, 5, 9, 10 and 13). Importantly, these two responses are antagonistic, at least locally within the host, so that if a host is co-infected with both parasite types it must down-regulate the response to one parasite in order to mount a response towards the other (e.g. Stewart et al. Reference Stewart, Boussinesq, Coulson, Elson, Nutman and Bradley1999). The specifics of the interactions between Th cells are more complex than this picture, involving other cell types that may cross-regulate cytokine or effector cell production but here it is simply assumed that the host faces some form of trade-off meaning that infection by one parasite reduces the host's ability to mount an effective response against another co-infecting parasite.
Such interspecific parasite interactions are incorporated into our model framework by allowing macroparasites within hosts infected with the microparasite to have a lower mortality rate or higher fecundity rate than macroparasites within hosts not infected by the microparasite (e.g., μI<μS or λI>λS). Similarly, the presence of a macroparasite may allow the microparasite to have increased transmissibility (βV), possibly by reducing the host's ability to control the number of infectious particles released into the environment. It is assumed that this propensity towards greater microparasite transmissibility increases linearly with the mean macroparasite burden within hosts infected by the microparasite, such that βV′=βV+δM I, where βV′ is the net microparasite transmission rate, βV is the baseline microparasite transmission rate in the absence of the macroparasite and δ is the per capita impact of each macroparasite on microparasite transmission.
Overall, within-host interactions between different parasite species have little impact on the population-level persistence or stability of the community (Fig. 5). If the presence of a microparasite favours the macroparasite, either by increasing its survival (Fig. 5A) or, in particular, its fecundity (Fig. 5B) then this allows the macroparasite to become established at lower values of βW than it would otherwise be able to. When the presence of a macroparasite favours microparasite transmission, the region of parasite coexistence is increased, most noticeably at very low microparasite transmission rates (i.e. low βV; Fig. 5C). Indeed, such an interaction makes it is possible for the microparasite to persist even when it would have absolutely no effective transmission in the absence of the macroparasite (i.e. when βV=0), due to the macroparasite releasing it from the suppressive control of the host's immune system. Finally, co-infection may lead to increased host mortality, either due to the energetic cost to the host of mounting a combined immune response, or as a result of immunologically-derived damage to the host. This scenario was modelled by allowing macroparasite virulence in microparasite-infected hosts (αW,I) to be greater than macroparasite virulence in microparasite-free hosts (αW,S). Interestingly, such a scenario increases the range of parameter space in which the macroparasite persists alone, reducing the likelihood of parasite co-existence (Fig. 5D). Therefore, increased host mortality in co-infected hosts may make microparasite persistence less likely.
Results of stability analysis of the co-infection model, showing regions in βV−βW parameter space where (i) the microparasite persists alone, (ii) the macroparasite persists alone and (iii) microparasite and macroparasite coexist, where the presence of one parasite species has a positive impact on the fitness of the other parasite species. (A) microparasite decreases macroparasite mortality (μS=μI×0·01), (B) microparasite increases macroparasite fecundity (λS=λI×5), (C) macroparasite increases microparasite transmission (βV′=βV+5×10⁻⁴M I), (D) microparasite increases macroparasite virulence (αW,I=αW,S×3). The dashed lines show the boundaries as predicted by the baseline model and the solid lines show their location under each parameter adjustment; the major boundary shifts are indicated by the grey arrows. a=a′=0·05 time−1, b=0·02 time−1, αV=0·1 time−1, αW=0·001 time−1, λS=λI=1000 time−1, μS=μI=0·05 time−1, k=0·1, γ=0·5 time−1.

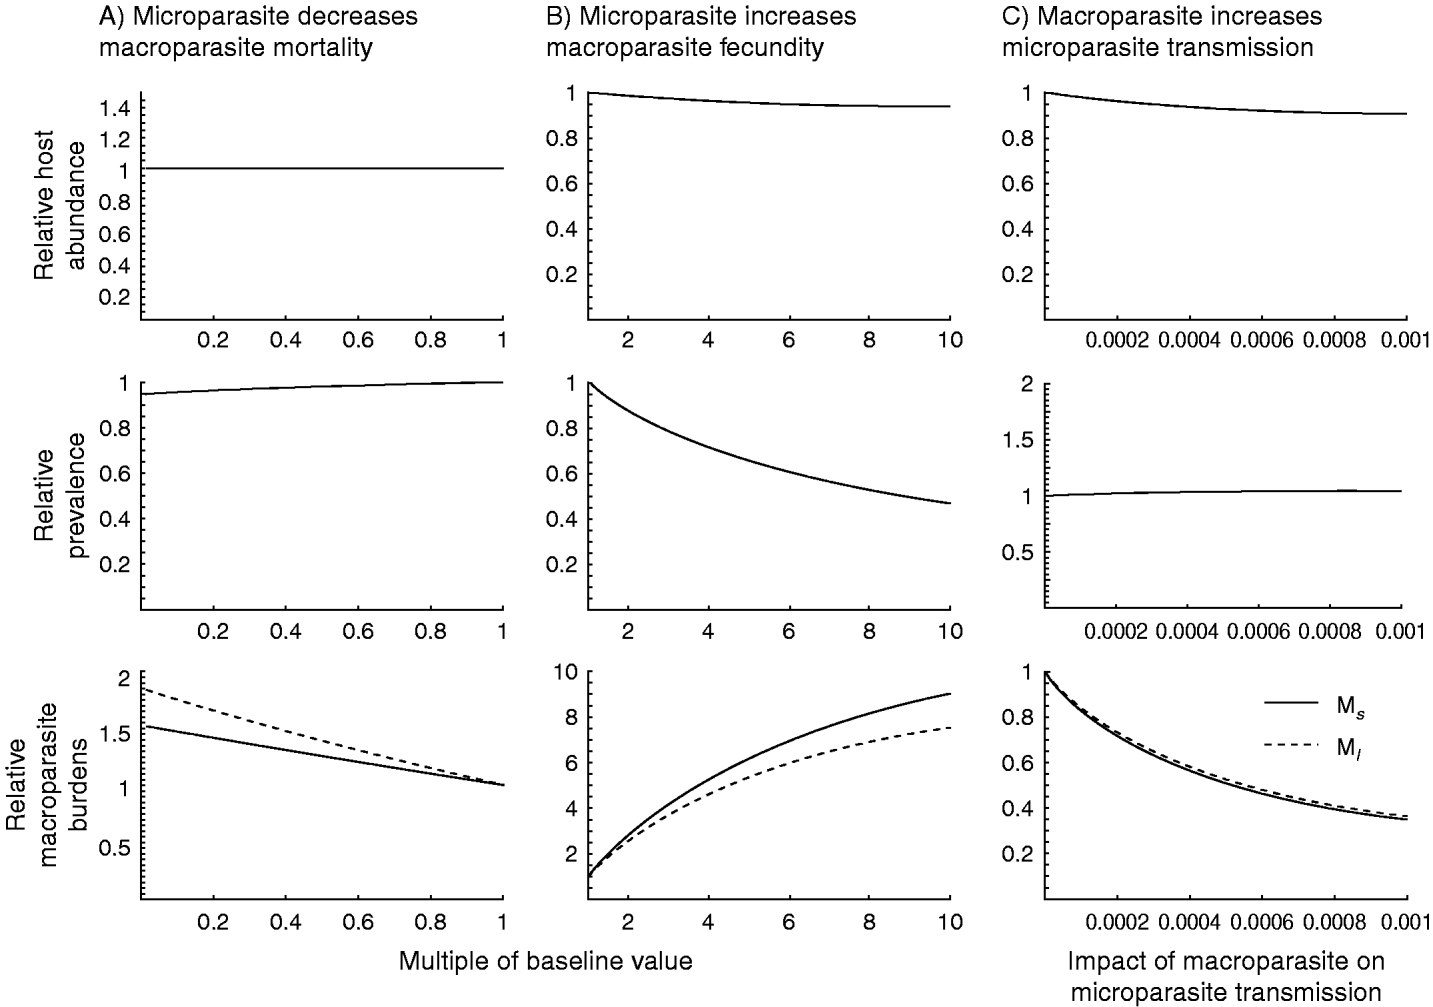
Although these within-host interactions do not have a great impact on stability of the host-macroparasite-microparasite community and invasibility of the component species, their implications for population-level abundance of the component species were explored. In general such within-host interspecific parasite interactions seemed to have relatively little impact on host abundance (top panels, Figs 6A, B, C). However, despite these small changes in host abundance there may be large quantitative differences in microparasite prevalence (middle panels, Figs 6A,B) and mean macroparasite abundances (bottom panels, Figs 6A, B), although interactions affecting macroparasite fecundity have a larger effect than interactions affecting macroparasite survival. However, an interaction in the opposite direction, whereby the presence of a macroparasite facilitates microparasite transmission, has far less impact on microparasite prevalence (middle panel, Fig. 6C), although there may be a considerable reduction in mean macroparasite abundance (bottom panel, Fig. 6C). This is because increased microparasite transmission converts susceptible hosts into infected hosts, which suffer increased mortality due to the combined virulences of the microparasite and macroparasites, particularly those with very high macroparasite burdens, resulting in substantial losses of the macroparasite population. However, this reduction of the macroparasite population feeds back into the model, reducing the magnitude of the within-host interaction, effectively buffering the host population and microparasite prevalence, and maintaining them at relatively constant levels. This suggests that if an empirical study was conducted where microparasite prevalence and host abundance were examined at two locations, one where the impact of the macroparasite on the microparasite was low and one where it was high, it might erroneously be concluded that there was no relationship between macroparasite burden and either host abundance at the population level or microparasite transmissibility at the individual level. This illustrates that non-intuitive patterns of host, microparasite and macroparasite dynamics may arise through co-infection that would otherwise not be recognised without the appropriate modelling framework.
The quantitative impact of within-host parasite interactions on equilibrium host abundance (top panels), microparasite prevalence (middle panels) and mean macroparasite burdens (bottom panels), expressed relative to the values observed in the absence of any interaction, for (A) microparasite decreases macroparasite mortality (μS=μI×θ), (B) microparasite increases macroparasite fecundity (λS=λI×θ), (C) macroparasite increases microparasite transmission (βV′=βV+θM I) where θ is the multiple of the baseline parameter value, as shown on the x-axis. a=a′=0·05 time−1, b=0·02 time−1, αV=0·1 time−1, αW=0·001 time−1, λS=λI=1000 time−1, μS=μI=0·05 time−1, k=0·1, γ=0·5 time−1, βV=0·08 time−1, βW=3×10⁻⁵ time−1.

Consequences of co-infection on species-specific parasite control
Finally, the model was used to evaluate the consequences of parasitic co-infection on the outcome of an administered control programme, targeting each parasite in turn (see Appendix D for details). As a baseline, the situation without co-infection was explored, evaluating the consequences of treating increasing proportions of the host population with either a vaccine to immunise against the microparasite or chemotherapy to increase mortality of the adult macroparasites, recording the equilibrium size of the host population following treatment. The same treatment regime was then repeated, but in the presence of the co-infecting parasite. To illustrate the sensitivity of the predicted outcome of control, these analyses were repeated for two values of macroparasite transmission rate.
As would be expected, in the absence of co-infection, the greater the proportion of the host population treated, the greater the resulting host population size (Fig. 7). Under the parameter values used for these models, in the absence of co-infection vaccination completely eliminated the microparasite when more than 27% of the host population was vaccinated (Fig. 7A). However, chemotherapy to target the macroparasite was less effective than vaccination to control the microparasite; 100% of the population could be treated with a drug with 90% efficacy without completely eliminating the parasite (Fig. 7B). In the presence of co-infection, both control strategies could be successful at eliminating the target parasite at relatively low levels of coverage (denoted by the vertical arrows in Fig. 7), although the coverage required to achieve parasite elimination varied with macroparasite transmission rate; increasing macroparasite transmission rate greatly reduced the level of coverage needed to achieve microparasite elimination (Fig. 7A) but increased the level of coverage needed to achieve macroparasite elimination (Fig. 7B). In addition, for both microparasite and macroparasite control the overall effectiveness of control, evaluated as the magnitude of the host population following control, was reduced; effectively the host population was buffered by the presence of the other parasite species, restricting host population growth following control (solid lines, Fig. 7). Indeed, even once the target parasite had been eliminated the host population was not greatly increased over that achieved in the absence of control.
The impact on equilibrium host abundance (S+I+R) of (A) vaccination targeting the microparasite and (B) chemotherapy targeting the macroparasite, as a function of the proportion of the host population treated in the absence (dashed line) and presence (solid line) of co-infection, for macroparasite transmission rate (βW) of 0·000055 time−1 (left-hand panels) and 0·000085 time−1 (right-hand panels). The white arrows show where treatment resulted in elimination of the target parasite in the absence of co-infection and the black arrows show where treatment resulted in elimination of the target parasite under co-infection. a=a′=0·05 time−1, b=0·02 time−1, αV=0·1 time−1, αW=0·001 time−1, λS=λI=1000 time−1, μS=μI=0·05 time−1, k=0·1, γ=0·5 time−1, βV=0·0005 time−1, σ=0·001 time−1, h=0·8.

DISCUSSION
Our understanding of disease epidemiology and the consequences for host populations have been greatly enhanced by the development of simple, generic population dynamic models (Anderson and May, Reference Anderson and May1978, Reference Anderson and May1981, Reference Anderson and May1992; May and Anderson, Reference May and Anderson1978). These models have provided the necessary framework to allow insight into the key factors affecting disease persistence, and enabling the exploration of “what-if” questions leading to the potential development of more effective, long-term disease control methods. However, despite the recognition that hosts are typically simultaneously infected with a variety of micro- and macroparasite species (Petney and Andrews, Reference Petney and Andrews1998; Cox, Reference Cox2001), there has yet to be developed an appropriate framework for analysing their dynamics. Here such a framework has been presented, showing that ignoring co-infection can lead to radically different predictions from those generated by simple 1-host-1-parasite models.
In particular, this model has shown that the combined density-dependent regulatory forces imposed by both micro- and macroparasites on their host can greatly stabilise the dynamics of the whole host-parasite community, acting as a buffer against erratic fluctuations, thereby resulting in the long-term persistence of all three partners. Indeed, it may be that a rich and diverse community of micro-and macroparasites is actually a sign of a healthy host population; wildlife populations which are dominated by very few parasite species may in fact be more unstable, and possibly more prone to extinction than those able to support a large parasite community.
Furthermore, the model allowed consideration of how a variety of host, microparasite and macroparasite life-history traits may affect parasitic coexistence and community stability. For example, it was shown that long-lived hosts (low b) favour parasite coexistence (Fig. 4B). If this increase in the region of parasite coexistence reflects an ability for the host population to support a greater number of parasite species then, all else being equal, it may be expected to see more rich and diverse communities in host species that are long lived compared to those that are short lived. Similar patterns may be expected within a host species where, for example, populations living in different environments have different survival rates; hosts living in harsh environments may be shorter lived and so may have sparser parasite communities than those living in relatively benign environments. Hence, a rich and diverse parasite community may actually be a positive measure of a population's well-being. However, if either parasite species is too virulent then the likelihood of species coexistence may be drastically reduced (Fig. 4C). Once again, this may suggest that host populations with rich and diverse parasite communities are actually the more healthy ones, because it is not possible to support a large community of highly virulent parasites. Finally, acquired immunity from microparasite infection can allow macroparasites to persist when they would otherwise be excluded by the presence of the microparasite (Fig. 4D). Therefore, perhaps non-intuitively, it may be expected to see particularly rich helminth communities within hosts that are able to mount effective immune responses towards microparasitic infections.
This buffering effect arising from co-infection also has important consequences for the success of imposed disease control programmes. In the absence of co-infection vaccination or chemotherapy can result in substantial increases in host population size by reducing, and ultimately eliminating, the target parasite species. However, in the presence of a co-infecting parasite the host population response to targeted parasite control is much less pronounced, even up to levels of control that eliminated the target parasite. On this basis a more holistic approach would be recommended when designing and evaluating disease control programmes, taking into account the presence and impact of other parasite species on the outcome of control.
The majority of the predictions arising from this model are generated by population-level ecological factors, mediated by the impact of each parasite species on host abundance. When the presence of one parasite is predicted to affect the persistence or abundance of another parasite species, it is because it has acted in some way to enhance or reduce host population abundance. However, our framework also allows consideration of the population-level consequences of more direct, within-host interactions between parasite species. One of the key paradigms to emerge from immunological studies of within-host interactions between microparasites and macroparasites is the Th1-Th2 trade-off (Mosmann and Sad, Reference Mosmann and Sad1996; Romagnani, Reference Romagnani1996; Pritchard et al. Reference Pritchard, Hewitt and Moqbel1997; Stewart et al. Reference Stewart, Boussinesq, Coulson, Elson, Nutman and Bradley1999). Although a simplified representation of the true dynamics of the immune response to co-infection, it was assumed that the presence of one parasite species enhanced the fitness (survival, fecundity or transmissibility) of the other parasite species, by reducing the impact of the host's immune response. These within-host interactions had little qualitative impact on the stability of the host-multiparasite community or the ability of either species to invade and persist in the presence of the other. However, they did have noticeable consequences for the quantitative abundance of the host population and each component parasite species, potentially driving the host population down to low levels. Hence, individual level interactions between parasites may scale up to affect population level patterns and it is important to understand more fully the links between within-host and between-host dynamics if we are to truly develop effective and sustainable disease control strategies.
Overall this work has shown that the epidemiology and population dynamics of host-microparasite-macroparasite communities may be highly complex, resulting in different predictions from those made by the corresponding single parasite species models. Ultimately, the dynamic feedback between host, microparasite and macroparasite mean it is difficult to appreciate the factors affecting parasite persistence and predict the effectiveness of control by just studying one component in isolation. However, the model presented here is a conceptually simple and logical extension of the classic individual species models that have formed the foundation of epidemiological theory over the last 30 years. As such it should provide a valuable framework for understanding the dynamics of parasite co-infection and evaluating the wide-ranging implications of disease control strategies in the future.
ACKNOWLEDGMENTS
The author would like to thank Andrea Graham and Maria-Gloria Basanez for helpful comments on earlier versions of the manuscript.
APPENDIX A: THE MICROPARASITE-MACROPARASITE CO-INFECTION MODEL
Our co-infection model is based on the Susceptible-Infected (SI) microparasite model of Anderson and May (Reference Anderson and May1981) :


and the macroparasite model of May and Anderson (Reference Anderson and May1978) :


where parameters are as defined in Table 1. Combining these models, and keeping track of the individual worm burdens in hosts susceptible to the microparasite (P S) and infected by the microparasite (P I) produces the hybrid model:


This model was then simplified by noting that the dynamics of the external infectious stages of the macroparasite (E) are likely to be relatively fast in comparison to those of the adult parasites, P, and so they are assumed to be at pseudo-equilibrium:

Macroparasite dynamics (P i) may be expressed in terms of the mean burden per host type i (M i=P i/i) according to the relationship:

resulting in the model presented in the main text.
APPENDIX B: ANALYSIS OF THE CO-INFECTION MODEL
Calculating the basic reproduction ratio, R0
The basic reproduction ratio of the microparasite (R 0,V) and macroparasite (R 0,W) may be calculated from the dominant eigenvalue of the transition matrix (Diekmann and Heesterbeek, Reference Diekmann and Heesterbeek2000), which leads to a complex expression. However, a more intuitive expression for R 0 may be obtained heuristically by examining the equations in the model. In the case of the microparasite it can be seen that an infected host (I) lives, on average, for  and produces βVH new infecteds. Therefore the microparasite's basic reproduction ratio in the presence of the macroparasite is:

In the case of the macroparasite, there are three routes by which an individual free-living infective stage (E) in one generation may produce free-living infective stages in the next generation: (1) an E infects an S, resulting in a single P S, which produces new free-living infective stages; (2) an E infects an I, resulting in a single P I, which produces free-living infective stages; (3) an E infects an S, which then becomes infected by the microparasite, transferring the P S to P I, which then produces free-living infective stages. From the equations comprising the co-infection model, these three pathways are given by:


These expressions may then be summed to give the final expression for R 0,WV given in the main text.
Stability analysis of the co-infection model
The model was analysed by adopting an invasibility analysis (Bowers et al. Reference Bowers, Boots and Begon1994; Boots and Bowers, Reference Boots and Bowers1999; Bowers et al. Reference Bowers, Hoyle, White and Boots2005). This involves making the assumption that one of the parasite species (e.g. the macroparasite) is absent from the community, and allowing the other parasite species to become endemic. The stability of the resulting community and the conditions under which it becomes unstable determine when the macroparasite can invade. The roles of the parasites are then reversed and the conditions under which the microparasite can invade in the presence of an endemic macroparasite are determined. When both species can invade in the presence of the other then stable co-infection may occur, which were verified through extensive numerical simulations of the full community model.
To begin, assume the macroparasite is absent (M S=M I=0). In this case, there are two stable states, the trivial equilibrium (0, 0) and (S*, I*) where:

The Jacobian matrix of the full community, evaluated when M S=M I=0 is:

where the Ωs are the eigenvalues of the system. This matrix is of the form:

where the J i are 2×2 sub-matrices. J 1 is the sub-matrix defining stability of the microparasite endemic with the host in the absence of the macroparasite (Anderson and May, Reference Anderson and May1981). Since the microparasite is assumed to be endemic, the criteria for stability of this matrix are assumed to be fulfilled. Specifically, this requires d>a; if the reverse is true, host birth rate exceeds net death rate and the host population escapes regulation and increases exponentially (Anderson and May, Reference Anderson and May1981). Since J 3 is a 2×2 matrix comprising entirely of zeros, stability of J, and hence the ability of the endemic microparasite to resist invasion by the macroparasite, depends solely on the stability of J 4; if J 4 evaluated at the equilibrium (S*, I*) is unstable then the macroparasite can invade when the microparasite is endemic. To determine the stability of J 4 its determinant evaluated at (S*, I*) is calculated and the characteristic equation derived of the form:

where A and B are coefficients determining the stability of J 4. According to the Routh-Hurwitz criteria, in order for J 4 to be stable, and resist invasion by the macroparasite, both A and B>0. Hence, parameter values that make either of these coefficients ⩽0 define regions of parameter space where the macroparasite can invade. Although these conditions can be obtained algebraically they are too complex to provide any general insights, so these were simply evaluated numerically to generate the boundary line between the “Microparasite alone” and “Parasite coexistence” regions in the figures. Reversing the roles of the macroparasite and microparasite (i.e., setting I=0) and following the same procedure as above provides an expression for the second boundary line separating the regions “Macroparasite alone” and “Parasite coexistence” in the figures. In all cases the results obtained are verified by extensive numerical simulations of the full community model.
APPENDIX C: INCORPORATING RECOVERY FROM MICROPARASITE INFECTION
The standard SI microparasite model is often considered too unrealistic, especially for vertebrate hosts, since it assumes that once hosts are infected they remain so until they die. However, frequently microparasite infections are acute, being rapidly cleared and resulting in the host acquiring life-long immunity to that parasite. Therefore the SI model may be extended to incorporate a Recovered/Immune class, R, forming an SIR model:


where σ is the rate of recovery and acquisition of life-long immunity to infection. Incorporating such a recovery class into the full co-infection model gives:


where P R is the parasite burden within recovered hosts. Expressing this model in terms of mean worm burdens produces the final SIR co-infection model:


where Γ R=μS+αW.
APPENDIX D: INCORPORATING MICROPARASITE AND MACROPARASITE CONTROL PROGRAMMES
Two control strategies were considered: vaccination targeting the microparasite and chemotherapy targeting the macroparasite.
Vaccination
Following Anderson and May (Reference Anderson and May1992) a proportion p of the host population is assumed to be vaccinated at birth, moving them immediately into the Recovered/Immune class and therefore immune for life from infection by the microparasite. This results in the following co-infection model:


It can easily be shown that in the absence of co-infection a critical proportion, p*, of the host population needs to be vaccinated in order to eliminate the microparasite, where:

Chemotherapy
Following Anderson (Reference Anderson1980) and Anderson and May (Reference Anderson and May1992) it was assumed that a chemotherapeutic drug is administered to control the macroparasite, such that the drug increases the macroparasite's per capita mortality rate by an additional factor c per unit time. Specifically, a proportion g of the host population is assumed to be treated at random, irrespective of their infection status and the drug has efficacy h (the proportion of the worm burden killed following a single treatment). Anderson (Reference Anderson1980) and Anderson and May (Reference Anderson and May1992) showed that under these conditions the increase in per capita macroparasite mortality rate attributable to the drug is:

Therefore the term “−c Mi” is added to each equation describing the dynamics of mean worm burden (dM i/dt) over time.