Introduction
Building up forested watersheds through strategic land-use plans is a cost-effective and sustainable management practice that can naturally augment freshwater provision and soil health through increased vegetation cover in watersheds (Shannon et al. Reference Shannon, Swanston, Janowiak, Handler, Schmitt and Brandt2019). Forest-based land management within a watershed substantially impacts hydrological processes in both upland and riparian areas through tree-canopy interception and infiltration of water (Chemura et al. Reference Chemura, Rwasoka, Mutanga, Dube and Mushore2020, Lucas-Borja et al. Reference Lucas-Borja, Carrà, Nunes, Bernard-Jannin, Zema and Zimbone2020, Suprayogo et al. Reference Suprayogo, van Noordwijk, Hairiah, Meilasari, Rabbani, Ishaq and Widianto2020). The water retention service provided by a forested watershed interacts with climatic conditions, vegetation compositions, soils, microbes and other ecosystem components (Krishnan et al. Reference Krishnan, Radhakrishnan and Ramalingam2024). The health of the riparian ecosystem shapes water quality and quantity, providing several vital nature-based services (Daily Reference Daily1997). Although trees utilize water for transpiration and evaporation and their root systems can reduce subsurface runoff (Hamilton Reference Hamilton2008), a moderately dense tree cover can promote groundwater recharge, especially during dry spells (Ilstedt et al. Reference Ilstedt, Tobella, Bazié, Bayala, Verbeeten and Nyberg2016). Watershed vegetation also plays a vital role in water purification, functioning as a natural filter by retaining and degrading pollutants before they reach streams. This purification is further enhanced by watershed soils, which trap additional pollutants, and by wetlands, which slow the flow of substances, facilitating plant uptake (Mei et al. Reference Mei, Kong, Ke and Yang2017). Watershed management should therefore be considered a set of strategic practices for developing healthy watersheds through the promotion of upstream land-use change and the fostering of stakeholder recognition of the value of diverse ecosystem services (Perry & Thompson Reference Perry and Thompson2019).
An integrated approach that encompasses ecological, sociocultural and economic systems is essential for promoting holistic discourse on conservation and development issues collectively to ensure smooth functioning of ecosystem processes through pro-watershed land management (Hummel et al. Reference Hummel, Jahn and Keil2017). Such integration requires assessment of the ability of ecosystems to provide goods and services for fulfilling societal needs and valuation of those benefits to judge the potential of ecologically effective, economically efficient and socially equitable means of development. Forested watersheds typically provide a multitude of benefits to local ecology and society, including affirmative impacts on freshwater availability and benefits to native communities through the provision of diverse tangible and intangible ecosystem services.
Ecosystem services are viewed as tangible and intangible commodities provided by nature through its biodiverse ecological processes to society (Costanza et al. Reference Costanza, d’Arge, de Groot, Farber, Grasso and Hannon1997, Daily Reference Daily1997, MEA 2005). These services comprise intermediary as well as direct benefits to people for both consumptive and productive purposes, the steady flow of which is fundamental to any economy for achieving sustained growth. Drawing on a key premise of ecological economics, this study is grounded in the principle that nature is the ultimate source of raw materials. This perspective – a central element in both the Marshallian proposition and the neoclassical economic ‘limits to growth’ debate – views the economy as a transformative agent that rearranges these resources through production to fulfil human wants (Daly & Farley Reference Daly and Farley2011, Daly Reference Daly2015). Thus, any supply shortfall of natural resources impedes the growth of an economy. Despite that, the management of natural resources often encounters a ‘tragedy of the commons’ stemming from the lack or absence of well-defined property rights within market mechanisms (Hardin Reference Hardin1968, Hanley Reference Hanley2007). To integrate ecosystem services into a market mechanism, it is essential to assign quantitative values to them. The natural capital estimation framework is widely used for identifying quantifiable ecosystem benefits and assigning value to them. It facilitates the integration of ecosystem management with economic decision-making and development (Voora & Venema Reference Voora and Venema2008).
Valuing ecosystem services requires diverse methodological syntheses. Even for apparently simple aspects such as crop revenue, methodological challenges remain, particularly in addressing issues of price, quantity and cost elements. A ‘mixed-methods’ approach integrating survey data and spatial modelling often proves effective (Lin et al. Reference Lin, Huang, Zheng, Chen, Wang, Wang and Qui2024). Two primary frameworks can be considered for the assessment of the identified ecosystem services in watersheds: a standard market-based approach for tangible benefits from farmland and forestland; and a biophysical approach for quantifying indirect benefits. Integrated Valuation of Ecosystem Services and Tradeoffs (InVEST) for biophysical modelling facilitates a comprehensive evaluation of intangible services through a production function approach. It models spatial data to offer ecosystem service-specific outputs based on inherent characteristics and processes, reflecting the benefits people derive (NatCap 2022). This helps us to obtain a greater understanding of the relationships between land-use patterns and ecosystem functioning by connecting biophysical aspects to societal perspectives, considering that supply (ecology) provides services (beneficiaries), which have values (benefits). InVEST models have seen growing use worldwide (Mukhopadhyay et al. Reference Mukhopadhyay, Hati, Acharyya, Pal, Tuladhar and Habel2025), and several such models have been used to assess ecosystem services, focusing on both tropical watersheds and dominant agricultural land uses (Jiang et al. Reference Jiang, Wang, Zuo and Du2023, Ekanayaka et al. Reference HBGDMP, Abeysingha, Amarasekara, Ray and Samarathunga2025).
Valuation of ecosystem services provides an additional economic rationale for the successful planning and management of environmental resources (Nadal Reference Nadal2016). Policymakers aiming to promote forested watersheds through land-use changes in watershed areas need to recognize the multifaceted co-benefits of ecosystem services, encompassing both productive and environmental conservation aspects. We sought to quantitatively assess ecosystem services under potential land management scenarios and to contribute to the development of a healthy and sustainable watershed around a newly constructed barrage in Rajasthan, a water-scarce province of India. The land-use change scenarios were: a highly desirable case for conservation, where entire croplands are converted into agroforestry; a moderately desirable case for conservation, where some cropland is allocated to agroforestry, with the remainder coming under organic cultivation (willingness to change observed through field survey); and a barely desirable case for conservation, where organic farming is arranged across croplands to minimize inorganic chemical runoff from non-organic conventional agriculture. We hypothesized that: (1) improving ecosystem services in the watershed primarily requires targeted land management interventions in predominant croplands, and that bare/sparse marginal land, with minimal scrubland/grassland cover, thereby offers an opportunity for leveraging environmental functions by planting pro-watershed tree species; and (2) shifting towards agroforestry or organic farming in watershed areas may diminish farmland revenue and water yield, yet these potential consequences could be offset by improved water filtration, sediment control, nutrient retention and carbon storage.
Materials and methods
Study area
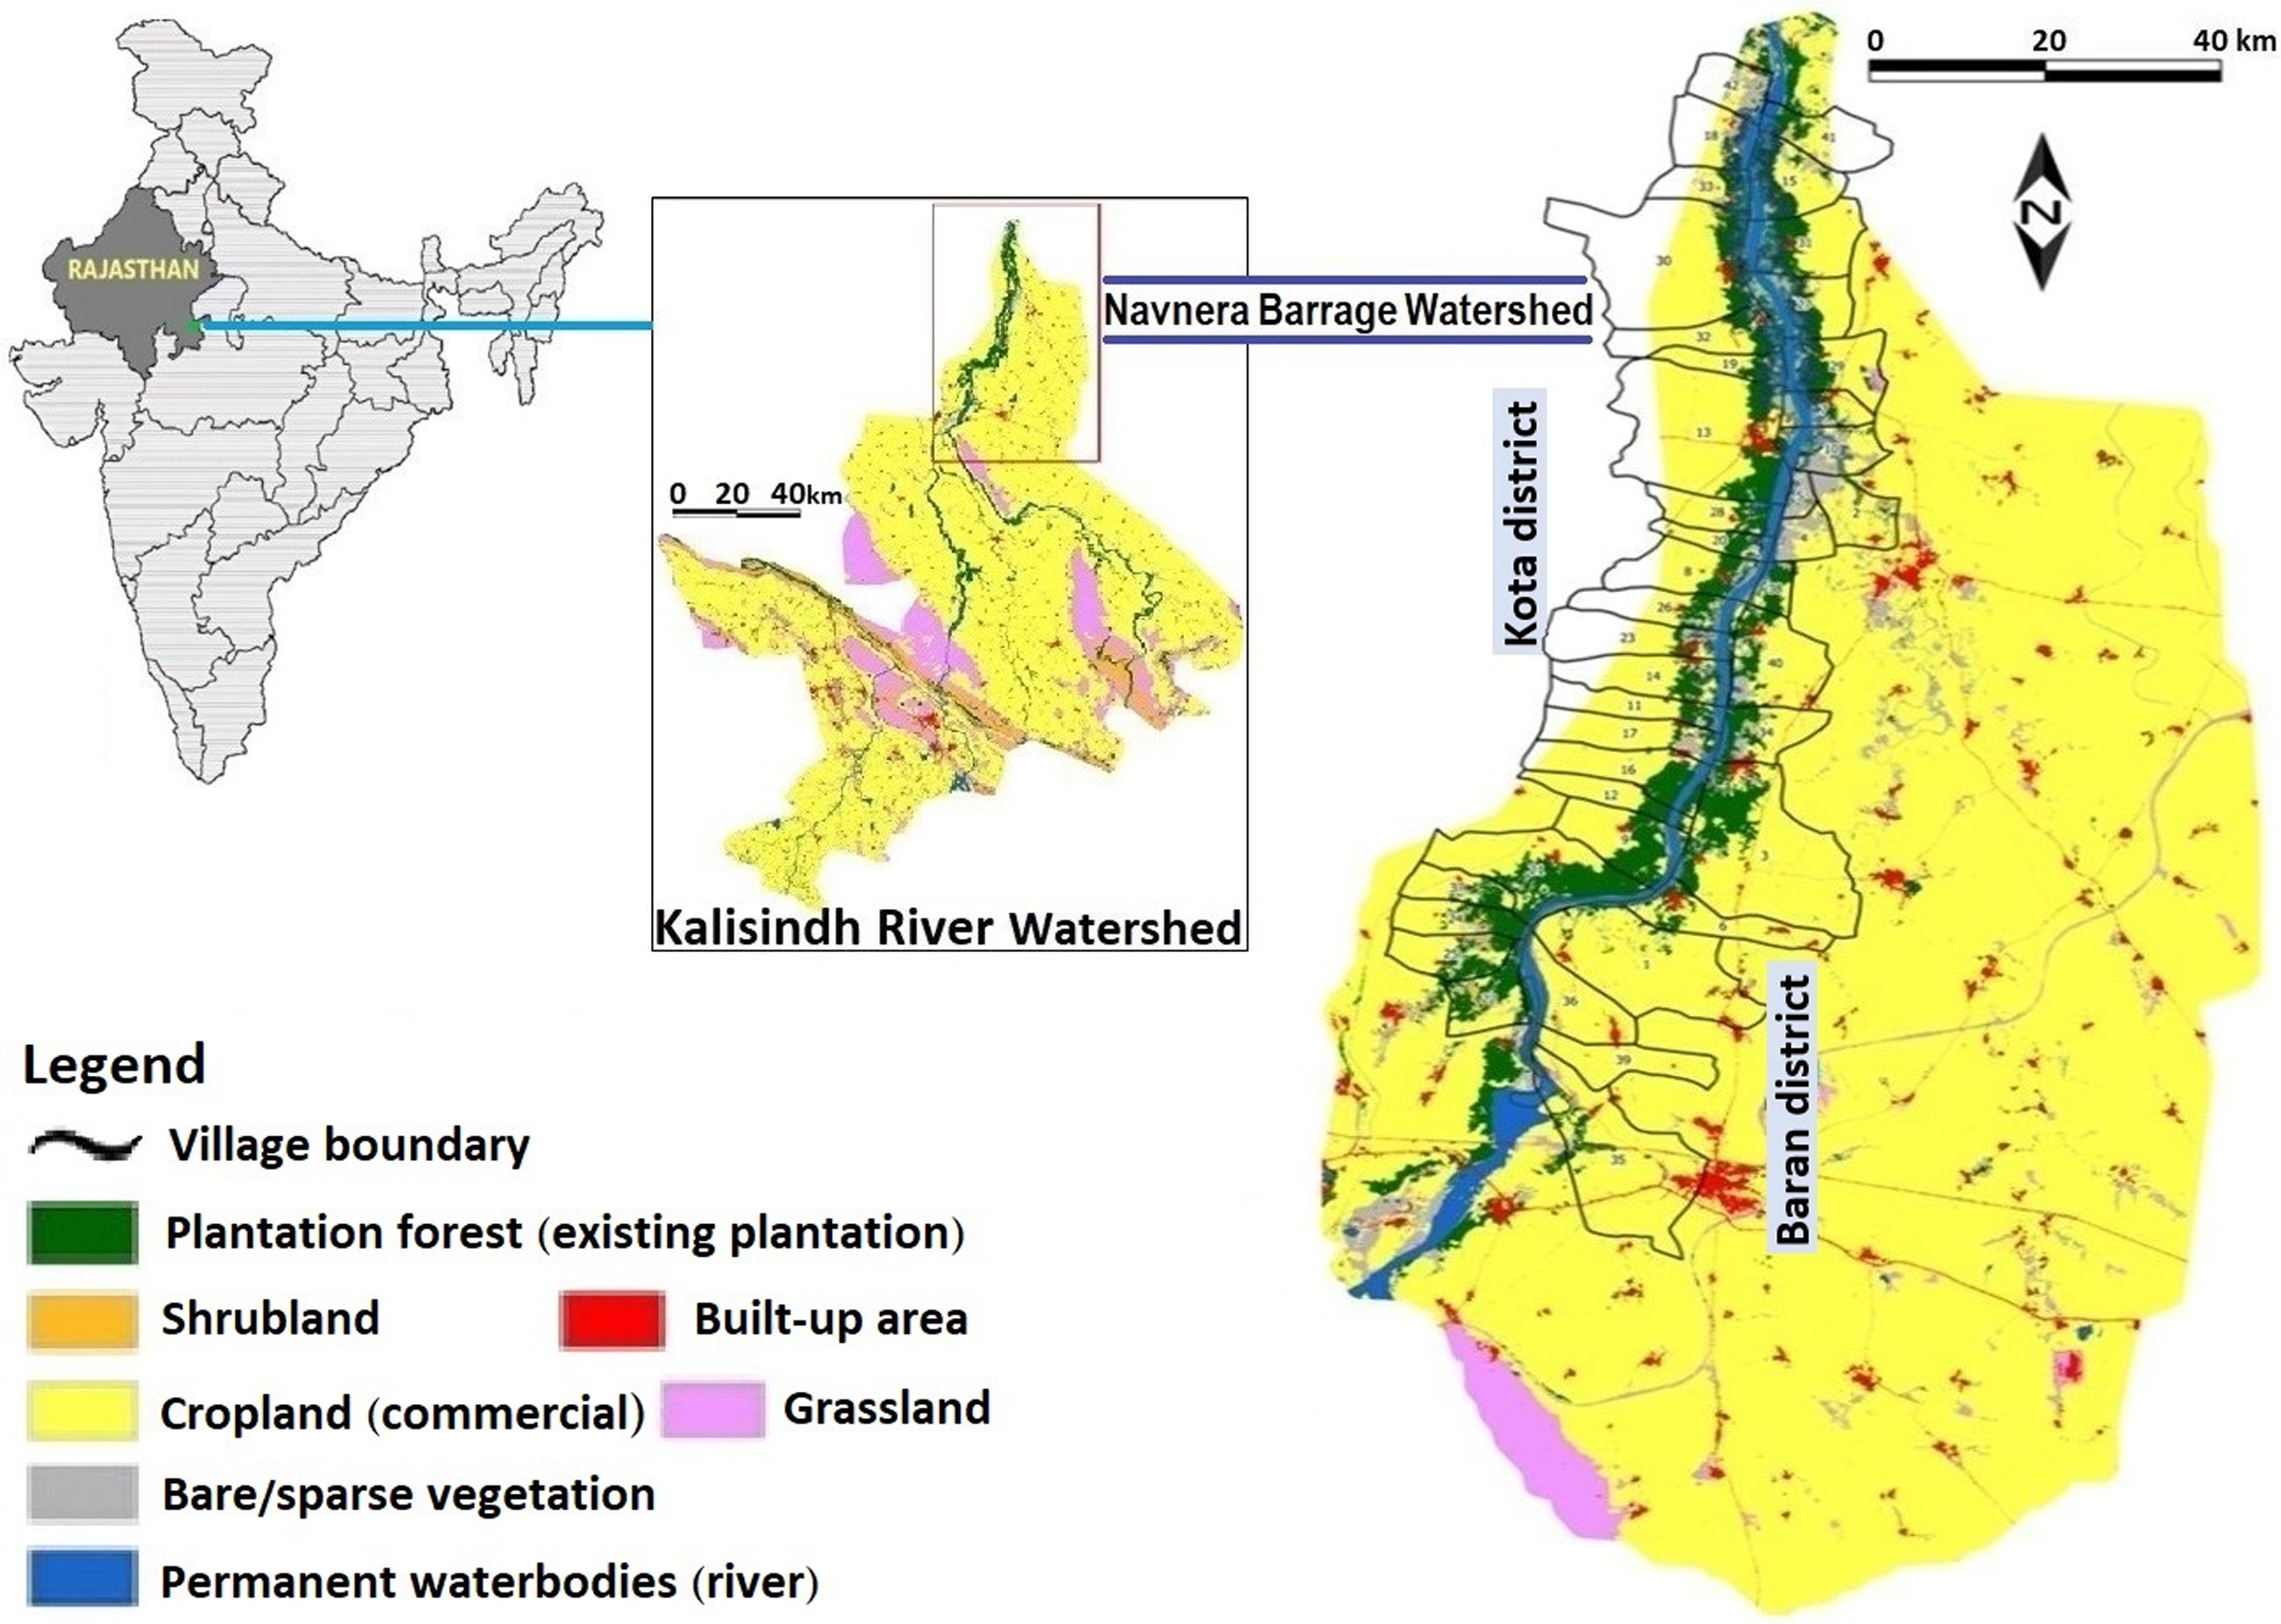
Rajasthan encompasses diverse ecosystems, including deserts, hills, plains and plateau ravine landscapes. The present study area is characterized by a semi-arid to sub-humid climate with elevations ranging from 193 to 433 m. It experiences hot summers and mild winters, with average annual rainfall of 700 mm/year during the monsoon. The vegetation is classified as mixed dry deciduous forest, dominated by Prosopis juliflora, an invasive species. Due to acute water shortages in most areas, a state-funded intra-basin interlinkage scheme – the Eastern Rajasthan Canal Project – has recently been launched (NWDA 2023). As a flow regulation structure with a controlled reservoir across the waterway, construction of the Navnera barrage on the Kalisindh river near Kota is underway to augment freshwater availability for domestic and industrial needs in multiple districts; the watershed management plan prioritizes alignment with natural processes (CPR 2021). The core area encompasses 5666 km2, spanning 42 rural villages in the Kota and Baran districts on the banks of the Kalisindh (Fig. 1). The boundaries of this watershed were officially demarcated using standard hydrological principles involving a digital elevation model (Fig. 1). Inhabitants of the watershed primarily rely on agriculture, engaging in traditional land management practices (see land-use and land-cover details in Fig. S1). Commercial agriculture covers 72% of the area and grassland covers 13% of the area, while plantation forests, bare/sparse vegetation and scrubland each occupy only 4% of the area; built-up areas and permanent water bodies are minimal and herbaceous wetlands are negligible. While the newly constructed barrage and its submergence zone, which extends across lands belonging to watershed residents, are prominent features, some residents have cited perceived inequities regarding the compensation received for their acquired land.
Map of the study watershed area with village boundaries shown.

Watershed ecosystem services
The ecosystem services relevant to land-use planning of upstream villagers were identified and assessed in alignment with the framework in the Millennium Ecosystem Assessment (MEA 2005) and The Economics of Ecosystems and Biodiversity (TEEB Reference Sukhdev, Wittmer, Schröter-Schlaack, Nesshöver, Bishop and ten Brink2010). Given that the perceived value of these services can vary among stakeholders and that their economic valuation has limitations due to overlapping benefits, we focused on identifying and categorizing existing benefits rather than attempting a full economic valuation. The vegetation and topography of the watershed were evaluated for their influence on key ecological functions such as precipitation capture, storage and release, which are vital for water quantity and quality regulation. The identified services were then categorized into tangible (direct provisions to the community, including farmland revenue, employment opportunities and fuelwood and fodder availability from forestland in watershed) and intangible benefits crucial for ecological functioning (soil nutrient deposition, sediment control, water quantity and quality regulation and carbon storage/sequestration). Benefits from timber and recreation were not included as they are not currently realized within the watershed.
Field data collection
The official ‘catchment area treatment plan’ provided foundational technical insights for the site, including key information on the watershed and its proposed management (CPR 2021), and this was supplemented by socioeconomic data collected through participatory rural appraisal involving focus group discussions to collect community-level information from nearly half of the watershed villages. Subsequently, eight villages were selected by stratified sampling, based on the three criteria of proportional representation of districts, village proximity to river and varying perceptions on land acquisition for submergence, for in-depth household surveys encompassing both districts using structured questionnaires (Appendix S1) to collect socioeconomic data from 444 households (91 landless, 353 landholders). Although drawn to ensure a 95% confidence level with a 5% margin of error, the actual sample size of the watershed villages was somewhat larger due to the implementation of stratum-specific proportional representation.
Assessment framework of intangible services in the watershed
Water yield assessment
We assessed runoff for each pixel in the watershed using the InVEST water yield model that employs the Budyko hypothesis to calculate the difference between precipitation and evapotranspiration, providing a spatial quantification of how vegetation and topography regulate water provision to the reservoir (NatCap 2022). It estimated total water yield reaching the reservoir, considering surface, subsurface and base flows according to Equation 1:
 $$Y\left( x \right) = \left( {1 - {{AET\left( x \right)} \over {P\left( x \right)}}} \right) \times P\left( x \right)$$
where
 $Y\left( x \right)$
represents pixel-wise water yield,
 $AET\left( x \right)$
is evapotranspiration and
 $P\left( x \right)$
is precipitation of the reference year. We analytically modelled evapotranspiration as part of the water balance using the Budyko curve, relating potential to actual evapotranspiration, with the fitting parameter ω calibrated on watershed-specific climatic and soil characteristics (Donohue et al. Reference Donohue2012).
We thus estimated the water balance reaching the watershed outlet by deducting evapotranspiration loss from precipitation in each grid unit, representing the combined total of surface water yield, soil moisture content and canopy and litter interceptions. This estimate is sensitive to tree species composition and soil characteristics within the watershed, as increased forest cover, particularly with deep-rooted or high-transpiration species, can lead to a decrease in water yield (Trabucco et al. Reference Trabucco, Zomer, Bossio, van-Straaten and Verchot2008, Liang et al. Reference Liang, Bai, Wang, Fu, Yan and Wang2015, Filoso et al. Reference Filoso and Bezerra2017). The economic value of the water regulatory service was calculated by multiplying the estimated net water yield with the prevailing official water price of 1.059 rupees/m3.
Nutrient delivery assessment
We quantified nutrient export from each landscape pixel, considering both surface and subsurface flow paths, using a mass-balance approach under the InVEST nutrient delivery ratio model, a spatially explicit biophysical approach that maps delivery to streams within the watershed (NatCap 2022). We focused on existing diffuse/non-point sources such as chemical and fertilizer uses in agriculture and residential effluent (in the absence of any prominent point source pollution from industrial or water treatment discharge). We estimated N and P export from three potential land management scenarios, including current practices and alternative options with increased vegetation cover and organic farming by incorporating land-use maps and loading rates.
A surrogate pricing approach was employed using the replacement cost of the free-water-surface constructed wetland (FWS-CW), following Notte et al. (Reference Notte, Maes, Dalmazzone, Crossman, Grizzetti and Bidoglio2017), as a proxy of the value of the water purification service in the watershed. This was calculated based on the monetary outlays outlined in the watershed area treatment plan of the barrage submerged area. The monetary value v per hectare per year was estimated according to Equation 2:
 $$\;v = {R^c} \times FW{S_p} \times d$$
where
 $FW{S_p}$
is the cost of the FWS-CW/hectare and
 $d$
is the diffuse input coefficient (set as 1 because the primary source of pollution was diffuse agricultural runoff and the point source removal through horizontal subsurface flow in the constructed wetland was negligible) following Notte et al. (Reference Notte, Liquete, Grizzetti, Maes, Egoh and Paracchini2015). Notte et al. (Reference Notte, Maes, Grizzetti, Bouraoui and Zulian2012), however, proposed a normalized pollutant retention capacity (R
C
) for the FWS-CW according to Equation 3:
 $${R^c} = R_o^c\left( {1 - 0.0019\left[ {{I \over {2.1864}}} \right]} \right)$$
where
 $R_o^c$
is the fractional pollutant retention and
 $I$
is the pollutant input to the FWS-CW. Indian experimental data on the FWS-CW indicate a 63.48% pollutant retention rate (Nandakumar et al. Reference Nandakumar, Pipil, Ray and Haritash2019). Annual pollutant reduction by the FWS-CW was then estimated using Vymazal (Reference Vymazal2007) to be 22 191.67 kg/ha. The annual establishment cost of the
 $FW{S_{p\;}}$
was calculated by incorporating engineering costs, land acquisition value and operation-cum-maintenance costs outlined in the watershed plan (CPR 2021) according to Equation 4:
 $${\rm{AEC}} = {{{\rm{TEC}}\; \times \;{\rm{I}}\; \times {{\left( {1 + i} \right)}^t}} \over {{{\left( {1 + i} \right)}^{t - 1}}}}$$
where TEC is the total establishment cost, i is the discount rate (considered as 3%) and t is the life expectancy of the FWS-CW (20 years; Notte et al. Reference Notte, Maes, Dalmazzone, Crossman, Grizzetti and Bidoglio2017).
Sediment delivery assessment
We used the InVEST sediment delivery ratio model to simulate overland sediment generation and transport incorporating the Revised Universal Soil Loss Equation (NatCap 2022). We also used a connectivity index following Borselli et al. (Reference Borselli, Cassi and Torri2008). By simulating these processes under different land-use scenarios, we identified areas prone to high sediment delivery, which could then inform strategies for sustainable land management to minimize siltation (see further details in Appendix S2).
Sediment delivery assessment enabled quantification of the key ecosystem services of erosion prevention and soil nutrient retention. By analysing land-use patterns, we estimated how watershed vegetation prevented sediment export into the stream by holding soils in root systems, thereby retaining soil N, P and K (Vigiak et al. Reference Vigiak, Borselli, Newham, McInnes and Roberts2012). The value of sediment prevention was estimated as the cost of sediment removal based on the Dredging Corporation of India (IIFM Reference Verma, Zuhail, Panda, Edgaonkar, Anand and Tiwari2019) and adjusted for inflation in reference financial year 2021–2022 to 292.52 rupees/tonne of sediment. The value of soil nutrient retention was estimated based on the market price of NPK fertilizers (467 rupees/50 kg) and national-level estimated sediment contents (GIST Reference Kumar, Sanyal, Sinha and Sukhdev2006) of 2.32 g N/kg, 0.044 g P/kg and 8.25 g K/kg of sediment deposit.
Carbon storage assessment
We employed the InVEST carbon storage and sequestration model – a spatially explicit biophysical approach that calculates carbon stock potential based on land use and land cover (LULC) – to assess the carbon stock potential of terrestrial ecosystems within the watershed. We considered four carbon pools: aboveground biomass (AGB), belowground biomass (BGB), dead organic matter (DOM) and soil organic carbon (SOC) following national (ISFR 2017) and international (NatCap 2022) frameworks. In gridded raster maps to calculate carbon density for each pool across different land-use types, for each cell the total carbon storage was determined as the weighted sum of the area A and carbon store C of its four pools for each land-use type (
 $i$
), calculated according to Equation 5:
 $${C_T} = \sum {A_i} \times {C_i}$$
where
 ${C_i} = C_i^{AGB} + C_i^{BGB} + C_i^{DOM} + C_i^{SOM}$
. We compared carbon storage under current and prospective land-use scenarios and average annual sequestration estimated by the weighted mean annual increment of vegetation for potential land management types. The value of carbon in the barrage watershed was then determined using a reference price of 1090.66 rupees/tonne for 2021–2022, derived from the inflation-adjusted social cost of carbon for 2015 of Nordhaus (Reference Nordhaus2017) and officially adopted in India (Department of Economic Affairs 2017).
Geospatial data for watershed modelling
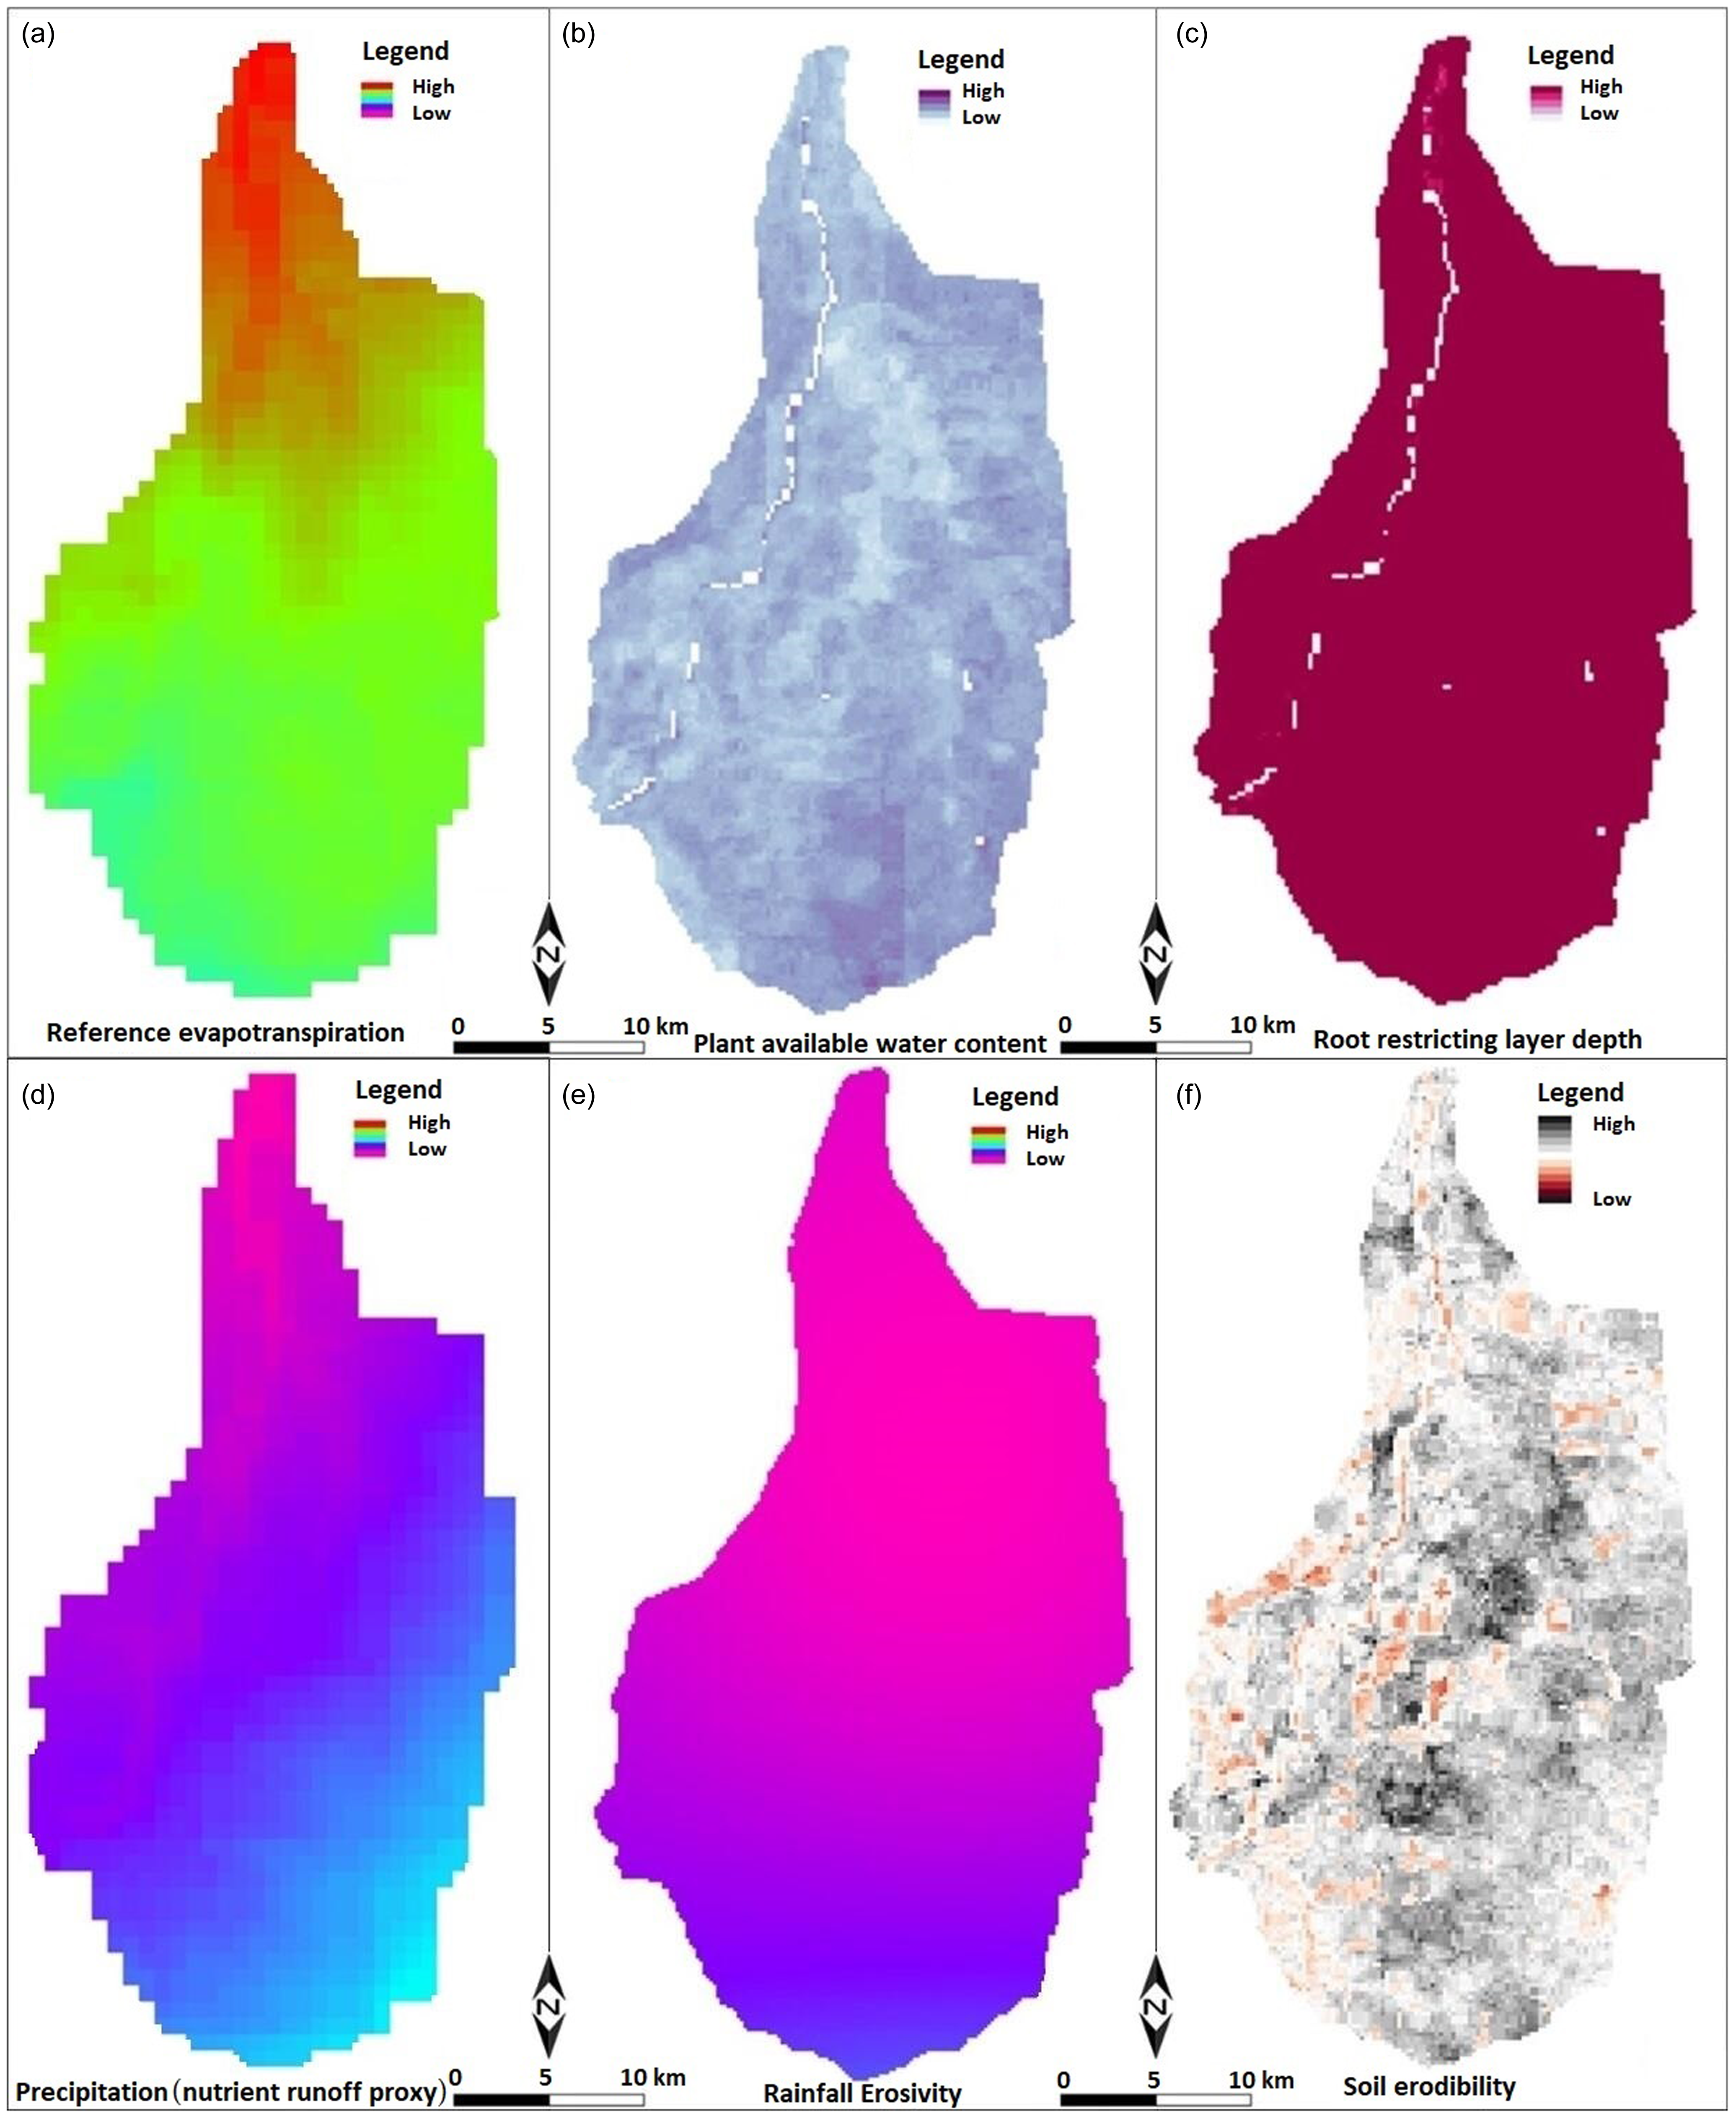
InVEST models were run on various geospatial datasets to simulate ecosystem services within the study area (NatCap 2022). Delineation of the watershed boundary involved geo-referencing officially available base maps for the watershed and submerged areas (Fig. 1). Land-cover data were sourced from the WorldCover project of the European Space Agency that offers the most recent 10-m resolution product, with 8 of its 11 classes observed in the watershed (Fig. S1). Climate data, including reference evapotranspiration estimated using a modified Hargreaves equation (Droogers & Allen Reference Droogers and Allen2002), were sourced from WorldClim (2020). Radiation data for the closest latitude were obtained from the Indian National Solar Radiation Database. Plant available water content was derived from standard soil maps (following Zhou et al. Reference Zhou, Liu, Pan and Feng2005), with parameters obtained from the International Soil Reference and Information Centre (ISRIC). Root restricting-layer depth data were acquired from the Soil and Terrain Project of the ISRIC. An elevation model from the National Remote Sensing Centre of the Indian Space Research Organisation (ISRO) was used (see the digital elevation model in Fig. S2). Average annual precipitation data were used to generate a runoff capacity map in the watershed (see the precipitation map in Fig. S2). Soil erosion data included rainfall erosivity derived from a country-specific equation (Srinivasan et al. Reference Srinivasan, Karthika, Suputhra, Chandrakala and Hegde2021, Raj et al. Reference Raj, Saharia, Chakma and Rafieinasa2022), and soil erodibility was calculated using spatial data from the ISRIC in the RStudio platform. Figure 2 depicts various raster maps generated as model inputs into InVEST.
InVEST raster maps of the study area generated using the following as key inputs: (a) reference evapotranspiration; (b) plant available water content; (c) root restricting-layer depth; (d) nutrient runoff proxy; (e) rainfall erosivity; and (f) soil erodibility.

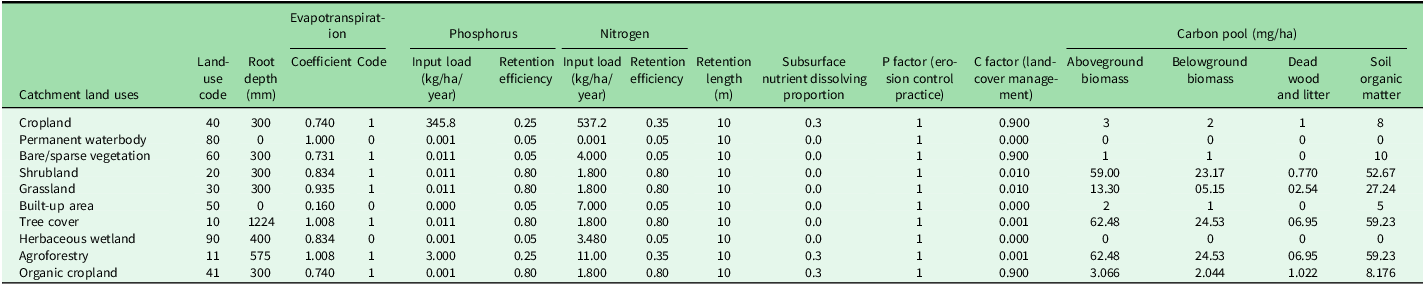
LULC data covering unique land-use codes and model-specific biophysical coefficients were essential; coefficients for aspects such as the water yield model (root depth and evapotranspiration), nutrient delivery model (P and N coefficients) and sediment yield model (C-factor and P-factor) are portrayed in Table 1 (see also Appendix S2), which also incorporates biophysical coefficients for carbon density – a key input of the carbon model. Assessments from several sources were considered to rationalize the carbon density of various pools in the study site (Babbar et al. Reference Babbar, Areendran, Sahana, Sarma, Raj and Sivadas2021). Data from the Intergovernmental Panel on Climate Change (IPCC Reference Eggleston, Buendia, Miwa, Ngara and Tanabe2006) and the India State of Forest Report (ISFR 2017) were incorporated to ensure robust carbon density values.
InVEST biophysical table of coefficients for estimating various ecosystem service models in the barrage catchment area.

Assessment framework of tangible services in the watershed
Agrarian revenue was estimated using a simplified net accounting framework (farmland output multiplied by market price minus explicit costs) to prioritize understanding of farmers’ perspectives on land-use change, acknowledging the limitations of this truly reflecting net revenue as defined in Sarker and Das (Reference Sarker and Das2008). The chosen framework aligns with the decision-making processes of rural households, who often disregard implicit costs such as that of their own labour in their household production function (Das & Sarker Reference Das and Sarker2009). Hired farm labour directly contributed to watershed-related employment opportunities, primarily benefitting landless labourers and smallholders, and this was calculated according to Equation 6:

This study assessed the tangible economic benefits that villagers derive from watershed forests, focusing on fodder and fuelwood, identified through field survey and community consultation. Fodder, primarily P. juliflora used by goat owners (predominantly landless and smallholders), was valued using a surrogate pricing approach based on the daily feeding cost of 10 rupees/goat (Singh Reference Singh2020). Fuelwood, which is essential for cooking, was partially sourced from these forests, fulfilling half of household needs as revealed by the field surveys. The revealed preference approach, using the daily cost equivalent of a liquefied petroleum gas cylinder (typically lasting 1.5 months for an average household) set at 24.4 rupees, estimated the economic value of this forest-derived fuelwood.
Results
Less than 40% of households fell below the poverty line, and the literacy rate was c. 60%. Land ownership was dominated by smallholdings, averaging almost 2 ha in area; only 3% of households relied primarily on non-agricultural income. Approximately 30% of the population were working as rural labourers, including marginal farmers and landless families (20% lacked arable land). Field observations revealed that many landowners perceived intensive agriculture involving chemical use as a potential threat to freshwater supplies from the barrage. While familiarity with agroforestry was limited among watershed villagers, some practised organic farming, reporting perceived yield reductions compared to intensive agriculture. Community perceptions showed that, despite the population being aware of the benefits of organic cultivation, its adoption was hindered by a lack of infrastructure and technical knowledge. These preferences informed the design of three distinct land-use scenarios, which were then used as inputs into the InVEST model.
Cropland employment and forestland benefits
The croplands in the area generated c. 643 million rupees during 2021–2022; this reflects the economic output from agriculture and includes 106 million rupees from lands later acquired by the government for submergence due to barrage construction and subsequent flooding.
Inhabitants were engaged in a range of labour activities involving government employment schemes and farm/casual labour. However, only hired farm labour explicitly generated employment benefits at an estimated 11 million rupees/year in the watershed, which represents 2.4% of the total labour income.
Fodder benefits from forestland were quantified only for goat owners because benefits for other cattle, which primarily utilized crop residues, were excluded to avoid double-counting within the household production framework. Goat ownership divided between landholders (61%) and landless households (85%) estimated the annual forest fodder value at 2.4 million rupees. The surrogate pricing approach based on a liquefied petroleum gas cylinder estimated the fuelwood value at 42 million rupees/year.
Water flow and purification benefits
The water yield model outputs for the existing land use and three potential land-use change interventions (see Fig. S3 for raster outputs in InVEST), along with the economic valuation (Table 2), show that the water yield was greatest under the existing land-use scenario and gradually declined with increasing tree cover. This decline in water yield was influenced by factors such as vegetation types and hydrological processes under potentially increasing tree cover conditions in the watershed, with deep-rooted or high-transpiration species and increased interception and evapotranspiration leading to reduced water availability.
Estimates of water quantity and quality with economic assessment of land-use changes in the barrage catchment.

FWS-CW = free-water-surface constructed wetland.
Current land-use practices maximized P and N export to the stream (Fig. S4). Nutrient export through the barrage watershed indicated a gradual reduction in nutrient loads with the implementation of land-use changes towards more desirable scenarios (Table 2). The annual value addition through land-use changes in the watershed ranged from 18.4 million rupees to almost 18.8 million rupees (Table 2). This marginal difference suggests minimal variation in value between the scenarios involving desirable tree cover and organic farming practices. Nevertheless, the results demonstrated that replacing conventional practices with agroforestry and organic farming leads to a significant reduction in N and P inputs to soils.
Nutrient retention and sedimentation regulation benefits
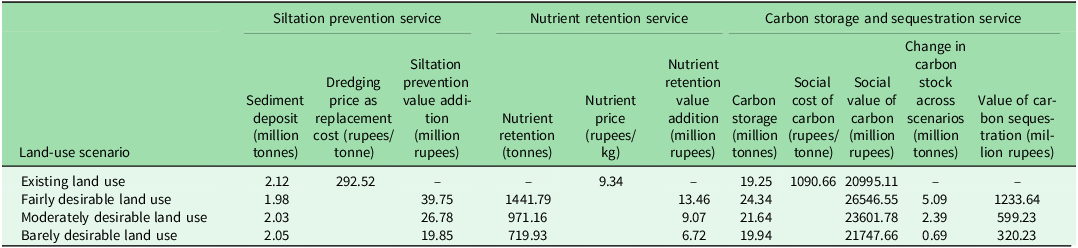
Increasing tree cover could significantly reduce stream sediment deposition by anchoring soil particles within the root system (Table 3 & Fig. S5 for a spatial map). Furthermore, the soil nutrient retention service linked to sediment capture highlights the potential for land management practices to influence nutrient retention. The value addition of nutrient retention services due to watershed land-use changes ranged between 6.7 million and 13.5 million rupees/year depending on the desired level of tree cover and cropping practices.
Estimates of sediment prevention with nutrient retention and carbon storage status with economic assessment of land-use changes in the barrage catchment.

Carbon stock benefits
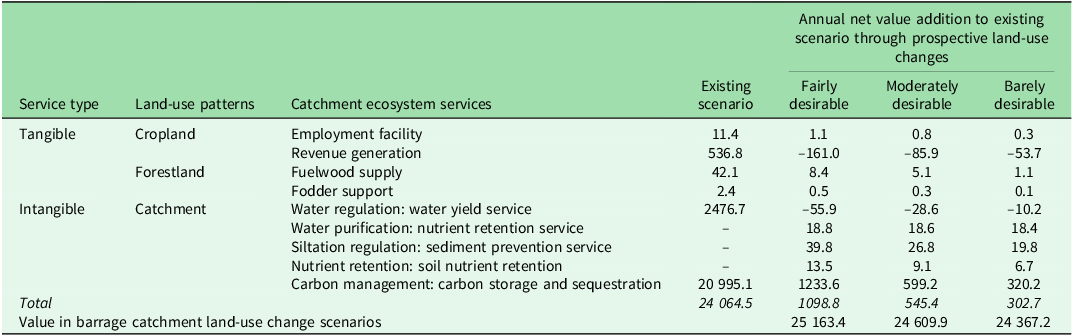
There was a substantial positive association between increasing tree/forest cover and carbon stock potential (Table 3 & Fig. S6 for raster maps). The pro-watershed scenario, characterized by extensive tree cover via agroforestry and plantation forests, exhibited the highest such potential, with a 26% increase in the carbon store compared to the existing baseline land use. Conversely, the scenario with minimal changes to tree cover, categorized as barely desirable, resulted in gains of only 4% in the carbon store. This limited improvement was due to the marginal difference in carbon intensity between traditional and organic agricultural practices within the watershed under the barely desirable scenario. Nevertheless, the pro-watershed land-use scenario, with increased tree cover through the implementation of agroforestry systems and the creation of plantation forests in bare/sparsely vegetated areas, generated an additional annual value of 1098.8 million rupees (Table 3). The potential for the carbon stock and its corresponding economic value gradually decreased with scenarios involving less tree cover, as was observed for the moderately and barely desirable land-use changes.
Encompassing costs and both tangible and intangible benefits, carbon storage accounted for just over 87% of the 24 064 million rupees/year in ecosystem services generated by current land uses (Table 4). The main tangible benefits of the barrage watershed were derived from croplands and forestlands, together amounting for 592.7 million rupees/year. However, limited forestlands restricted the potential benefits from timber and non-timber products. Furthermore, the residents were primarily relying on commercial cropping with synthetic inputs, so a shift towards agroforestry or organic farming practices could result in decreased farmland revenue, primarily due to lower crop yields. Despite this potential loss, we identified some positive outcomes, such as new employment opportunities resulting from community engagement in watershed management, with a possible 3–10% increase in local jobs. In addition, although increased tree cover could potentially reduce water yield due to higher water consumption and interception, this trade-off would be balanced by improved water filtration, sediment control, nutrient retention and carbon storage.
Total economic value of ecosystem services under various land-use scenarios in the barrage catchment (million rupees/year).

The fairly desirable land management scenario involving agroforestry offered the highest net value addition (4.6%) to ecosystem services; however, this value was reduced under less desirable scenarios to 24367 million rupees/year in the barely desirable case. The cost–benefit analysis revealed favourable ratios for all scenarios (fairly desirable agroforestry 1:6.1, moderately desirable mixed cultivation 1:5.8, barely desirable organic farming 1:5.7). Moreover, the observed willingness of 40% of villagers to instantaneously adopt a pro-watershed land-use change (with a pecuniary incentive) leads to favourable social cost–benefit outcomes through the potential design of a payment for ecosystem services system.
Discussion
Our analysis revealed that while agroforestry-based scenarios yielded the highest value for ecosystem services, strong agricultural dependence and a reliance on commercial cropping act as barriers to their adoption. This is because a shift towards agroforestry or organic farming could result in decreased farmland revenue, a perception that is substantiated by evidence from local studies showing that such a transition could cost farmers nearly 30% in revenue due to lower crop yields, with trees accounting for two-thirds of this loss and organic farming for one-third (Govindaraj et al. Reference Govindaraj, Thorat and Rathnakumar2016, Sharma et al. Reference Sharma, Singh, Tiwari and Verma2017). The ecosystem benefits included substantial water purification, which is crucial for downstream users, and, aligning with findings in other contexts (Mei et al. Reference Mei, Kong, Ke and Yang2017, Jiang et al. Reference Jiang, Wang, Zuo and Du2023), robust sediment retention, which is critical for preventing siltation in a barrage reservoir (e.g., Adelisardou et al. Reference Adelisardou, Mederly and Minkina2023, Ekanayaka et al. Reference HBGDMP, Abeysingha, Amarasekara, Ray and Samarathunga2025), as well as significant carbon storage, which is consistent with Babbar et al. (Reference Babbar, Areendran, Sahana, Sarma, Raj and Sivadas2021). Despite the potential for some values to decline, the long-term ecological and economic gains from nature-based solutions were compelling. Although increased tree cover led to decreased water yield, consistent with hydrological findings in similar regions elsewhere (e.g., Aneseyee et al. Reference Aneseyee, Soromessa, Elias, Tomasz Noszczyk and Feyisa2022), the overall benefits of pro-watershed change were considerable. Importantly, the social benefits were found to outweigh the costs by almost sixfold. Our comprehensive and spatially explicit economic valuation of a forested barrage watershed integrating detailed ecological service modelling with socioeconomic considerations offers crucial insights for similar settings in other regions.
For policymakers at the barrage authority, these findings underscore that investing in pro-watershed land uses is an economically sound strategy, robustly justifying resource allocation for nature-based solutions. In reality, this necessitates targeted incentive mechanisms for upstream residents designed to mitigate initial livelihood impacts while actively encouraging the adoption of agroforestry and organic farming practices. Such detailed cost–benefit insights facilitate the design of community participatory watershed management plans that are both ecologically effective and socially equitable, fostering genuine buy-in and promoting long-term regional sustainability through enhanced ecosystem service provision.
Conclusions
The Navnera barrage management plan prioritizes a nature-based approach, actively engaging local communities to promote pro-watershed land-use change in order to improve ecosystem services. This ensures greater water flow and quality while potentially reducing operational costs. Our economic analysis reveals that an agroforestry-focused land-use scenario yields the highest value for these services, although this value declines with less desirable options such as organic farming. Despite potential agricultural revenue declines, the benefits of pro-watershed land-use change, including improved water purification, sediment control, nutrient retention and carbon storage, are considerable. Crucially, the social benefits outweigh the costs by a factor of almost six.
Providing the barrage authority with valuable cost–benefit insights into watershed land-use options facilitates the design of community participatory watershed management plans and informs the development of incentive mechanisms for upstream villagers. This encourages the adoption of agroforestry and organic farming to foster sustainable watershed management and enhance ecosystem service provision.
Supplementary material
For supplementary material accompanying this paper visit https://doi.org/10.1017/S0376892925100271.
Acknowledgements
The study was carried out at the Indian Institute of Forest Management Bhopal, led by the authors with a project team consisting of Richa Tomar, Vikram S Vyas and Nandkishor Dhumal. The authors would like to express their gratitude to Rohitasva K Jaimini and the officers of Water Resources Zone Kota for their cooperation and helpful suggestions. Thanks are also due to the catchment villagers in watershed project area for their participation in the primary survey and farmed field experiment. Special thanks to the Editor-in-Chief, Associate Editor and anonymous reviewers of Environmental Conservation for valuable comments on an earlier draft of the article. The usual disclaimer applies.
Financial support
This article is based on a study entitled ‘Institutional Mechanism of Payment for Ecosystem Services in the Watershed Area under Navnera Barrage in Kota’, supported by the Water Resources Zone Kota, Department of Water Resources, Government of Rajasthan.
Competing interests
The authors declare none.
Ethical standards
Not applicable.