Implications
The results of this study highlight the potential advantages of mixed crop-livestock farming over specialised systems with regard to the sustainable development of European agriculture. Mixed crop-livestock farming is a good compromise on economic and environmental dimensions especially in less favoured areas. Nevertheless, for these mixed crop-livestock systems the wide variability of each indicator underlined the fact that careful management is required but not always applied.
Introduction
The Common Agricultural Policy (CAP) of the European Union (EU) has led to specialisation of European agricultural systems (Antrop, Reference Antrop2005). CAP aims at supporting European farmers’ incomes and rural development through direct subsidies (Veysset et al., Reference Veysset, Bebin and Lherm2005; EU, 2011). In developed countries, agricultural intensification and specialisation enabled productivity to be improved but also had detrimental impacts on the environment and questioned the economic viability of a huge number of farms (Wilkins, Reference Wilkins2008). Mixed crop-livestock systems, combining livestock and cash crops at farm level, are considered to be a good way to achieve sustainable intensification of agricultural systems. These systems which were common in the past (Mazoyer and Roudart, Reference Mazoyer and Roudart2006), are again attracting worldwide interest, particularly for economic and environmental reasons at farm level. Mixed crop-livestock systems are the highest level of integration among agricultural systems. While maximising interactions between crop and livestock production, mixed crop-livestock systems benefit the environment by improving nutrient cycling (Hendrickson et al., Reference Hendrickson, Hanson, Tanaka and Sassenrath2008). Mixed crop-livestock systems also generate higher economic efficiency in saving production costs through complementarities between crop and livestock (Wilkins, Reference Wilkins2008). Economies of scope occur as mixed crop-livestock systems reduce their production costs through combined elaboration of products (Vermersch, Reference Vermersch2007). Diversifying production is also for farmers a way of reducing risks with regard to market fluctuations (Russelle et al., Reference Russelle, Entz and Franzluebbers2007).
The advantages of mixed crop-livestock systems are usually assessed through the literature and experimental studies. Our objective was to test – in real-world conditions – if mixed crop-livestock systems have a better economic performance and less impact on the environment than specialised farms. This study is a first step in evaluating the potential advantages of mixed crop-livestock systems. Our study was based on the entire farm population of an area that is representative of upland conditions in southern Europe. Mixed crop-livestock systems have survived up to now in this area. We focused our assessment on the main dimensions in which, according to the literature, mixed crop-livestock systems are advantageous: on the economic and environmental dimensions (Schiere and Kater, Reference Schiere and Kater2001). We used indicators related to these two dimensions to discuss our results in the context of results reported in the literature.
Material and methods
Research context and study area
This study is part of an interdisciplinary research programme on the relations between landscape, agriculture and biodiversity in the French ‘Coteaux de Gascogne’. This area is located in south-western France in the Pyrenean Piedmont (Supplementary Material 1), and is part of the ‘European Long-Term Ecological Research’ network. A participatory study involving local stakeholders is underway to investigate the future of agricultural systems in the study area, which includes four neighbouring villages (Choisis et al., Reference Choisis, Sourdril, Deconchat, Balent and Gibon2010).
The ‘Coteaux de Gascogne’ is an upland area where specialisation of agriculture has been limited. Global agro-ecological zoning (FAO, 1995) classifies the region as a temperate area with frequent summer droughts, with average precipitation of 40 mm/month. Annual precipitation is low (700 mm/year) and variable over the year with most falling in spring (65 to 76 mm/month). Due to soils, climatic conditions and the local agricultural tradition, grasslands remain dominant in total utilised agricultural area (UAA). UAA includes all farm hectares dedicated to arable land, areas always under grass cover and permanent crops (FADN, 2011). Sixty-one per cent of the UAA is composed of temporary and permanent grasslands on the many steep slopes. Of the arable land, 26.5% is used to produce wheat and maize silage to feed herds (Agreste, 2010); cash crops such as soya beans, colza and sunflowers are also grown. Half of the existing farms are mixed crop-livestock farms, with grass-based beef and crops (Choisis et al., Reference Choisis, Sourdril, Deconchat, Balent and Gibon2010). One of them also produces force-feeding ducks and another one produces chicken. The remaining are specialised in cash crops, dairy or beef production.
Farm population surveyed and data collection
Our work was based on an exhaustive assessment of the population of farms in the study area (∼4000 ha). ‘Spatially-explicit’ surveys of the local farm population (Mottet et al., Reference Mottet, Ladet, Coqué and Gibon2006) were used to obtain data on (i) farm structure, (ii) technical-economic performances and (iii) farmers’ land-management practices. Data were collected on 56 out of the 61 farms in the study area at the beginning of 2007. The farms surveyed covered 93% of the UAA in the study area. Information required for the study was lacking on eight farms in the sample, so data from 48 farms were used.
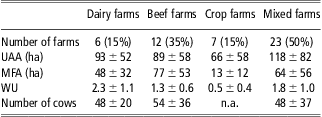
The 48 farms were classified into four types of farming systems: dairy farms, beef farms, crop farms and mixed crop-livestock farms. Mixed crop-livestock systems corresponded to the economic definition of Seré and Steinfeld (Reference Seré and Steinfeld1996): ‘Livestock systems in which more than 10% of the dry matter fed to animals comes from crop by-products, stubble or more than 10% of the total value of production comes from non-livestock farming activities’. Beef and dairy specialised systems obtain more than 90% of their gross margin from animal production; crops and grasslands are therefore mainly produced to feed cows. The main characteristics of farming systems are summarised in Table 1.
Main characteristics of farms surveyed according to farming systems in the population (mean ± s.d.)

UAA = utilised agricultural area; MFA = main fodder area; WU = work unit
UAA is the total farm hectares dedicated to arable land, areas always under grass cover and permanent crops; MFA is the total farm hectares dedicated to fodder production (grasslands, maize for silage, …); WU is a full-time on-farm worker over the course of 1 year.
Data elaboration
Farm economic indicators used: overall gross margin
Overall gross margin is widely used in economics to estimate the production potential of a farm (Veysset et al., Reference Veysset, Bebin and Lherm2005). The overall gross margin is calculated at the farm scale and enables technical-economic analysis. We calculated the overall gross margin as follows:


Breeding costs were including veterinary services and supplies. CAP premiums are subsidies paid by the EU to farmers that fulfil a specific condition of the CAP (EU, 2011). Results were expressed per work unit, to give an indication of labour productivity, and per ha of UAA, to compare all farming systems.
Specific costs: to test if farms using mixed crop-livestock systems purchased fewer inputs than other farming systems (Wilkins, Reference Wilkins2008), we analysed specific costs. Total costs per ha of UAA gave an indication of costs-at-sale of the whole farm. To go into more detail, we chose inputs that are considered to be less necessary in mixed crop-livestock systems thanks to the interactions between crops and livestock, that are, purchased fertiliser and feed (Russelle et al., Reference Russelle, Entz and Franzluebbers2007). These indicators were expressed in Euros per ha of UAA.
Indicators of farm land-management practices: Characterisation of farmers’ crop practices
This part of the study allowed us to identify types of farmers’ crop practices in relation to their environmental impact. Schiere and de Wit (Reference Schiere and de Wit1995) described four types of farming systems as regards to environmental impact among other things. Three types corresponds to local farms: Low External Input Agriculture (LEIA), High External Input Agriculture (HEIA) and New Conservation Agriculture (NCA). LEIA and NCA are relatively environmental-friendly, whereas HEIA leads to waste disposal problems of specialised farms. In HEIA, components coexist independently from each other. LEIA and NCA are based on recycling and integration of on-farm components through an increase in labour and keen management. NCA matches production as closely as possible to the resource base. In NCA, farmers tend to adopt new conservation techniques such as minimum or no tillage practices and use of leys. We use this classification to characterise farmer's practices.
Farm land use: landscapes with a complex structure are known to enhance local biodiversity in agroecosystems (Fahrig et al., Reference Fahrig, Baudry, Brotons, Burel, Crist, Fuller, Sirami, Siriwardena and Martin2011). Studying farm land use to assess their diversity in farming systems could help evaluate environmental-friendly farm land use. Permanent grasslands are potential species-rich habitats (Gibon, Reference Gibon2005): their conservation favours biodiversity. As diversity in landscape and land use is known to enhance wild animal biodiversity, we also considered the area allocated to crops. To assess the enhancement of biodiversity through farm land use, we calculated for each farm the proportion of three major land uses classified in a simplified functional way: crops, temporary and permanent grasslands. These indicators were calculated for the year 2007 using data gathered during the survey and expressed as a percentage of each land use in the total UAA.
Nitrogen farm-gate balance: as a key nutrient, nitrogen can be used to illustrate interactions between crops and livestock in mixed crop-livestock systems (Hendrickson et al., Reference Hendrickson, Hanson, Tanaka and Sassenrath2008). In our study, we wanted to evaluate the risk of pollution due to Nitrogen Surplus (NS) at the farm level. We consequently chose the nitrogen farm-gate balance method, which is appropriate for a farm level assessment (Simon and Le Corre, Reference Simon and Le Corre1992; Vayssières et al., Reference Vayssières, Guerrin, Paillat and Lecomte2009). The nitrogen farm-gate balance method nevertheless has one serious limitation: the balance is only calculated for 1 year on the basis of apparent flows. NS from the atmosphere and the soil is not included in the balance (Vayssières et al., Reference Vayssières, Guerrin, Paillat and Lecomte2009).
The annual nitrogen farm-gate balance was calculated at the whole-farm scale. The processes involved (via plant, animal and soil activity) are not taken into account in the balance. NS is calculated as follows:

Nin is the total amount of nitrogen in purchased inputs: feed concentrate, forage (including leys), straw, animals, mineral fertilisers and manure.
Nout is the sum of nitrogen outputs of the system: animal products such as milk, animals and animal manure, but also crops, straw and forage that are sold. Nin and Nout are expressed in kg N/year. NS is expressed in kg N/ha per year.
For this calculation, both the quantity and nitrogen concentration of each input and output are needed. The quantity of each component was provided by the farmers during the 2007 survey. The nitrogen concentration exported per crop, forage and livestock product as the nitrogen concentration in animal feed were taken from CORPEN references (CORPEN, 1988). The concentration of nitrogen in the nitrogen fertiliser was provided by the farmers in kg N/ha per year for each type of crop.
Four additional hypotheses were related to local farm functioning. In systems with livestock (i) all manure was reused in the system, (ii) all straw and hay were reused for animals, (iii) the crop used to feed the animals was not considered as an output of the system and (iv) only concentrates were purchased to feed animals.
Comparison ranking of mixed crop-livestock systems with 2007 data from the Farm Accountancy Data Network (FADN) at regional, national and European scales: to evaluate the potential results of local mixed crop-livestock systems compared with specialised systems, we ranked the four types of systems on each indicator. The most favourable system for an indicator is ranked 1; the least favourable is ranked 4. For quantitative indicators, the classification was made according to the value, that is to say, the most favourable systems having the highest overall gross margin or the lowest specific costs. Similarly, the classification of farming systems was done according to the number of farms in HEIA type, as it was the least favourable option for the environment (Schiere et al., Reference Schiere, Ibrahim and van Keulen2002). The type of system having the lowest percentage of farms in HEIA was the first ranked. The classification of systems according to farm land use was considering the most diversified farm land use.
We compared the ranking of mixed crop-livestock systems with 2007 data from the FADN at regional scale farms of the Midi-Pyrénées region, national scale and European scale (FADN, 2011). FADN only considers farms with more than 0.75 work units, while our exhaustive survey of farms included three farmers with off-farm jobs, with less than 0.75 work units. As no indicator of nitrogen balance was available in the FADN, we compared our results (i) at national scale, with Simon et al. (Reference Simon, Grignani, Jacquet, Le Corre and Pagès2000) who evaluated the NS of 555 French farms as a function of the farming system and (ii) at European scale, to other European studies, in which the nitrogen farm-gate balance was calculated as a function of farming systems: de Koeijer et al. (Reference de Koeijer, Renkema and van Mensvoort1995) in the Netherlands, Lord et al. (Reference Lord, Anthony and Goodlass2002) in the United Kingdom and Bassanino et al. (Reference Bassanino, Grignani, Sacco and Allisiardi2007) in Italy.
Data analysis
Sensitivity analysis
We assessed whether diversification allowed mixed crop-livestock systems to reduce risk with respect to fluctuations in the prices of inputs and sales. For that, we performed a sensitivity analysis of fluctuations in the overall gross margin due to variations in the prices of two types of inputs: fertilisers for wheat (all study farms cultivated wheat), and the price of feed concentrates for farms with livestock. To test the potential risk-reducing effects of mixed crop-livestock systems as regards to sales, we analysed fluctuations in the overall gross margin due to variations in the sales price of wheat and beef, because all livestock farms sell beef even if it is not the major item produced for sale by dairy farms.
For each input and sale price considered, the sensitivity analysis was based on the year 2007 (a representative year for French agriculture), 2008 (a rather good year for livestock production) and 2009 (a rather difficult year for livestock production). Variations in overall gross margin between the year 2007 and the year 2008 were calculated as follows:

As only the prices of inputs varied in the annual costs, fluctuations due to input prices were calculated as follows:

Variations between 2007 and 2009 were calculated in the same way. A corresponding calculation was made for the fluctuations of overall gross margin due to sale prices that induced variations in the annual products. The variation in each factor is expressed in percentage of the 2007 overall gross margin per work unit.
Multiple correspondence analysis
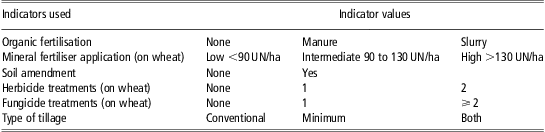
A Multiple Correspondence Analysis (MCA) was performed to classify local farming systems according to the Schiere and de Wit classification (Reference Schiere and de Wit1995). MCA was based on six qualitative indicators calculated at the farm level (Table 2). In our study, we chose to analyse the cropping system because it was an integral part of all farming systems studied.
Indicators of crop management practices selected for the study

UN is a Unit of Nitrogen: an organic or mineral amendment corresponding to 1 kg of nitrogen per hectare.
Conventional tillage corresponds to a deep tillage between 30 and 40 cm; minimum tillage consists of a minimum soil compaction with tillage between 8 and 15 cm depth and permanent cover.
The type of organic fertilisation indicated the level of integration between the crop and livestock components. The amount of mineral fertilisation and the number of herbicide and fungicide treatments enabled us to classify systems according to the external inputs used for crop management. The type of tillage enabled us to differentiate NCA from other systems.
Cluster analysis
Farmers’ practices were clustered using a k-means clustering on the five first axes coordinates of the MCA, which explained 76.5% of total variance. We used a k-means clustering with dynamic swarms based on four fixed k-clusters’ centroids. We applied a random partition method on the four centroids, on five dimensions and 48 individuals. Finally, the different farming systems (crop, dairy, beef and mixed crop-livestock farms) were projected onto the MCA factorial map to compare them with the classification of farmers’ practices. A χ 2-test was used to test independence between systems and practices. Analyses were done using R software, version 2.10.1.
Analysis performed for quantitative farm indicators
The same analyses were performed for all quantitative farm indicators. Each quantitative indicator was calculated for each farm. Averages and standard deviations were then calculated for each type of farming system: dairy, crop, beef and mixed crop-livestock systems. Differences between farming systems for each indicator were tested using ANOVA. Analyses were performed with the statistical software R 2.10.1.
Results
Economic performances according to farming systems
Even if crop farms appeared to have a higher gross margin per work unit than farms with livestock, there was no significant difference between gross margins per work unit as a function of the farming system (Table 3). Dairy farms had the highest overall gross margin per ha of UAA (P < 0.05) and the highest total costs (P < 0.01). Dairy farms also had the highest fertiliser costs while beef farms had the lowest (P < 0.01). Mixed crop-livestock farms were in between and fertiliser costs were comparable with those of crop farms. Mixed crop-livestock systems had lower feed costs per cow than dairy farms but significantly higher than beef farms (P < 0,001). There was wide variability within farming systems for each of these indicators.
Gross margin and specific costs according to the farming system

Differences between treatments are indicated as follows: a, b for P < 0.05; A, B for P < 0.01.
*P < 0.05; **P < 0.01; ***P < 0.001.
On the two periods studied, no significant difference was observed between systems regarding sensitivity to the price of fertilisers (P = 0.69). Concerning feed concentrates, dairy systems were more sensitive than beef systems to fluctuations in market prices in both comparisons (P = 0.002). Concerning fluctuations in the sales price of wheat, crop farms were more sensitive than other farming systems in both comparisons (P < 0.001). Beef farms were more sensitive than dairy farms to fluctuations in meat sale prices in both comparisons (P = 0.04 and P = 0.03, respectively). In the sensitivity analysis, mixed crop-livestock systems remained intermediate: they were never the most sensitive to either of the variations in the prices of inputs and outputs we tested. The detailed results of the sensitivity analysis are summarised in Supplementary Material 2.
Environmental evaluation
Characterisation of farmers’ crop management practices
The five MCA first axes explained 76.7% of variance. The first axis (F1), explaining 24.6% of variance, showed a gradient in the level of inputs used (Figure 1). The second axis (F2), explaining 17.7% of variance, revealed a gradient of tillage practices from conventional tillage to no tillage.
F1-F2 MCA factorial map with superposition of the farming systems and k-mean clustering on crop management practices. The first axis (F1) showed a gradient in the level of inputs used. The second axis (F2) revealed a gradient of tillage practices from conventional tillage to no tillage. K-means clustering on the five first axes of the MCA distinguished four types of crop management practices among farms. Type 1 and 4 corresponded to NCA (New Conservation Agriculture) with minimum or no tillage. Type 1 used small amounts of inputs (6 farms); type 4 corresponded to intermediate to high use of inputs (3 farms). Type 2 matched the description of HEIA (High External Inputs Agriculture) with high use of inputs and conventional tillage (17 farms). Type 3 was LEIA (Low External Inputs Agriculture) with low to intermediate use of inputs and conventional tillage (22 farms).

K-means clustering on the five first axes of the MCA distinguished four types of crop management practices among farms. Type 1 and 4 corresponded to NCA with minimum or no tillage. Type 1 used small amounts of inputs (six farms); type 4 corresponded to intermediate to high use of inputs (three farms). Type 2 matched the description of HEIA with high use of inputs and conventional tillage (17 farms). Type 3 was LEIA with low to intermediate use of inputs and conventional tillage (22 farms).
A wide range of management practices was observed among farming systems of a similar type (Supplementary Material 3). The χ 2-test revealed a significant link between types of crop practices and types of farming systems (χ 2 = 17.07, d.f. = 9, P = 0.048). HEIA and LEIA were the most widely used in all the farming systems. Dairy farms mainly used HEIA, whereas beef and crop farms mostly used LEIA. Mixed crop-livestock farms used a wide range of practices but the majority were HEIA and LEIA with conventional tillage and intermediate to high use of inputs. NCA (Type 1 and 4) were infrequently represented in any of the farming systems.
Farm land use
Mixed crop-livestock and dairy systems had the most diversified land use at farm level (Table 4). These two types of systems had less grassland than beef farms but greater diversity. The percentage of permanent grasslands within the total grasslands area is higher in mixed crop-livestock systems than in dairy farms.
Farm land use in percentage of UAA as a function of the farming system

UAA = utilised agricultural area.
UAA is the total farm hectares dedicated to arable land, areas always under grass cover and permanent crops.
*P < 0.05; **P < 0.01; ***P < 0.001.
Nitrogen farm-gate balance
Mixed crop-livestock farms had the lowest positive NS, 24.6 ± 26.1 kg N/ha (P < 0.01; Table 5). The difference between mixed crop-livestock farms and beef farms was not significant (NS of 37.9 ± 23.3 kg N/ha). Crop farms had a negative NS of −11.9 ± 34.2 kg N/ha that corresponds to a potential loss of nitrogen in the soils in 2007.
Nitrogen farm-gate balance as a function of the farming system (kg N/ha)

Differences between treatments are indicated as follows: a, b for P < 0.05; A, B for P < 0.01.
NS (nitrogen surplus) is calculated as follows: NS = (Nin − Nout)/UAA.
Nin is the total amount of nitrogen in purchased inputs: feed concentrate, forage (including leys), straw, animals, mineral fertilisers and manure.
Nout is the total amount of nitrogen outputs of the system: animal products such as milk, animals and animal manure; crops, straw and forage that are sold. Nin, Nout and NS are expressed in kg N/year.
*P < 0.05; **P < 0.01; ***P < 0.001.
In mixed crop-livestock, crop and beef systems, nitrogen inputs level was in correspondence with nitrogen outputs level: (i) mixed crop-livestock farms had intermediate nitrogen inputs and outputs; (ii) crop farms had high nitrogen inputs and outputs; (iii) beef farms had the lowest nitrogen inputs and outputs. This led to a low nitrogen farm-gate balance in these three systems (Table 5). Dairy farms had the highest nitrogen inputs and intermediate nitrogen outputs. This imbalance led to a high NS in the dairy farm system (60.5 kg of N/ha), mainly due to the large quantities of purchased concentrates and fertilisers. Considerable variability of NS was observed among farms within each type of farming system.
Mixed crop-livestock systems are efficient thanks to synergies and diversification
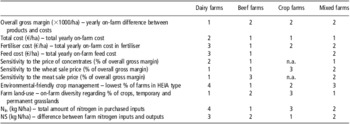
According to the indicators used in this study and given the conditions prevailing in the study area, mixed crop-livestock systems were never the most favourable neither the least favourable to economical and environmental dimensions (Table 6).
Ranking of farming systems according to the indicators used in the study

HEIA = High External Input Agriculture; NS = nitrogen surplus.
One corresponds to the most favourable system with respect to a given indicator; the same rank was used when there was no significant difference between two systems.
Mixed crop-livestock systems reduce farms’ financial risks
Concerning farm economics, mixed crop-livestock systems never had the highest gross margin but on-farm autonomy allows mixed crop-livestock system to minimise costs (Table 6). In our study, only beef farms had significantly lower feed and fertiliser costs than mixed crop-livestock systems because they maximise the use of grasslands.
Mixed crop-livestock systems were relatively insensitive to fluctuations in inputs and sales prices, in contrast to specialised systems (Table 6). This confirmed our hypothesis that diversification makes mixed crop-livestock systems less sensitive to market price fluctuations. Although mixed crop-livestock systems never benefitted from the occasional higher sales price of a product, they were never threatened by lower prices.
Mixed crop-livestock systems are relatively environmental-friendly
According to our environmental classification of crop management practices, mixed crop-livestock systems were classified as intermediate with respect to the other systems (Table 6). Half were classified in HEIA, which is the least environmental-friendly option. Some of them tended to become NCA, such as crop and beef systems. Mixed crop-livestock systems have the highest diversity of farm land use and were shown to represent a lower risk of nitrogen pollution than dairy farms (Table 6).
Mixed crop-livestock systems appear to be appropriate at larger scales
Comparison with regional assessment
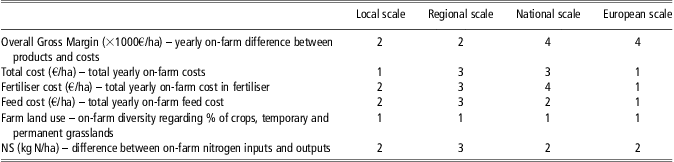
Mixed crop-livestock systems appear to be a good compromise with respect to the overall gross margin per ha (2nd) at the regional scale, but the regional average gross margin was higher than in our study (Table 7). Regional mixed systems had the second highest total costs due to larger amounts of fertiliser and feed purchased than by other systems. A lower level of on-farm autonomy was reached at the regional scale, but higher sales prices for products led to a higher average gross margin.
Mixed crop-livestock ranking with respect to the three specialised farming systems according to the indicators used in our study at local, regional, national and European scales

One corresponds to the most favourable system with respect to a given indicator.
At the regional scale, mixed crop-livestock farms had the most diversified farm land use. Mixed crop-livestock farms had a higher NS than at the local scale and also a lower rank (3rd) than other farming systems.
Comparison with national and European assessments
French national and European data confirmed the environmental advantages of mixed crop-livestock systems but not the economic advantages.
At the national scale, based on our economic indicators, mixed crop-livestock farms ranked lower than at the local scale. Mixed crop-livestock farms had the lowest gross margin and highest fertiliser costs. Feed costs were limited by high forage production. Mixed crop-livestock farms had the most diversified farm land use. Mixed crop-livestock systems ranked second for NS after crop farms. This ranking is comparable to the results of our local nitrogen balance.
In the European FADN evaluation, mixed crop-livestock farms also had the lowest overall gross margin. Like in our study, they minimised the use of farm inputs and had the lowest fertiliser and feed costs. Mixed crop-livestock farms also had the most diversified land use, whereas European dairy and beef farms only had grasslands and crop farms only had arable land. At the European scale, mixed crop-livestock systems ranked between crop farms with the lowest NS and specialised livestock farms with the highest one. In the British and Italian studies, mixed crop-livestock systems were included in pasture-based beef systems.
Discussion
An evaluation of local mixed crop-livestock systems in line with literature
According to our results, mixed crop-livestock systems ensure the financial security of farms, in minimising costs. These results are in line with the literature (Vermersch, Reference Vermersch2007; Hendrickson et al., Reference Hendrickson, Hanson, Tanaka and Sassenrath2008). Mixed crop-livestock systems minimise external inputs thanks to synergies between components particularly fertiliser (Wilkins, Reference Wilkins2008) and feed (Russelle et al., Reference Russelle, Entz and Franzluebbers2007). Diversification allows mixed crop-livestock systems to be less sensitive to inputs and sales price fluctuations, in accordance with Wilkins (Reference Wilkins2008) and Vermersch (Reference Vermersch2007).
On the environmental dimension, mixed crop-livestock systems had the most diversified farm land use, what is known to enhance birds and insects biodiversity through spatial heterogeneity (Fahrig et al., Reference Fahrig, Baudry, Brotons, Burel, Crist, Fuller, Sirami, Siriwardena and Martin2011). Mixed crop-livestock systems were shown to represent a lower risk of nitrogen pollution than the other systems, in accordance with Russelle et al. (Reference Russelle, Entz and Franzluebbers2007) and Schiere and Kater (Reference Schiere and Kater2001). Nutrient cycling is one way of mitigating external inputs in autonomous systems (Schiere et al., Reference Schiere, Ibrahim and van Keulen2002).
Impact of territorial potentialities on farms’ economics
The economic advantages identified in our study were not always confirmed at larger scales. The location of the agricultural system is in fact a key component in impact assessment (Kruska et al., Reference Kruska, Reid, Thornton, Henninger and Kristjanson2003). Farming systems diversity is linked to the specific soil, climatic and historical characteristics of each small region (Cochet and Devienne, Reference Cochet and Devienne2006). The Midi-Pyrénées region is heterogeneous and composed of three main ‘small regions’. Intensive crop farms are located in the arable land area; small livestock systems are located in the mountainous area. Our survey was conducted in part of the third small region, where intensification exists but is limited by soil and climatic conditions. Location of the study site could partly explain the differences observed with the regional scale. At national and European scales, territories are obviously more contrasted, which could explain the larger differences observed between farming systems at these scales. In Europe, most of the agricultural lands, in a favourable pedoclimatic context, have allowed specialisation and intensification either in cash crops or livestock production (Wilkins, Reference Wilkins2008). Mixed crop-livestock systems are mostly found in unfavoured areas, where they cannot produce as good economic results. Their potential advantages are often unknown.
Mixed crop-livestock systems have been marginalised by the European agricultural development. Two major factors could explain this. First, the globalisation of the market and the CAP subsidies encouraged European farmers to adopt logic of economies of scale (Vermersch, Reference Vermersch2007) farmers enlarged and specialised their farm to reduce the unitary price of inputs. On the contrary, mixed crop-livestock were based on the logic of diversification and economies of scope lowering their costs through combined elaboration of products (Vermersch, Reference Vermersch2007). The second factor is more internal: the European availability of agricultural work force is continuously decreasing. Mixed crop-livestock systems need a large level of labour to combine both crops and livestock. In particular in unfavoured areas, such as in our case-study, the lack of successors is high and led to abandonment of mixed crop-livestock systems even for farmers who did not want to (Ryschawy et al., Reference Ryschawy, Choisis, Choisis and Gibon2011).
Wide within-system variability observed for each indicator
In our study, wide variability within local farming systems was observed for each indicator. Within-system variability appeared to be as important as between-system variability. Our exhaustive survey highlighted within-system variability throughout the study area, as all commercial farms currently working land in the study area were included.
Within-system variability could also partly depend on our system of classification, in which only farms with more than 10% of total production coming from non-livestock activities were considered as mixed crop-livestock systems. Dairy farms and beef farms that produced crops to feed animals were consequently excluded from mixed crop-livestock systems. From an agronomic point of view, some dairy and beef farms functioned in the same way as mixed crop-livestock systems: the farmers had same rationales, for example, maximising autonomy at the farm scale (Russelle et al., Reference Russelle, Entz and Franzluebbers2007). Thus in research studies, the same designation can cover a wide range of production systems, for example, the evaluation of NS according to farming systems, see de Koeijer et al. (Reference de Koeijer, Renkema and van Mensvoort1995) in the Netherlands v. Lord et al. (Reference Lord, Anthony and Goodlass2002) in the United Kingdom.
The wide variability observed within mixed crop-livestock systems was also linked to the wide range of farmers’ practices. Advantages exist only if coordination between animal and crops is maximised through careful management (Hendrickson et al., Reference Hendrickson, Hanson, Tanaka and Sassenrath2008). Some systems referred to as ‘mixed crop-livestock systems’ could, for example, correspond to the juxtaposition of two intensive production units with little coordination. Such systems correspond to the definition of Seré and Steinfeld (Reference Seré and Steinfeld1996), even if they do not increase on-farm autonomy. Other studies revealed major variability of farmers’ practices within the same farming system (Joannon et al., Reference Joannon, Bro, Thenail and Baudry2008). Vayssières et al. (Reference Vayssières, Guerrin, Paillat and Lecomte2009) also found very different NS between comparable farming systems in similar soil and climatic conditions and a similar level of intensification.
Addressing farming types is only the first step in describing farms’ economic and environmental dimensions, and on its own, does not suffice. Differences between farmers’ practices and strategies should be explained through a Farming System approach. As recommended by Gibon et al. (Reference Gibon, Sibbald, Flamant, Lhoste, Revilla, Rubino and Sorensen1999), a better understanding of the whole livestock system should allow us to link our results with knowledge on farmers’ decisions and practices.
Conclusion
This study reports on an economic and environmental comparison between mixed crop-livestock systems and specialised systems using indicators. When the economic and environmental dimensions were taken into consideration, mixed crop-livestock systems rarely turned out to be the most favourable system but were never the least favourable. These results are in line with those reported in the literature. The comparison of our results with regional, national and European data allowed us to confirm some environmental advantages of mixed crop-livestock farms but not economical ones.
The importance of the local territorial context in the potential economic advantages of mixed crop-livestock systems was underlined. Mixed crop-livestock systems are mostly found in unfavoured areas, where economic results are limited by soil and climatic conditions. Mixed crop-livestock systems have been marginalised by the European agricultural development. The globalisation of the market and the CAP subsidies encouraged European farmers to enlarge and specialise their farm to achieve economies of scale. The lack of agricultural work force in Europe could also partly explain the abandonment of mixed crop-livestock systems.
The wide within-system variability observed for each indicator underlined that addressing farming types is only a first step. An integrated approach of the whole mixed crop-livestock farm as a Farming System is needed to link our results with knowledge on farmers’ decisions and practices.
Acknowledgements
We thank for funding this study, the French National Agency for Research (ANR), under the BiodivagriM programme and the Midi-Pyrenees Region, under the INRA-Region research programme – project ‘CHAPAY’. We also thank the local actors of the French ‘Coteaux de Gascogne’, involved in this study.
Supplementary materials
For supplementary material referred to in this article, please visit http://dx.doi.org/doi:10.1017/S1751731112000675