Introduction
Traditionally, grain yield goal approach has been used for establishing nitrogen (N) fertilizer recommendations. A yield goal represents the maximum yield attainable with the best management practices and without the major constraint of water and nutrients. Danhke et al. (1998) defined the yield goal as the ‘yield per acre you hope to grow’, while North Dakota State University suggested the yield goal as the maximum possible yield obtained in last 4–5 years with an increase of 30–33% than the average yield. Robust algorithms are desirable for accurate in-season prediction of crop yield to achieve the yield goal. Currently, soil test-based N recommendations for maize in South Asia neither account for yield goal-based N application nor in-season prediction of grain yield. The soil test-based N recommendations are derived from soil organic carbon analysis of large tracts with similar climate and land use. These recommendations consist of applying split N doses at specific growth stages without considering spatial and temporal variability (Miao et al., Reference Miao, Mulla, Robert and Hernandez2006), leading to poor synchronization of fertilizer N supply with crop demand. Setting irrational yield targets in the face of temporal and spatial uncertainty led to continually excessive N application. Therefore, deciding fertilizer N topdressings while addressing the factors causing variability could be the key to achieve economically optimum grain yield goals in maize.
The recent introduction of tools like leaf color chart (LCC), chlorophyll meter (SPAD meter), and GreenSeeker optical sensors in agriculture has made possible site-specific and need-based N management based on the grain yield potential of maize (Bullock and Anderson, Reference Bullock and Anderson1998; Raun et al., Reference Raun, Johnson, Stone, Sollie, Lukina, Thomason and Schepers2001; Varinderpal-Singh et al., Reference Varinderpal-Singh, Yadvinder-Singh, Bijay-Singh, Thind, Kumar and Vashistha2011). LCC, an inexpensive and practically reliable tool, has been found promising in managing fertilizer N application in rice, wheat, and maize crops (Alam et al., Reference Alam, Ladha, Foyjunnessa, Khan, Harun, Khan and Buresh2006; Shukla et al., Reference Shukla, Ladha, Singh, Dwivedi, Balasubramanian, Gupta, Sharma, Singh, Pathak, Pandey, Padre and Yadav2004; ; Varinderpal-Singh et al., Reference Varinderpal-Singh, Yadvinder-Singh, Bijay-Singh, Thind, Kumar and Vashistha2011; Witt et al., Reference Witt, Pasuquin, Mutters and Buresh2005). Varinderpal-Singh et al. (Reference Bijay-Singh, Sharma, Jaspreet-Kaur, Mangi, Kent, Yadvinder-Singh, Varinderpal-Singh, Parvesh, Choudhary, Rajeev, Thind, Jagmohan-Singh, Uppal, Harmandeep, Ajay-Kumar, Rajneet, Monika, William and Gupta2011) observed a correlation of 0.84–0.90 between LCC readings and grain yield at 55 days after sowing (DAS) in maize. Better correlation between SPAD meter readings and maize grain yield was noticed at later vegetative growth stages (R4 and R5) by Blackmer et al. (Reference Blackmer and Schepers1995) and Piekielek et al. (Reference Piekielek, Fox, Toth and Macneal1995). The Normalized Difference Vegetative Index (NDVI) obtained using GreenSeeker optical sensors has been used to predict grain yield in maize (Teal et al., Reference Teal, Tubana, Girma, Freeman, Arnall, Walsh and Raun2006), wheat (Solie et al., Reference Solie, Raun, Whitney, Stone and Ringer1996; Reference Stone, Solie, Raun, Whitney, Taylor and RingerStone et al., 1996), and rice (Harrel et al., Reference Harrell, Tubana, Walker and Phillips2011). Adjusting NDVI measurements using cumulative growing degree days (CGDD) was identified as a more consistent predictor of grain yield at maturity (Raun et al., Reference Raun, Johnson, Stone, Sollie, Lukina, Thomason and Schepers2001). Further, Raun et al. (Reference Raun, Solie, Stone, Martin, Freeman, Mullen, Zhang, Schepers and Johnson2005) suggested that adjusting NDVI readings using CGDD with a growing base temperature value could predict final grain yield at any crop growth stage.
The crop growth stage has its own importance in accurate yield prediction. Teal et al. (Reference Teal, Tubana, Girma, Freeman, Arnall, Walsh and Raun2006) reported a strong relationship between NDVI at V8 stage and maize grain yield. A model developed by Martin et al. (Reference Martin, Raun and Solie2012) using various plant parameters and NDVI performed well in predicting maize yield at the V8 stage. Strong relationships between NDVI values at the V14 stage and grain yield were observed by Shaver et al. (Reference Shaver, Khosla and Westfall2014). Predicting grain yield accurately would not only give the estimation of final yield but also help the scientists and farmers to fine-tune the need-based in-season N applications. The available literature reveals that no such study to date in spring maize. Therefore, the present study was planned with the objectives to (i) predict spring maize grain yield potential using LCC, SPAD meter, and GreenSeeker optical sensor, (ii) evaluate the improvement in predicted yield using CGDD by establishing regression equations, and (iii) identify the best growth stage for making accurate yield predictions.
Materials and Methods
Experimental site and soil characteristics
Field experiments were established for 2 years (2017 and 2018) at Punjab Agricultural University research farms, Ludhiana (30°90′N and 75°79′E) on a sandy loam soil (Typic Ustipsamment) and Gurdaspur (32°03′N and 75°40′E) on a silt loam soil (Typic Haplustalf). Both sites are located in Indo-Gangetic plains of northwestern India. The Ludhiana accounts for subtropical climate with the annual rainfall of 733 mm, while Gurdaspur accounts for subhumid climate with an annual rainfall of 887 mm. The mean maximum and minimum air temperatures during the experimental periods were 30.8°C and 15.8°C, respectively. At the onset of each experiment, soil samples (0–15 cm depth) of selected sites have the following physicochemical indices: pH 6.7–7.5; EC 0.16–0.23 dS m−1; soil organic carbon 4.2–6.5 g kg−1; KMnO4− extractable N 89–112 kg ha−1; Olsen-P 19.0–21.0 kg ha−1; and 1M ammonium acetate extractable K 88–108 kg ha−1.
Experimental design and crop management
Field experiments were conducted for 4 years at both locations to develop relationships between yield potential of spring maize grain yield and leaf/canopy measurements with LCC, SPAD, and GreenSeeker optical sensor. Each experiment consisted of seven treatments including N application of 0, 40, 80, 120, 160, 200, and 240 kg N ha−1 as prilled urea. The entire quantity of N fertilizer was applied in two equal splits at planting and V4 growth stage. The established relationship between grain yield and leaf/canopy measurements was validated using readings taken from independent experiments conducted simultaneously to test the real-time N management using LCC, SPAD, and NDVI at both locations. The treatments in all experiments were laid out in a randomized complete block design with three replications. Spring maize (Zea mays L.) genotypes DKC-9108 and PMH-10 were the test crops at both locations. A basal dose of 26 kg P ha−1 as [Ca (H2PO4)2], 25 kg K ha−1 (as KCl), and 25 kg Zn ha−1 (as ZnSO4.7H2O) were incorporated at the time of sowing. Spring maize was sown in the second week of February at 60 × 20 cm spaced east-west ridges with a plot size of 8 × 3 m. First irrigation was applied between 25 and 30 DAS and subsequent irrigations as per standard recommendations by flood irrigation (7.5 cm each) (PAU 2017). The crop was harvested manually at maturity. Grain moisture was determined immediately after threshing and drying subsamples in an oven at 65°C for 48 h. Grain yields were adjusted to15% moisture content for reporting.
Plant measurements
The six-panel PAU-LCC developed by Punjab Agricultural University (Ludhiana) was used to measure the leaf greenness. The LCC data were recorded from the middle portion of the topmost fully opened leaf by matching its color with the greenness of LCC panels keeping it under body shade to avoid color variation due to sunlight. A handheld chlorophyll meter (SPAD-502, soil and plant analysis division (SPAD) section, Minolta Co., Osaka, Japan) was used for instant chlorophyll determination by inserting the middle portion of topmost fully expanded leaf in the slit of SPAD meter. LCC and SPAD readings of 15 randomly selected index leaves of normal plants from each plot were averaged.
Reflectance values for calculating NDVI were measured in the RED region (656 nm) and NIR region (774 nm) wavebands using a shoulder-mounted GreenSeeker Model 505 (Ntech Industries, Ukiah, USA), and NDVI was computed as below:
 $${\rm{NDVI}} = {{{\rm{NIR}}-{\rm{RED}}} \over {{\rm{NIR}} + {\rm{RED}}}}$$
where NIR and RED correspond to the fraction of emitted NIR and RED radiation returned back to the sensor from the sensed area, respectively.
The sensor readings were collected by holding the GreenSeeker at a height of about 0.9 m above the crop canopy at a walking speed of 0.5 m s−1. Sensor height from soil increased proportionally as crop growth stage advanced.
Considering four rows per plot, readings were taken from central two rows at 10 days interval starting from 38 to 68 DAS with all the three measuring tools. The readings collected at 38, 48, 58, and 68 DAS correspond to V6, V9, V12, and VT (tasseling) vegetative growth stages of spring maize.
Statistical analysis
The pooled data from both sites and years were used to perform statistical analysis using MS EXCEL (Microsoft Corporation, Redland, USA). Regression analysis using statistical models (polynomial, power, and exponential equations) on pooled data was performed to determine the relationship between spring maize grain yield and the readings of different measuring tools taken at different growth stages. In addition, the concept of growing degree days (GDD) proposed by Raun et al. (Reference Raun, Solie, Johnson, Stone, Mullen, Freeman, Thomason and Lukina2002) to quantify accumulated biomass from the time of sowing to date of sensing was calculated by dividing LCC, SPAD meter, and NDVI readings by the cumulative GDD (CGDD). GDD on daily basis was computed as:
 $${\rm{GDD}} = {{{\rm{Tmax}} + {\rm{Tmin}}} \over 2} - 10^\circ {\rm{C}}$$
where GDD is growing degree days, and Tmax and Tmin denote daily maximum and minimum air temperatures, respectively; 10°C is the basal temperature for spring maize production.
The performance of the prediction model for spring maize was evaluated using linear regression forced through the origin (y = kx) and normalized root mean square error (NRMSE) statistical criteria as:
 $${\rm{NRMSE }}\left( \% \right) = \sqrt {{1 \over n}\sum\nolimits_{i = 1}^n {{{({Y_0} - {Y_p})}^2}} } {{100} \over Y}$$
where Yo, Yp, Y, and n represent observed values, predicted values, mean of observed values, and number of samples, respectively.
The validity of the prediction model was also evaluated based on NRMSE to test the goodness of fit between predicated and observed crop data of independent experiments on spring maize having treatments consisting of different doses of N fertilizer. Based on the agreement given by Loague and Green (Reference Loague and Green1991), NRMSE was considered as excellent (NRMSE<10%), good (10 % < NRMSE < 20%), fair (20% < NRMSE<30%), and poor (NRMSE > 30%).
Results
Grain yield response to N applications
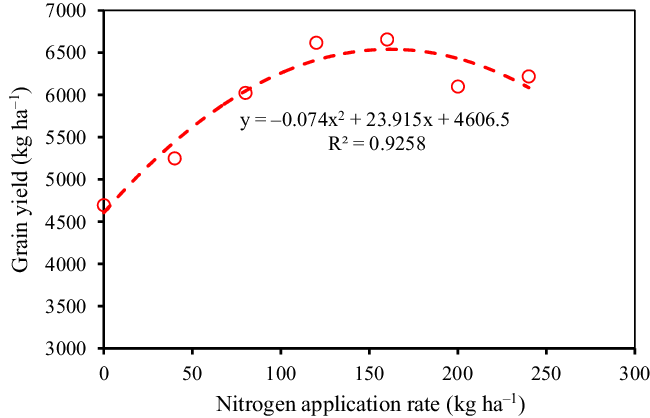
Grain yield was significantly affected by fertilizer N applications in spring maize. The relationship between N fertilization and spring maize grain yield can best be described by second-order polynomial function (Figure 1). The average pooled data of four site years indicated that maximum yield of 6657 kg ha−1 was achieved with 160 kg N ha−1. For attaining 95% of the maximum observed yield, N rate of about 108 kg N ha−1 is desirable. Existing soil test-based N application for spring maize in alluvial plains of northwestern India accounts for 120–150 kg N ha−1 (PAU, 2017) in three equal splits at key growth stages of the crop. It has been noted that application of excessive N application leads to a decline in yield with increased risk of N losses and low N use efficiency (Fageria et al., Reference Fageria, Baligar and Li2008; Singh et al., Reference Singh, Singh and Kaur2020; Varinderpal-Singh et al., Reference Bijay-Singh, Sharma, Jaspreet-Kaur, Mangi, Kent, Yadvinder-Singh, Varinderpal-Singh, Parvesh, Choudhary, Rajeev, Thind, Jagmohan-Singh, Uppal, Harmandeep, Ajay-Kumar, Rajneet, Monika, William and Gupta2011; Zebarth and Rosen, Reference Zebarth and Rosen2007).
Relationship between fertilizer N application rates and average spring maize grain yield.

Predicting spring maize grain yield using LCC, SPAD meter, and NDVI
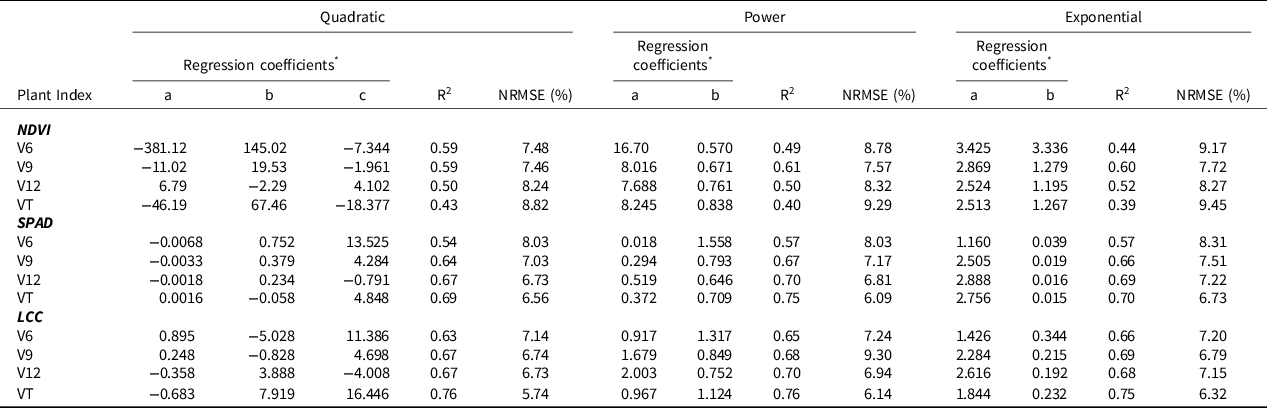
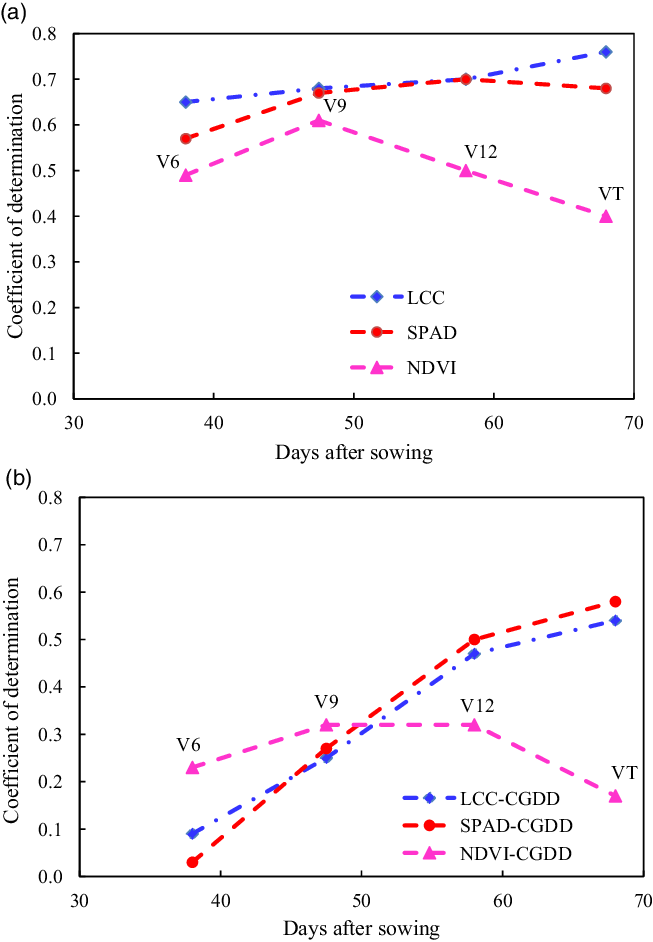
Application of graded levels of N affected above ground parts of the spring maize, which was reflected as increments in LCC, SPAD, and NDVI at different growth stages. Three different statistical models were evaluated to describe the relationship between spectral measurements and grain yield in terms of coefficient of determination (R2). Consistently higher R2 and comparable NRMSE values (<10%) were observed for the relationship derived with power function at different growth stages (Table 1). R2 for the relationships between grain yield and LCC, SPAD meter, and NDVI readings recorded at different growth stages in spring maize are shown in Figure 2a. The regression analysis of the pooled data indicated that LCC, SPAD, and NDVI measurements at V9 stage had improved R2 at maturity as compared to early growth stage (V6). The highest R2 (0.61) between grain yield and NDVI was noticed at V9 stage, which decreased to 0.50 and 0.40 at V12 and VT, respectively. The relationship of grain yield at maturity with SPAD readings and LCC score exhibited R2 of 0.70 at V12 growth stage, which further increased to 0.75 (SPAD) and 0.76 (LCC) at VT growth stage.
Coefficient of determination (R2), normalized root mean square error (NRMSE), and regression coefficients for the relationship between spring maize grain yield and various plant indices recorded at V6, V9, V12, and VT using different regression functions

* Regression coefficients are based on the equations: quadratic: grain yield = a × index value 2 + b × index value + c; power: grain yield = a × index value b; exponential: grain yield = a × expb × index value .
Coefficient of determination (R2) for the relationships between grain yield and (a) LCC, SPAD meter, and NDVI values and (b) CGDD-normalized LCC, SPAD meter, and NDVI values recorded at different growth stages in spring maize.

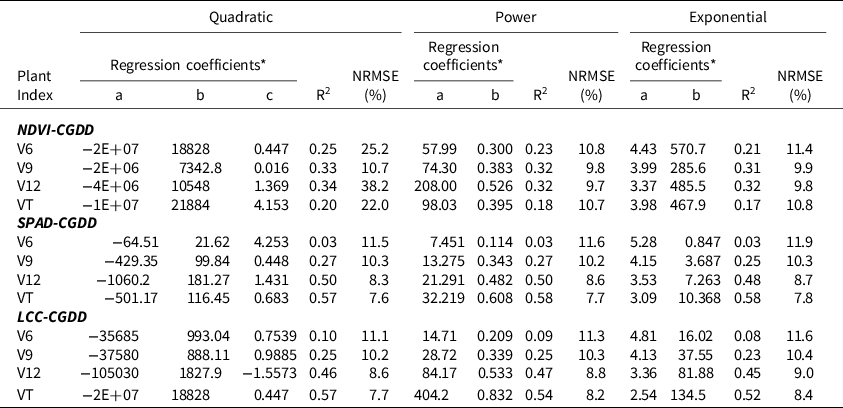
Further improvement in the relationship of tool readings and grain yield may be possible by normalizing LCC, SPAD, and NDVI measurements by an element of biomass, and various NDVI stabilizing methods have been used under diverse environmental conditions (Bijay-Singh et al., Reference Bijay-Singh, Sharma, Jaspreet-Kaur, Mangi, Kent, Yadvinder-Singh, Varinderpal-Singh, Parvesh, Choudhary, Rajeev, Thind, Jagmohan-Singh, Uppal, Harmandeep, Ajay-Kumar, Rajneet, Monika, William and Gupta2011; Teal et al., Reference Teal, Tubana, Girma, Freeman, Arnall, Walsh and Raun2006). In order to improve yield prediction potential across different growing conditions, we used CGDD as a normalizer for LCC, SPAD meter, and NDVI measurements. CGDD-adjusted LCC, SPAD meter, and NDVI measurements showed weak relationship with grain yield at different crop growth stages, and thus no improvement in yield prediction was found (Figure 2b).
Goodness of fit
Using R2 as the sole criteria for selecting the best-fit model may be unrealistic (Mourtzinis et al., Reference Mourtzinis, Arriaga, Balkcom and Ortiz2013). Therefore, models developed using pooled data across four site years were tested using NRMSE to find robustness between predicted and observed grain yield at V6, V9, V12, and VT growth stages (Tables 1 and 2). A smaller value of NRMSE indicates a lesser degree of variation between predicted and observed values. Results of our study indicated that NRMSE for yield prediction from NDVI, SPAD, and LCC measurements taken at different growth stages using different regression models qualify as excellent (Tables 1 and 2). A perusal of data showed a strong relationship (R2) between observed and predicted yields for LCC and SPAD at all growth stages with the highest R2 at VT stage, whereas NDVI better explains grain yield only at V9 growth stage. Adjusting LCC, SPAD, and NDVI by CGDD did not turn out any improvement in NRMSE (Table 2).
Coefficient of determination (R2), normalized root mean square error (NRMSE), and regression coefficients for the relationship between spring maize grain yield and various CGDD-normalized plant indices recorded at V6, V9, V12, and VT using different regression functions

* Regression coefficients are based on the equations: quadratic: grain yield = a × index value 2 + b × index value + c; power: grain yield = a × index value b; exponential: grain yield = a × expb × index value .
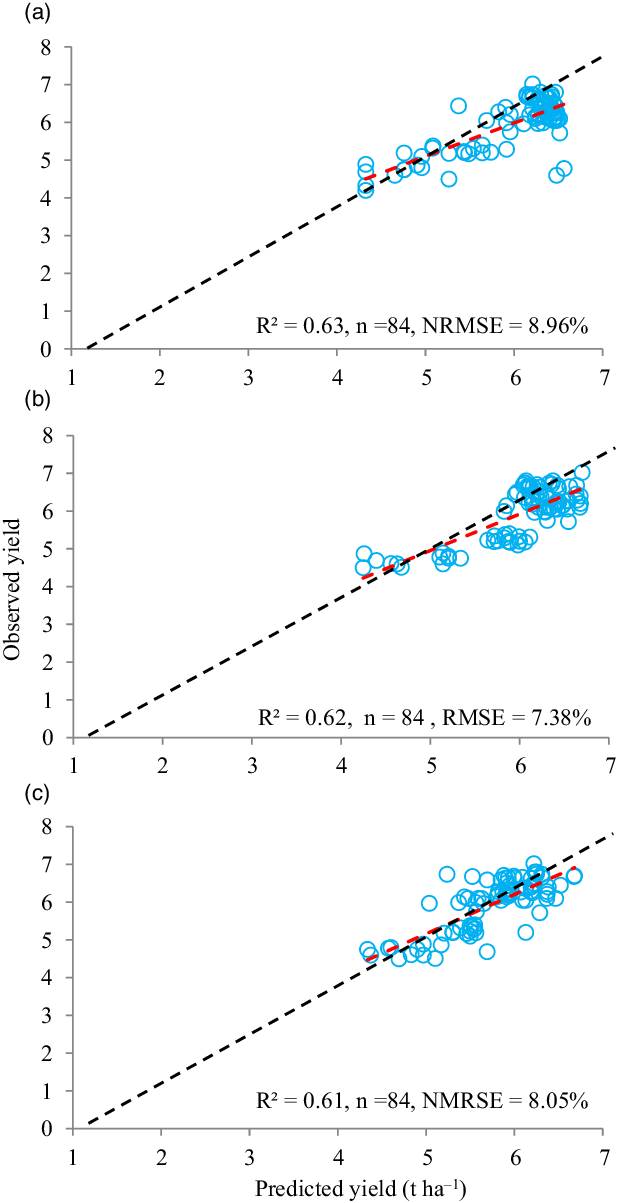
The reliability of regression models for predicting grain yield using LCC, SPAD, and NDVI was evaluated on the separate data set collected from another independent field study on spring maize with variable N doses. NRMSE was used to estimate the extent of agreement between the observed and predicted grain yields (Figure 3). The results indicated that NRMSE for grain yield prediction using LCC and SPAD measurements were 8.96 and 7.38% at VT growth stage, respectively, while for GreenSeeker measurements at V9 growth stage was 8.05%. Plotting predicted grain yield of the best regression models against observed values by fitting linear model on independent data set indicated R2 of 0.63, 0.62, and 0.61 for LCC, SPAD, and GreenSeeker, respectively (Figure 3).
Relationships of observed and predicted grain yield (red line), predicted using LCC (a) and SPAD measured at VT stage (b) and NDVI measured at V9 growth stage in spring maize (c) around the 1:1 line (black line).

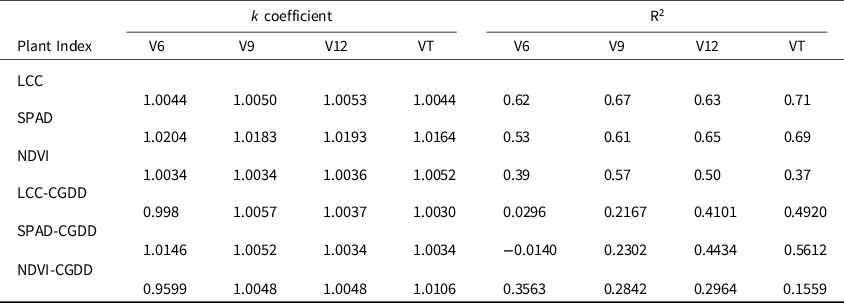
In this study, linear regression was forced through the origin (y = kx) for the best fit between predicted (x) and observed yields (y), and k coefficient values close to 1 are desirable for getting accurate predictable yield. k values for SPAD readings were 1.0204, 1.0183, 1.0193, and 1.0164 and for LCC were 1.0044, 1.005, 1.0053, and 1.0044 at V6, V9, V12, and VT growth stages, respectively (Table 3). k values for NDVI were 1.0034, 1.0034, 1.0036, and 1.0052 at V6, V9, V12, and VT growth stages, respectively. R2 obtained from the non-intercept model for LCC, SPAD meter, and NDVI ranged from 0.62 to 0.71, 0.53 to 0.69, and 0.37 to 0.57, respectively, at different growth stages. Using CGDD for adjusting plant indices, k coefficient related to LCC, SPAD, and NDVI measurements did not present any significant improvement (Table 3). Moreover, contrary to our expectations, the adjusted R2 values of non-intercept model obtained from the relation between predicted and observed grain yield were low at V6, V9, V12, and VT growth stages: 0.0296, 0.2167, 0.4101, and 0.4920 for LCC; −0.0140, 0.2302, 0.4434, and 0.5612 for SPAD meter; and 0.1730, 0.2842, 0.2964, and 0.1559 for NDVI, respectively (Table 3).
k coefficient (y = kx) and R2 for the relationship between predicted and observed grain yield of spring maize for various plant indices recorded at V6, V9, V12, and VT growth stages

Discussion
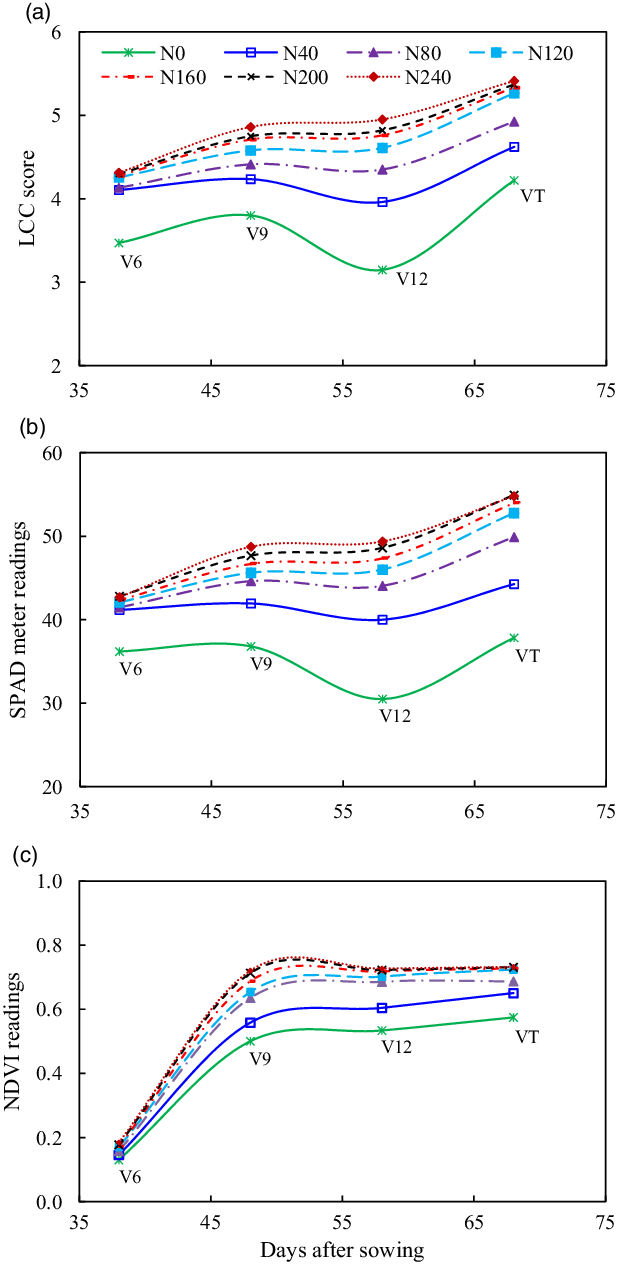
Accurate estimation of yield may guide producers for precision N management to achieve yield goals. Recent studies on maize have shown that spectral data recorded at a specific crop growth stage can reliably predict crop yield. Freeman et al. (Reference Freeman, Arnall, Mullen, Girma, Martin, Teal and Raun2007) found NDVI as the best predictor of maize forage yield and N uptake during V7 to V9 growth stages, and Martin et al. (Reference Martin, Girma, Freeman, Teal, Tubana, Arnall, Chung, Walsh, Solie, Stone and Raun2007) noticed the highest correlation of maize grain and biomass yield with NDVI values from V8 and V12 growth stages. N fertilizer scheduling using LCC and SPAD meter at different growth stages in maize also performed efficiently in producing higher yields with improved N recovery efficiency in maize (Varinderpal-Singh et al., Reference Bijay-Singh, Sharma, Jaspreet-Kaur, Mangi, Kent, Yadvinder-Singh, Varinderpal-Singh, Parvesh, Choudhary, Rajeev, Thind, Jagmohan-Singh, Uppal, Harmandeep, Ajay-Kumar, Rajneet, Monika, William and Gupta2011). The lower correlation values at V6 than V9 growth stage could possibly be due to lower N demand and sufficient N supply to fulfill crop needs, resulting small differences in spectral properties among N treatments. As consequence, this growth stage would be unrealistic to use spectral data for yield prediction. At V6, low biomass per unit area and dominance of the reflectance from exposed soil lead to almost similar NDVI values irrespective of N levels and thus make NDVI measurements unreliable for yield predictions compared to LCC and SPAD (Figure 4). Martin et al. (Reference Martin, Girma, Freeman, Teal, Tubana, Arnall, Chung, Walsh, Solie, Stone and Raun2007) found lower NDVI values during early vegetative growth stages (V3) due to soil reflectance, and Mourtzinis et al. (Reference Mourtzinis, Arriaga, Balkcom and Ortiz2013) reported it is difficult to predict potential yield accurately during early vegetative growth stages as the crop is more susceptible to environmental constrains. The improved relationship between NDVI measurements and grain yield with explainable variability of 61% was only observed at V9. Stronger relationships between NDVI and maize yield were also observed by Raun et al. (Reference Raun, Solie, Stone, Martin, Freeman, Mullen, Zhang, Schepers and Johnson2005), Reference Teal, Tubana, Girma, Freeman, Arnall, Walsh and RaunTeal et al. (2006), and Martin et al. (Reference Martin, Girma, Freeman, Teal, Tubana, Arnall, Chung, Walsh, Solie, Stone and Raun2007) at V8 growth stage, whereas the diminishing relationship between NDVI measurements and final grain yield at later growth stages (V12 and VT) was attributed to canopy closure influence on the sensor field of view (Ali et al., 2017; Sharma et al., Reference Sharma, Bu, Denton and Franzen2015; Teal et al., Reference Teal, Tubana, Girma, Freeman, Arnall, Walsh and Raun2006).
Average LCC score (a), SPAD meter readings (b), and NDVI readings (c) of two spring maize genotypes as influenced by N application rates at different growth stages.

Temperature has been considered as the major factor altering maize growth and developmental processes, like stem elongation, leaf emergence, photosynthesis, flowering, and fruiting (Li et al., Reference Li, He and Zu2010; Singh et al., Reference Singh, Kakani, Brand, Baldwin and Reddy2008; Tollenaar, Reference Tollenaar1989). Usually, adequate temperature enhances the development while low temperature delays. As CGDD estimates the amount of heat accumulated by plant and expresses the plant growth rate in terms of biomass buildup, CGDD-normalized spectral measurements have been used under diverse field and climatic conditions for improving the yield prediction algorithms (Ali et al., Reference Ali, Thind, Sharma and Singh2014; Bijay-Singh et al., Reference Bijay-Singh, Sharma, Jaspreet-Kaur, Mangi, Kent, Yadvinder-Singh, Varinderpal-Singh, Parvesh, Choudhary, Rajeev, Thind, Jagmohan-Singh, Uppal, Harmandeep, Ajay-Kumar, Rajneet, Monika, William and Gupta2011; Raun et al., Reference Raun, Solie, Johnson, Stone, Mullen, Freeman, Thomason and Lukina2002; Teal et al., Reference Teal, Tubana, Girma, Freeman, Arnall, Walsh and Raun2006). The NDVI readings are the product of greenness (red reflectance) and biomass (NIR reflectance), whereas tools like LCC and SPAD meter measures the leaf greenness unrelated to changes in biomass. It is therefore hypothesized that adjusting the LCC and SPAD readings with CGDD may account for both aboveground biomass and leaf color greenness at different growth stages. Evaluating the CGDD-adjusted LCC, SPAD, and NDVI for better yield prediction in regression analysis showed weaker relationships and higher NRMSE when compared to non-normalized data (Table 2). Payero (Reference Payero2017) also reported that CGDD is not always an accurate description of maize growth as it is based on the assumption of the linear relationship between temperature and plant growth (Ritchie and NeSmith, Reference Ritchie and NeSmith1991; Stinner et al., Reference Stinner, Gutierrez and Butler1974). The results of field studies by Teal et al. (Reference Teal, Tubana, Girma, Freeman, Arnall, Walsh and Raun2006) in maize, Harrel et al. (Reference Harrell, Tubana, Walker and Phillips2011) in rice, and Ali et al. (Reference Ali, Thind, Sharma and Singh2014) in direct-seeded rice also reported no improvement in crop yield potential with CGDD-normalized NDVI. The k coefficient values obtained from the non-intercept model were almost the same at all sensing stages for all three tools. For instance, k coefficient values of 1.0044 at V6 and VT in LCC, and 1.0034 at V6 and V9 in NDVI were the same (Table 3). However, R2 between LCC and grain yield improved from 0.62 (V6) to 0.71 (VT) and similarly for NDVI from 0.37 (VT) to 0.57 (V9), indicating k coefficient as an unrealistic indicator of the accurate yield prediction. Insignificant differences in k coefficient values of CGDD-adjusted and non-adjusted LCC, SPAD, and NDVI were found (Table 3), while lower R2 values of CGDD-adjusted LCC, SPAD, and NDVI over the original LCC, SPAD, and NDVI values further confirmed previous conclusion about k as a measure of accuracy.
In validation trials, the results showed that GreenSeeker optical sensor can better predict grain yield at V9 stage by explaining 61% variability, whereas LCC and SPAD explained 63 and 62% at VT stage, respectively. These results indicated that NDVI, LCC, and SPAD are efficient in predicting grain yield and in-season N demand of spring maize reliably.
Conclusions
The sensing timing is of great importance for accurate in-season grain yield prediction while using GreenSeeker optical sensor. Improved grain yield prediction using NDVI data can be achieved only at V9 growth stage because of negligible differences in NDVI attributed to low biomass and dominance of soil reflectance at early growth stages and canopy closure at later growth stages. The leaf greenness or chlorophyll index measured with either LCC or SPAD meter is independent of these limitations throughout crop growth and predicts in-season yield more reliably at VT growth stage. Adjusting LCC, SPAD, and NDVI measurements by incorporating CGDD may not be useful in improving maize yield prediction.