I. INTRODUCTION
Since a possibility to form bulk metallic glasses (BMGs) by copper mold casting was discovered in the early 1990s, these materials have attracted a lot of attention because of their superior properties and promising functional and structural applications.Reference Greer1–Reference Zhang, Inoue and Masumoto4 To further optimize the mechanical properties of the BMGs, extensive researches have been focused on metallic glass composites reinforced by either nanocrystals or distributed dendrites.Reference Zhang and Men5–Reference Yavari, Lewandowski and Eckert7 Meanwhile, since BMGs can be used as the materials of micro gears,Reference Inoue and Nishiyama8 molds,Reference Kumar, Tang and Schroers9 medical devices,Reference Zberg, Uggowitzer and Löffler10 and electronic device covers, their surface properties, such as friction, corrosion resistance, and wetting, also play an important role. Laser surface melting (LSM) can be a surface modification technique since the high energy density characteristic of a laser makes rapid heating and cooling possible. The cooling rate in the LSM process with a fast scanning speed can achieve 10Reference Zhang and Men5–10Reference Inoue and Nishiyama8 K/s, much higher than the critical cooling rates of BMGs,Reference Audebert, Colaco, Vilar and Sirkin11, Reference Inoue12 which makes it possible to synthesize metallic glass through laser melting or powder cladding on the crystalline substrate.Reference Audebert, Colaco, Vilar and Sirkin11, Reference Wu, Xu and Hong13, Reference Yue, Su and Yang14 In our recent work, we found that, by laser melting the surface of bulk glass-forming alloys, a transitional zone with amorphous–crystalline composite structures can be obtained between the amorphous surface layer and the crystalline substrate, which comprise a gradient structure. The microstructure evolution in the alloy surface caused by LSM may influence surface properties including friction behavior and wear performance of the treated alloy, as the optimized tribological properties of gradient structure reported previously.Reference Jiang, Jiang, Li, Li, Yin and Zheng15
Because of high hardness, high fracture toughness, and structural uniformity, metallic glasses are expected to possess greater wear resistance than conventional crystalline engineering metals and alloys. However, since the tribological performance is not an intrinsic property and the testing devices and conditions are different, the investigations of the friction and wear behaviors of BMGs produced conflicting results.Reference Fu, Kasai, Falk and Rigney16, Reference Parlar, Bakkal and Shih17 BlauReference Blau18 showed that the tribological behaviors of metallic glasses were comparable with or even worse than those of stainless steel and pure Ni in dry and oil-lubricated conditions, respectively. Matthews et al.Reference Matthews, Ocelík and de Hosson19 reported that the Cu47Ti33Zr11Ni6Sn2Si1 amorphous layer exhibited a lower friction coefficient and higher wear loss than the corresponding crystalline material. When evaluated by scratch test, the metallic glass also exhibited a lower friction coefficient.Reference Matthews, Ocelík and de Hosson20 Several BMGs were investigated in Fleury et al.’sReference Fleury, Lee, Ahn, Kim and Kim21 research and exhibited rather similar friction behaviors but significant differences in the wear performance. The mechanism of the friction process should be further studied and the friction and wear behaviors of BMGs and their composites should be investigated for better understanding the relationship between the tribological performance and microstructure.
In this work, a gradient structure (including amorphous surface, amorphous–crystalline composite transitional layers, and crystalline substrate) was formed by LSM method on the surface of Zr55Al10Ni5Cu30 alloy. To reveal the formation mechanism of the gradient structure, finite volume simulation of the thermal effects during the laser process is performed. The composite layer consisting of nanocrystals with amorphous matrix exhibits a lower friction coefficient compared to those of the other layers. The transitional layer comprising dendrites and amorphous phase presents the best wear resistance among the structures studied here, evaluated by sliding tests. The tribological mechanisms were discussed.
II. EXPERIMENTAL
Alloy ingots with a nominal composition of Zr55Al10Ni5Cu30 (at.%) were prepared by arc melting the mixture of the pure metals in a Ti-gettered high purified Ar atmosphere. During the melting process, the ingots were turned over and remelted four times to ensure chemical and microstructural homogeneity. Rectangular plates (10 × 10 mm2) with 2 mm in thickness were machined from the ingots, and the surfaces were polished to 2000 grit. Laser melting treatment on the surfaces of the alloy plates as the substrates was carried out using a 180-W neodymium-doped yttrium aluminium garnet (Nd:YAG) laser at a beam scanning speed of 1200 mm/min with the focused beam (diameter = 1 mm), laser working voltage of 150 V and laser frequency of 7 Hz. During the laser process, an Ar flow was applied to prevent surface oxidation. The melting spot was about 1 mm in diameter, and ∼50% of the area was overlapped with the neighboring tracks (spots). The structures of the treated alloy were examined by x-ray diffraction (XRD) (Bruker D8 Advance; Bruker, Karlsruhe, Germany), scanning electron microscopy (SEM) (CS-3400), and high-resolution transmission electron microscopy (HRTEM) (JEOL-2100F; JEOL Ltd., Tokyo, Japan). The various layers from the top surface to the crystalline substrate subjected to the XRD examinations in the plane view were obtained by mechanical polishing the top surface to a certain depth. The samples were polished in one direction and then turned 90 ° when the previous grinding marks disappeared. The grinding processes were carried out alternately in this way to avert the declivity. Fine grinding materials, small pressure force, and low grinding rates are applied to avoid the surface work hardening. The spot size of the XRD used here was 2*10 mm and the penetration depth of x-ray for Zr55Al10Ni5Cu30 (at.%) alloy was less than 15 μm. The cross section of the treated alloy was observed by SEM. For transmission electron microscopy (TEM) observation, thin plates acquired from the top surface layer and the crystalline substrate, as well as the transitional layers between them, were mechanically ground to ∼80 μm in thickness and then electropolished to perforation with a 25% HNO3–methanol solution at about 243 K.
A Nanoindenter XP was used to measure the microhardness (H) and reduced Young’s modulus (E r) of the top surface, transitional layers, and crystalline substrate with a Berkovich indenter. The samples for the nanoindentation tests were precisely polished to a mirror-like surface. The load was 300 mN and at least 10 indents were performed on each layer. The maximum indentation depth for measuring H and E r was smaller than 1/20 of the thickness of each examined layer.
Using a Universal Micro-Tribotester (UMT2) with Si3N4 spheres 4 mm in diameter as the counter materials, ball-on-disc linear reciprocating wear (sliding) experiments were conducted on the samples of different structures on the surface, which were all polished to 2000 grit. To investigate the tribological properties of different layers, the LSM-treated samples were polished off different thickness to reach different layers and then the layers were tested in plan view. A normal load of 1 N, sliding track length of 4 mm, experiment duration of 30 min, and frequency of 4 Hz were selected as the operating parameters, and the experiments for each layer were repeated at least five times for obtaining reliable statistics. The wear surfaces of the samples and the counter balls were observed by SEM with energy dispersive x-ray spectrometry (EDS). A Phase Shift MicroXAm-3D optical interferometer was used to calculate the wear losses of different samples and the roughness of the surfaces before wear test.
III. RESULTS
A. Microstructure characterization
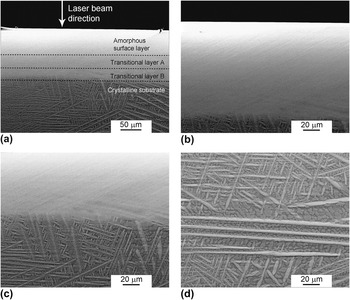
During the LSM treatment, the alloy surface experiences intensive heating up to a temperature higher than the alloy’s melting point and then rapid quenching through thermal conduction and convection, which can cause microstructure evolution along the laser incident direction. The cross-section morphology of the LSM-treated Zr55Al10Ni5Cu30 alloy is shown in Fig. 1. Figure 1(a) indicates that the remelted zone and the crystalline substrate can be distinguished and the thickness of the remelted zone is ∼120 μm. The upper part of the remelted zone exhibits a featureless morphology, whereas in the nether part with a thickness about 20 μm, needle-like crystals can be observed [Figs. 1(b) and 1(c)]. The crystalline substrate consists of long needle-like crystals and dendrites, which disappear at the border of the remelted zone [Figs. 1(c) and 1(d)].
(a) Scanning electron microscopy (SEM) images of the cross section of the laser surface melting (LSM)-treated Zr55Al10Ni5Cu30 alloy. (b) The remelted region, (c) the border of the remelted zone and crystalline substrate, and (d) the crystalline substrate. The schematic division of different layers is marked by dash lines in (a) for easy inspection.

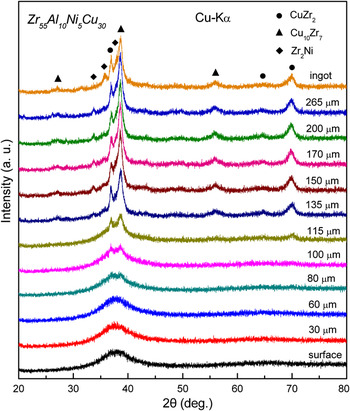
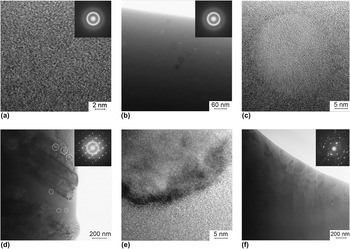
The microstructure evolution of the Zr55Al10Ni5Cu30 alloy after the LSM was further studied by XRD and TEM. The top surface of the LSM-treated alloy was firstly examined by XRD. Then by careful polishing, the top layer was removed and the structures of various layers with different depth from the top surface were also investigated by XRD in the plane view. The XRD patterns of the top surface, the crystalline substrate, and the transitional zone between them are presented in Fig. 2. It is seen that from the top surface down to the position of 60-μm deep, no peak corresponding to crystalline structures is detected. When the locations are 80- to 100-μm deep from the top surface, the XRD patterns show a broad diffraction peak and two weak Bragg peaks, indicating the presence of primary nucleated crystals of a small size and a low volume fraction, which are hardly observed in the SEM images shown in Fig. 1. When the depth is 115 μm, strong peaks corresponding to developed crystallites can be observed, which implies the development of coarse crystalline phases in the border region of the remelted zone of ∼120-μm deep from the top surface observed in Fig. 1. The crystalline phases are CuZr2, Cu10Zr7, and Zr2Ni intermetallics with solid solution of Al,Reference Yavari, Le Moulec, Botta F., Inoue, Rejmankova and Kvick22, Reference Tariq, Hasan and Akhter23 and the CuZr2 and Cu10Zr7 are the primary crystalline phases judged from the patterns taken at 80- to 100-μm deep. Figure 3(a) is the HRTEM image of the sample acquired from the region of 0- to 60-μm deep from the top surface, which does not reveal the existence of any crystallites. The corresponding selected-area electron diffraction (SAED) consists only of halo rings. These results confirm the amorphous structure of this region. In the sample acquired from the region 60- to 100-μm deep, spherical crystallites with a size of 10–40 nm are embedded in the amorphous matrix, as shown in the TEM image and the SAED pattern in Fig. 3(b). The nanocrystalline phase is determined to be CuZr2 according to the SAED and XRD patterns. The HRTEM image of this layer is shown in Fig. 3(c), in which a crystallite embedded in amorphous matrix and the interface between the crystal and the matrix can be observed. The TEM image and SAED pattern in Fig. 3(d) indicate that the sample taken from the region of 100- to 120-μm deep also exhibits a composite structure though the fraction of amorphous phase is much smaller and the dimensions of the crystallites are larger. In this region, the crystallites include the relatively larger needle-like crystals, undeveloped dendrites (marked by big white circles), and fine spherical crystals (marked by small white circles), which are similar to those observed in Fig. 3(b). The SAED pattern reveals the existence of the CuZr2 intermetallic and amorphous phases. HRTEM image in Fig. 3(e) shows the interface between the needle-like dendrite and the amorphous phase. No amorphous phase is indicated in the TEM image, and SAED pattern of the substrate, which is shown in Fig. 3(f), confirms that the substrate is crystalline.
X-ray diffraction patterns for the LSM-treated Zr55Al10Ni5Cu30 alloy at positions of different depths from the surface.

(a) High-resolution transmission electron microscopy (HRTEM) image and selected-area electron diffraction (SAED) pattern (inset) of the amorphous top surface; (b) bright-field image and SAED pattern of the transitional layer A; (c) HRTEM image of a nanocrystallite embedded in amorphous matrix in transitional layer A; (d) bright-field image and SAED pattern of the transitional layer B; (e) HRTEM image of the interface between the dendrite and the amorphous phase; and (f) bright-field image and SAED pattern of the substrate.

Based on these experimental results, it is concluded that the LSM treatment on the Zr55Al10Ni5Cu30 alloy can lead to the formation of a gradient structure composed of three distinct zones: a top amorphous layer, a transitional composite zone, and a crystalline substrate. The transitional composite zone can be further divided into two layers: transitional layer A, which is in the range of 60- to 100-μm deep from the top surface, showing a microstructure of nanocrystal-reinforced amorphous matrix, and transitional layer B, which is in the range of 100- to 120-μm deep and is adjacent to the crystalline substrate, mainly consisting of well-developed crystalline phases and minor amorphous phase. The schematic division of different layers is marked by dash lines in Fig. 1(a) for easy inspection.
B. Mechanical properties and tribological behaviors
The microhardness (H), reduced Young’s modulus (E r), and the H/E r ratios of different layers in the LSM Zr55Al10Ni5Cu30 alloy are listed in Table I. The samples of different layers were obtained by polishing off corresponding thickness from the top surface. For the LSM-treated alloy, an increase in depth below the top surface leads to an increase in H and a decrease in E r, except for the crystalline substrate, which exhibits the lowest H and highest E r. It is interesting that E r of the amorphous and the partially crystallized layers decreases with the increase in the percentage of crystallites, which exhibits reverse changing trend comparing to that in thermal crystallized metallic glasses.Reference Li, Hao, Tan and Wang24 The H/E r ratio decreases in the order of: transitional layer B, transitional layer A, amorphous surface, and crystalline substrate.
Roughness; microhardness; reduced Young’s modulus; H/E r; friction coefficients; and scar depths and widths for different layers in the laser surface melting-treated Zr55Al10Ni5Cu30 alloy.

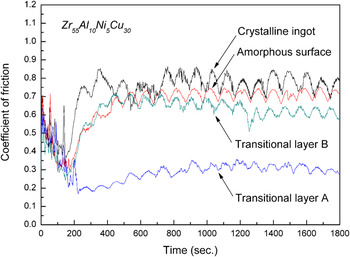
Ball-on-disc sliding tests have been conducted on the LSM-treated top surface, transitional layers, and the crystalline substrate in air at room temperature. Surface roughness (R a, the center line average value) of the samples preparing for tribological tests is shown in Table I. Though the amorphous surface layer shows higher roughness than the other samples, the R a is within the scale of 150 nm, which is far below the depth of wear scar (>3 μm). For the amorphous top surface, the initial average Hertzian stress and the contact radium between the counter material and the sample is about 491 MPa and 25 μm, respectively, according to the sliding test parameters, the modulus shown in Table I, and Poisson’s ratio (Y. Li, R. Li, and T. Zhang, unpublished data) of Zr55Al10Ni5Cu30 amorphous alloy. Similarly, for the other layers, the initial average Hertzian stresses and the contact radii are approximately calculated to be in the range of 471–545 MPa and 24–26 μm, respectively. Representative friction coefficient curves of the amorphous surface, transitional layers A and B, and crystalline substrate are shown in Fig. 4. After the bumps in the first 200 s, the friction coefficients reach a stable stage, in which the fluctuations were caused by the signal influence of the UMT equipment. As summarized in Table I, the amorphous surface, transitional layer B, and crystalline substrate have comparable friction coefficients in the range of 0.65–0.78 and that of transitional layer B is the lowest. It is notable that coefficient of friction (0.3) of the transitional layer A is ∼2.5 times lower than those of the other layers. The results indicate that in the gradient structure, the layer of in-situ nanocrystal–amorphous matrix composite structure has the lowest friction coefficient.
Friction coefficient curves of the amorphous top surface, transitional layers A and B, and the crystalline substrate.

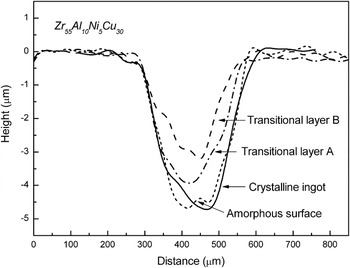
To compare the wear resistance of different layers, cross-section profiles of the wear scars on the sample surfaces after the sliding tests are characterized by the optical interferometer, as shown in Fig. 5. In this work, depths of the wear scars listed in Table I are used to evaluate the wear loss. It is seen that the transitional layer B has the smallest scar depth and thus has the highest wear resistance among all the layers. The transitional layer A with a lower friction coefficient exhibits better wear resistance than the amorphous layer and the crystalline substrate.
Profiles of the wear scars on the amorphous top surface, transitional layers A and B, and the crystalline substrate.

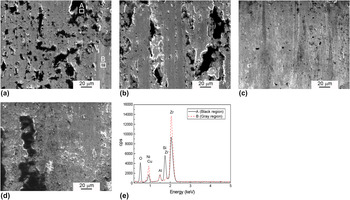
Figure 6 shows the SEM micrographs of the wear scars on the sample surfaces after the sliding tests. The morphology of the scars indicates that some wear debris (marked by letter A) adheres to the wear scars. The phenomenon is obvious for the crystalline substrate with distinct black block-like islands adhered to the contact surface as shown in Fig. 6(a). The result of EDS [Fig. 6(e)] indicates that these black debris possesses higher Si (5.00 at.%) and O (63.58 at.%) contents than the gray regions (marked by letter B). Si was mainly transferred from the Si3N4 counter material, and the presence of O in the black regions indicates the occurrence of oxidation during the sliding process. Since the experiments were performed in air, oxides could be generated from the chemically active elements Zr and Cu.Reference Fu, Kasai, Falk and Rigney16 A similar scar morphology can be observed on the amorphous surface layer and the transitional layer B [Figs. 6(b) and 6(d)]. In contrast, the contact surface of the transitional layer A is relatively smooth and exhibits no obvious bulk block bumps but only fine dark spots on the surface [Fig. 6(c)]. These results may illustrate the low friction behavior of the transitional layer A, which is a nanocrystal-reinforced amorphous matrix structure.
SEM images of the wear scars on (a) the crystalline substrate, (b) the amorphous top surface, (c) transitional layer A, and (d) transitional layer B. Energy dispersive x-ray spectrometry (EDS) analysis is presented in (e).

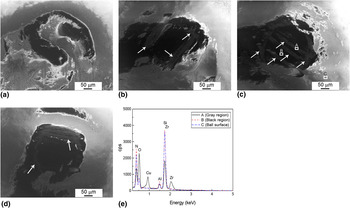
Wear scars of about 300 μm in dimension present on the contact surfaces of the counter materials (φ 4-mm Si3N4 ball) of all the samples are shown in Fig. 7. Wear debris which exhibits gray color could be found on the scars and is marked by white arrows in Figs. 7(b)–7(d). The tribosinterized wear debris can form a transfer film on the contact surface of counter material. In Fig. 7(c), three typical different positions are chosen for an EDS investigation (marked by letters A, B, and C, respectively): position A, wear debris with gray color; position B, wear scar with black color; and position C, Si3N4 ball surface without wear. EDS analysis [Fig. 7(e)] indicates that the wear debris (position A) contains Zr (1.09 at.%), Cu (3.30 at.%), and high percentage of O (51.98 at.%). It means that during the sliding, Zr and Cu were oxidized and some of the oxides as wear debris transferred from the sample surface to the counter material. Positions B and C show the similar compositions with Si3N4 (Al is from the ball holder). It is notable that on the Si3N4 ball of the transitional layer A, the Zr- and Cu-rich wear debris observed are more than the other layers while the wear scar on the ball of the crystalline substrate has hardly any indication of material transfer. SEM and EDS analyses indicate that, during the sliding process, Zr and Cu oxides transferred from the sample surface to the Si3N4 ball surface while some of the debris reserved and some detached from the wear scars, which may thus serve to promote “third body” abrasion during the sliding wear.Reference Wang, Nie, Housden, Spain, Jiang, Meletis, Leyland and Mattews25 Therefore, abrasive wear, adhesive wear, and oxidative wear may simultaneously happen during the sliding.
SEM images of the wear scars on the Si3N4 balls for (a) the crystalline substrate, (b) the amorphous top surface, (c) transitional layer A, and (d) transitional layer B. EDS analysis is presented in (e).

IV. DISCUSSION
A. Formation of the gradient structure
The cooling rate during the LSM treatment can be in the order of 105–108 K/s, which is much higher than the critical cooling rates of metallic glasses with high glass-forming ability (GFA). It has been reported that, utilizing the intensive heating and rapid cooling advantages of the laser treatment, metallic glasses can be welded without crystallization.Reference Kim, Lee, Lee, Sun, Shin and Bae26, Reference Li, Li, Xiong, Xing, Wang and Li27 Similarly, the formation of an amorphous surface layer on a crystalline substrate with high GFA can be achieved either by remelting or by powder cladding.Reference Audebert, Colaco, Vilar and Sirkin11, Reference Wu, Xu and Hong13, Reference Yue, Su and Yang14 In this work, the Zr55Al10Ni5Cu30 alloy with a gradient structure distributed in the sequence of amorphous, nanocrystal–amorphous, and dendrite–amorphous composites and crystalline structures from the top surface to the substrate can be synthesized by LSM. The formation of the structure gradient is directly correlated with heating peak temperature and heating and cooling rates of the target sample during the LSM. However, measurement of these parameters is far beyond the capabilities of a conventional pyrometer. For revealing the formation mechanism of the gradient structure, the finite volume method is used to simulate the process of LSM treatment. At the surface of a material, the heat balance between the laser power absorbed by the sample and the radiation losses is given by the following equationReference Basu, Samant, Harimkar, Dutta Majumdar, Manna and Dahotre28:

with δ = 1 for 0 ≤ t ≤ t p;
δ = 0 for t ≥ t p;
where A is absorptivity (0.7),Reference Lei, Murakawa, Shi and Li29 I is laser power intensity, ε is emissivity for thermal radiation, tp is irradiation time, T 0 is ambient temperature (298 K), and σ is the Stefan–Boltzmann constant (5.67 × 10⁻⁸ W/m2 K4). The convective boundary condition at the bottom surface of the sample is given byReference Basu, Samant, Harimkar, Dutta Majumdar, Manna and Dahotre28:

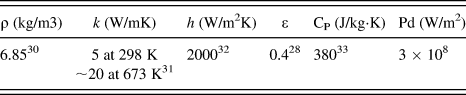
where h is the convective heat transfer coefficient, k is the thermal conductivity, and L is the thickness of the rectangular specimen (2 mm in the present work). The other surfaces are considered thermally insulated. The laser parameters and relevant physical and thermal properties of the material are listed in Table II.
Physical and thermal properties of Zr55Al10Ni5Cu30 glassy alloy used in finite volume simulation in Eq. (1).

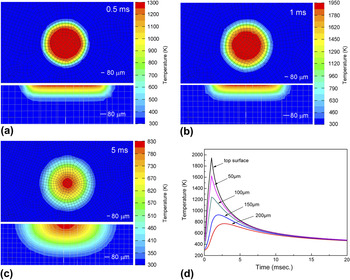
The model considers melting of a homogeneous surface layer and a single laser pulse is used. Heat transfers via conduction, convection, and thermal radiation. The acting time t p of a laser pulse is chosen to be 1 ms, and three different timing scenes are investigated (at 0.5, 1, and 5 ms), which correspond to the stages of heating, heating finish, and cooling, respectively. The temperature distributions and heating/cooling profiles at the top surface and at positions of different depths from the top surface are presented in Fig. 8. Figures 8(a)–8(c) show the temperature distributions on the top surface and in the cross section of the LSM Zr55Al10Ni5Cu30 alloy at the time of 0.5, 1, and 5 ms, respectively. After a pulse is initiated, the peak temperature of the top surface reaches 1950 K after heating of 1 ms, whereas at 0.5 and 5 ms, the peak temperatures are 1300 and 830 K, respectively. Since the heating duration is extremely short from 0.5 to 1 ms, the laser energy transferred into the sample leads to a increase in temperature from 1300 to 1950 K on the top surface, but the heat-affected volume in depth direction does not obviously expand in this quite short time interval. As seen from the cross-section patterns in Figs. 8(b) and 8(c), the thickness of the heat-affected zone is 250 μm at 1 ms; when a single pulse is finished, it increases to 550 μm at 5 ms. The heating/cooling profiles of layers at different depths are presented in Fig. 8(d). It is seen that, at the time of 10 ms, the temperature has already decreased far below the glass transition temperature (T g) of the Zr55Al10Ni5Cu30 alloy (685 K),Reference Luo, Duan, Ma, Pang and Zhang34 which means the cooling rate is in the order of 105 K/s. The top surface experiences the highest peak temperature and the highest heating/cooling rate, and those of the other layers gradually decrease along the depth. The peak temperature of the 100-μm-deep layer is about 1250 K, which is high enough to melt the alloy, whereas the 150-μm-deep layer with the peak temperature of about 930 K cannot be heated up to melting. It is concluded that the thickness of the remelted zone is slightly larger than 100 μm, which agrees well with the SEM observations shown in Fig. 2, though the observed remelting zone is a little thicker because of the thermal interaction with the neighboring laser spots.Reference Kim, Lee, Shin and Lee35 Though the layer of 100-μm deep can be melted by the laser and the cooling rate is high enough for the formation of the amorphous structure, the effects of nonuniform melting and heterogeneous nucleation cannot be ignored. The transitional layer B is located at 100- to 120-μm deep from the top surface, and the peak temperature in this region could be between the liquidus temperature (1156 K) and solidus temperature (1095 K)Reference Luo, Duan, Ma, Pang and Zhang34 according to the simulation results. Therefore, this region cannot be completely melted during the LSM. The eutectic compositional phases of the alloy with lower melting temperature could be melted, whereas the hypoeutectic or hypereutectic solid phases including intermetallics with higher liquidus temperatures were reserved. The melted eutectic phase was rapidly quenched to form the amorphous structure. The unmelted solid phases which were broken and stirred by the heat current are distributed in the amorphous matrix. The crystalline phases in the transitional layer B show features of coarser needle-like dendrites similar to that of the crystalline substrate observed by TEM, which further confirms the inheritance of the substrate. In translational layer A, though the peak temperature is higher than liquidus temperature of the alloy, the heating duration is limited (1 ms). The phases with higher liquidus temperatures as discussed above could not be melted completely and transitorily remain in the liquid phase. These residual infusible tiny cells can be the nucleus of heterogeneous nucleation and nanocrystals with 10–40 nm in diameter distributed in the amorphous matrix were formed, as observed in Fig. 3(b). As a result, the LSM-treated Zr55Al10Ni5Cu30 alloy exhibits gradient microstructure distributed in the sequence of the amorphous structure, nanocrystal-reinforced amorphous matrix composite (transitional layer A), dendrites–amorphous phase composite (transitional layer B), and crystalline phases from the top surface to the substrate.
Finite volume simulation results including the temperature distributions on the top surface and the cross section of the LSM-treated Zr55Al10Ni5Cu30 alloy at (a) 0.5 ms, (b) 1 ms, and (c) 5ms and (d) the temperature profiles of different layers.

B. Frictional and wear characteristics
The present experimental results indicate that the transitional layer A of nanocrystal-reinforced amorphous matrix composite structure exhibits a lower friction coefficient than the other layers. It has been reported that the friction coefficients of well-relaxed metallic glasses were lower than that of as-cast and crystallized samples, and a partially crystallized metallic glass had a lower friction coefficient than the corresponding fully amorphous material, but the differences were minor.Reference Maddala, Mubarok and Hebert36, Reference Bhatt, Kumar, Dong and Murty37 In this work, since the transitional layer A was affected by the heat flow from the upper zone in the process of thermal conduction, the relaxation of the amorphous matrix may occur. Because of the precipitation of the hard nanocrystalline particles of a spherical shape and the relaxation of the amorphous matrix, the transitional layer A exhibited higher microhardness and a more brittle behavior than the amorphous surface. It can be seen from Fig. 4 that, after the rapid decrease in friction coefficient in the beginning period, the transitional layer A exhibits a stable low friction behavior. It is suggested that the decrease in friction forces during the beginning period is due to the formation of the wear scar and debris after the collisions between the counter material and the sample. The hard and brittle debris including spherical crystalline particles in nanoscale can perform as the rolling element between the counter material and wear surface, and the microbearing effect is applied.Reference Vilt, Martin, McCabe and Jennings38 Introducing a rolling element between two contacting surfaces can significantly reduce the coefficient of friction since the rolling forces are 102–103 times lower than those of sliding.Reference Braun and Tosatti39 Therefore, the nanoscale crystalline spheres precipitated in transitional layer A could contribute to the rolling mechanism and the low friction behavior. In the transitional layer B, the microbearing effect cannot work because the crystalline phases are needle-like crystals and dendrites, which can hardly perform the rolling motion. Meanwhile, well-bound needles and dendrites cannot easily spall from the matrix. As a result, the transitional layer B possesses a relatively higher friction coefficient in comparison to transitional layer A. The amorphous surface also exhibits high friction coefficient since more free volume was involved during the laser treatment with higher cooling rate. The ductile amorphous surface with more free volume can generate high friction forces and multiple shear bands appear during the sliding.Reference Matthews, Ocelík and de Hosson20, Reference Liu, Zhu, Luo and Liu40 The low friction coefficient of the transitional layer A is also related to the material transfer and the formation of a transfer film on the counter material surface. From Figs. 6 and 7, the samples with various microstructures exhibit different material transfer phenomena. The main material transfer of the crystalline substrate and transitional layer A shows inverse single direction, which is ball to sample for the crystalline and sample to ball for the transitional layer A. The amorphous layer and transitional layer B exhibit a bidirectional material transfer. The Si3N4 ball for the transitional layer A possesses a larger and more uniform transfer film formed during the sliding than those for the other layers, which therefore protects the surfaces better against wear. The formation of the tribosinterized film permits easy shear within the interfacial materials and friction coefficient controlling.Reference Donnet, Belin, Auge, Martin, Grill and Patel41, Reference Pei, Galvan and De Hosson42 As analyzed by EDS, the wear debris on the counter balls is mainly composed of Zr and Cu oxides. The tribosinterized Zr and Cu oxides (especially CuO) can work as lubricant and so that effectively reduce the coefficient of friction.Reference Hernandez Battez, Viesca, Gonzalez, Blanco, Asedegbega and Osorio43, Reference Hernandez Battez, Gonzalez, Viesca, Fernandez, Diaz Fernandez, Machado, Chou and Riba44
The results of the present work indicate that oxidization and material transfer between the counter balls and the samples occurred in the sliding process. During the material transfer, some of the debris adhered and some detached from the wear scars. The wear mechanism appears to be a combination of adhesive wear, abrasive wear, and oxidative wear. Recent studies showed that a higher ratio of hardness to reduced Young’s modulus (H/E r) was indicative of better wear resistance in a disparate range of materials.Reference Leyland and Matthews45, Reference Leyland and Matthews46 Leyland and MatthewsReference Leyland and Matthews46 proposed that rather than increasing hardness, reducing the elastic modulus can be beneficial to the wear resistance for tribological coatings. As listed in Table I, the transitional layer B shows the highest H/E r ratio and the rest three layers follows the subsequence as transitional layer A > amorphous surface layer > crystalline substrate. As shown in Fig. 5, the transitional layer B has the smallest scar depth, which means the largest H/E r ratio corresponds to the least wear loss and the wear resistance of the layers accords well with the H/E r ratio principle. For the amorphous layer, the H/E r ratio is relatively high with respect to its wear scar depth, probably because that deviation exists in the approximate evaluation of the wear loss by the wear scar depth. In general, the H/E r ratio is an effective indicator for valuing the wear resistance in this work.
V. CONCLUSIONS
By laser remelting the surface of Zr55Al10Ni5Cu30 (at.%) alloy with high GFA, an amorphous layer can be obtained due to the super high heating/cooling rates involved in the process. Between the amorphous surface and the crystalline substrate, transition layers of amorphous–crystalline composite structures were formed, comprising a gradient structure. The process of laser surface treatment is simulated using finite volume method. Physical arguments are proposed to explain the formation mechanism of the gradient structure based on the experimental and simulation results. During the ball-on-disc sliding test, the transitional layer with nanocrystal-reinforced amorphous matrix structure exhibited a lower friction coefficient than the other layers, which was mainly due to the rolling element effect of the spherical nanocrystals precipitated in the amorphous matrix and the formation of an oxides-containing transfer film on the contact surface of the counter material. The best wear resistance appeared in the transitional layer with dendrites–amorphous phase composite structure is primarily related to its highest H/E r ratio.
ACKNOWLEDGMENTS
This work was financially supported by the National Basic Research Program of China (2007CB613900), the National Nature Science Foundation of China (50771005 and 50771006), and Program for New Century Excellent Talents in University (NCET-07-0041). We also acknowledge the contributions of Dr. D.V. Dudina for her helpful discussion and Mr. H.H. Song for his kind assistance in SEM observations.