1. Introduction
Dust storms are well-known disastrous weather phenomena peculiar to deserts and their adjacent regions. Dust aerosols can be transported over long distances by severe dust storms and potentially affect the regional precipitation distribution (Yin & Chen, Reference Yin and Chen2007), cloud cover (Kaufman et al. Reference Kaufman, Koren, Remer, Rosenfeld and Rudich2005), biogeochemistry (Okin et al. Reference Okin, Mahowald, Chadwick and Artaxo2004; Bristow et al. Reference Bristow, Hudson-Edwards and Chappell2010) and even global climate (Jickells et al. Reference Jickells, An, Andersen, Baker, Bergametti, Brooks, Cao, Boyd, Duce, Hunter, Kawahata, Kubilay, laRoche, Liss, Mahowald, Prospero, Ridgwell, Tegen and Torres2005). Dust storms greatly impact air quality and pose a threat to human health (Griffin, Reference Griffin2007). As a major source of dust on Earth, East Asia plays an important role in the global dust cycle (Shao et al. Reference Shao, Wyrwoll, Chappell, Huang, Lin, McTainsh, Mikami, Tanaka, Wang and Yoon2011).
Originating from arid and semi-arid areas in northern China and Mongolia, the dust storms in East Asia exhibit pronounced multi-timescale variations from interannual, interdecadal and multi-decadal (Qian et al. Reference Qian, Quan and Shi2002) to glacial–interglacial (Kohfeld & Harrison, Reference Kohfeld and Harrison2001) scales. Dominant factors and mechanisms contributing to variations of East Asian dust storms are diverse across different timescales.
On the interannual timescale, it is generally believed that the variation of dust storm frequency (DSF) in East Asia is highly dependent on large-scale atmospheric circulation anomalies. For instance, Gong et al. (Reference Gong, Mao and Fan2006) suggested that the Arctic Oscillation (AO) in the negative (positive) phase generally helped to enhance (reduce) East Asian dust activity; Hara et al. (Reference Hara, Uno and Wang2006) highlighted the role of El Niño Southern Oscillation (ENSO) in determining the dust transport path; and Lee et al. (Reference Lee, Kim, Ho, An, Cho, Mao, Tian, Wu, Lee, Kalashnikova, Choi and Yeh2015) proposed the combined effect of AO and ENSO in regulating the DSF in East Asia. In addition, regional-scale anomalies of underlying surface characteristics, such as soil moisture (Liu et al. Reference Liu, Yin, Zhang and Yang2004), Eurasian snow cover (Lee et al. Reference Lee, Ho, Kim and Kim2012) and surface vegetation (Kang et al. Reference Kang, Huang, Chen and Wang2016), were also considered to be closely related to dust activities in East Asia.
On the decadal or multi-decadal timescale, various contributing factors were proposed with respect to the reduction in East Asian DSF during the last decades. Qian et al. (Reference Qian, Quan and Shi2002) attributed the reduction in dust storms to the reduced meridional temperature gradient and cyclone frequency in northern China. A study by Zhao (Reference Zhao2004) indicated that the reduced intensity and area of the northern polar vortex were responsible for the decrease in dust storms. Gong et al. (Reference Gong, Mao and Fan2006) found that the decreasing DSF was linked to cold air mass activities controlled by the Siberian High. Zhu et al. (Reference Zhu, Wang and Qian2008) suggested that the increasing surface air temperature over Lake Baikal would result in the weakening of the westerly jet stream and the atmospheric baroclinicity in northern China, thus leading to the decline of DSF. Fan & Wang (Reference Fan and Wang2004) identified a southern annular mode signal influencing northern China’s dust frequency. Despite all of the work mentioned above, the dominant factors that lead to the abrupt change of DSF are not fully understood.
The Arctic has experienced an unprecedented loss in ice cover in recent decades (Parkinson & Comiso, Reference Parkinson and Comiso2013), accompanied by an enormous change in the energy budget, which can pronouncedly affect the Arctic and global climate (Overland & Wang, Reference Overland and Wang2010). As a major cooling source on Earth, the Arctic sea ice has significant impacts on local and remote climates including East Asia (Wu et al. Reference Wu, Su and Zhang2011; Gao et al. Reference Gao, Sun, Li, He, Sandven, Yan, Zhang, Lohmann, Keenlyside, Furevik and Suo2015). For instance, Wu et al. (Reference Wu, Zhang and Wang2009) and He et al. (Reference He, Gao, Furevik, Wang and Li2018) revealed that the Chinese summer rainfall was intricately tied to the Arctic sea ice. Li & Wang (Reference Li and Wang2014) underlined the impacts of autumn Arctic sea ice on the East Asian winter monsoon via Eurasian snow depth. Several studies indicated that the recent Arctic sea ice loss was responsible for the frequent cold extremes (Liu et al. Reference Liu, Curry, Wang, Song and Horton2012) and the increasing number of winter haze days (Wang et al. Reference Wang, Chen and Liu2015; Wang & Chen, Reference Wang and Chen2016). However, previous studies were mostly concerned with the impacts of Arctic sea ice changes on winter or summer climate, with less attention paid to the transitional spring season.
There are some clues indicating that there might be a link between the occurrence of spring dust storms in East Asia and Arctic sea ice change. By using limited data, Yang et al. (Reference Yang, He and Zhao2003) found that spring dust storms in NW China are related to the Arctic sea ice areas over the Kara Sea, the Barents Sea and the Greenland Sea. Zhang et al. (Reference Zhang, Peng, Huang and Zhang2006) further analysed the positive correlation between Arctic ice-snow cover and DSF over northern China from 1954 to 1999, suggesting that the Arctic sea ice loss modulated the DSF by decreasing the polar–equatorial temperature difference. Although these studies have reported the interannual relationship between Arctic sea ice and East Asian dust storm frequency, the interdecadal relationship and its mechanism need to be studied further. In this study, we use longer-term and newer data to investigate the characteristics of Arctic sea ice and East Asian dust storms and their possible link over decadal timescales.
In Section 2, the datasets and methods applied are detailed. The variations in East Asian DSF and Arctic sea-ice concentration (SIC) are described in Section 3. The DSF–SIC relationship is analysed in Section 4. A possible mechanism is illustrated in Section 5. Finally, we provide a summary and discussion in Section 6.
2. Data and method
2.a. Data
2.a.1. Dust storm frequency
We employed two DSF datasets. The first was a special dataset (V1.0) of national dust storms of China provided by the National Meteorological Information Center of China Meteorological Administration. This dataset includes daily records (1 or 0, corresponding to the occurrence or non-occurrence) of floating dust, blowing dust and dust storm weather phenomena at more than 2400 surface observation stations in China from 1980 to 2012. The 673 national basic stations with continuous observations are selected in this study (Fig. 1b). The second dataset was based on monthly dust storm days from weather stations of China, compiled by the China Meteorological Administration (China Meteorological Administration, 2017). We obtained a time series of the spring (March–May) DSF averaged over 245 stations in northern China from 1961 to 2015 (Fig. 1d).
(a) Topographic distribution in East Asia. Colored areas represent altitude (unit: m). (b) Distribution of the climatological-mean (1980–2012) spring (March–April–May) DSF (unit: d/yr) from 1980 to 2012. (c) The climatological-mean (1980–2012) monthly percentage of DSF averaged for northern China (unit: %). (d) Year-to-year variation of spring DSF averaged for 245 stations in northern China from 1961 to 2015. The red line denotes the 1961–2015 mean. The black box in (a) represents the geographical scope of (b). The green box in (b) represents the region of northern China.

2.a.2. Arctic sea ice concentration dataset
The monthly mean SIC data at a 1° × 1° grid were extracted from the Meteorological Office Hadley Centre (Rayner et al. Reference Rayner2003). SIC is expressed as a percentage, that is, the ice-covered area per unit area. In this study we only use Arctic SIC data from 1960 to 2015 that overlaps with the dust storm data record period.
2.a.3. Atmospheric data
Some atmospheric data, including sea-level pressure (SLP), geopotential height and wind speed and direction, were obtained from the National Centers for Environmental Prediction and the National Center for Atmospheric Research (NCEP and NCAR) reanalysis dataset (Kalnay et al. Reference Kalnay, Kanamitsu, Kistler, Collins, Deaven, Gandin, Iredell, Saha, White, Woollen, Zhu, Chelliah, Ebisuzaki, Higgins, Janowiak, Mo, Ropelewski, Wang, Leetmaa, Reynolds, Jenne and Joseph1996), with a horizontal resolution of 2.5° (longitude) × 2.5° (latitude) and 17 vertical levels in the range 10–1000 hPa. In this paper, the 6-hour daily mean and monthly mean data from 1961 to 2015 are applied. The 6-hour data are used to identify the westerly jet axis, the daily mean data to calculate the maximum Eady growth rate and the synoptic-scale variance, and the monthly mean data to analyse the atmospheric circulation anomalies.
2.b. Method
2.b.1. Abrupt shift detection
We identified years in which an abrupt shift occurred by using the B-G segmentation algorithm, proposed by Bernaola-Galván et al. (Reference Bernaola-Galván, Ivanov, Nunes Amaral and Stanley2001). The main idea of this method is to set a sliding pointer from left to right along a sequence to divide the signal into several segments; the maximum difference in the mean values between adjacent segments is considered as the abrupt shift point. This method is especially suitable for dealing with nonlinear and non-stationary climatological data.
2.b.2. Regression analysis
Linear regression (Wang & Zhang, Reference Wang and Zhang2015) was applied to reveal the corresponding atmospheric circulation with respect to the Arctic SIC and East Asian DSF time series. In order to stress the multi-decadal correlation, high-frequency variations (< 9 years) of all elements are filtered out through a low-pass Gaussian filter. The Student t-distribution is used to test the significance of the atmospheric differences before and after the shift.
2.b.3. Wave activity flux
We computed the wave activity flux (WAF) to reveal the propagation of quasi-stationary planetary waves in mid-latitude, based on the method proposed by Takaya and Nakamura (Reference Takaya and Nakamura2001). The monthly atmospheric anomalies are used as disturbances relative to the climatological average.
2.b.4. Maximum Eady growth rate
The maximum Eady growth rate, a measure of atmospheric baroclinicity (Eady, Reference Eady1949; Simmonds & Lim, Reference Simmonds and Lim2009), is computed using daily mean data from NCEP/NCAR and defined
 $${\sigma _{\rm{E}}} = 0.3098{{f\left( {dU(z)/dz} \right)} \over N},$$
where f is the Coriolis parameter, N is the Brunt-Väisälä frequency, U(z) is the vertical profile of the eastwards wind component and z is the vertical height.
3. East Asian DSF and Arctic SIC variations
3.a. Spatiotemporal variations in East Asian DSF
Originating from the arid and semi-arid highlands of northern China and Mongolia (Fig. 1a), the East Asian dust storms exhibit prominent regional features in spatial distribution and multi-timescale (seasonal, interannual and decadal) characteristics in temporal variation.
Using the dataset for dust storm days spanning the past 33 years (1980–2012), the spatial distribution of climatological mean spring DSF is shown in Figure 1b. It can be seen that the stations with more than 1 day per year of dust storms in spring are mainly concentrated in northern China (70–135° E, 35–50° N; green box in Fig. 1b), particularly in the northwestern part. The high-frequency centres of spring DSF exceeding 8 days per year are observed around the Taklimakan Desert and the Gobi Desert (see Fig. 1a for the locations), the major source regions of East Asian dust storms. Figure 1c presents the climatological mean monthly DSF percentage averaged for northern China, where it is obvious that spring is the dominant season for dust storm activities; the DSF in spring accounts for 55.3% of the annual total frequency. DSF in northern China is therefore an important index to characterize the dust activity in East Asia.
The year-to-year variation of spring DSF (Fig. 1d), averaged over 245 stations in northern China, is referred to as the index of spring DSF (I DSF, in units of day per year or d/yr). According to Figure 1d, the spring DSF has been characterized by interannual and multi-decadal variations during the past half-century. A fluctuating downwards trend is evident, with scarce dust storm activities in the last 5 years. Spring dust storms occurred with relatively high frequency during the 1960s (2.4 d/yr) and in the 1970s (2.4 d/yr), reaching a peak in 1966 (3.7 d/yr). The DSF experienced a sharp drop in the 1980s (1.7 d/yr). From the 1990s to the first decade of the twenty-first century, the DSF dropped to 0.8–0.9 d/yr, and to merely 0.4 d/yr in the last 5 years. The continuous downwards trend of DSF is consistent with previous studies (Zhou, Reference Zhou2001; Qian et al. Reference Qian, Quan and Shi2002; Ding, Reference Ding2005).
In addition, the variance in the detrended I DSF accounts for only 34.7% of the total variance, which means that the decadal or multi-decadal variation of DSF is more significant than the interannual variation.
3.b. Variations in Arctic SIC
Over the past half-century, Arctic SIC has drastically declined with a decreasing trend that varies seasonally. As shown in Figure 2, the decreasing trend of SIC dominates the marginal Arctic in October. From the Chukchi Sea and the eastern Siberian Sea on the southern edge of the Arctic, to the west of the Laptev Sea and the Kara Sea at the northern end of Eurasia, SIC decreases by approximately 10% per decade. The distribution pattern in July shows some similarity to that in October, but over a relatively smaller area. The declining areas in January and April are greatly reduced compared with those in October and July; nevertheless, there are steady areas of declining SIC in the region from the northern part of the Greenland Sea to the Barents Sea (GB, 20° W–60° E, 74.5–78.5° N; red framed sector in Fig. 2), where SIC loss exceeds 10% per decade. There are also slight increasing trends in the Chukchi Sea, the Beaufort Sea and the eastern Siberian Sea, but they are insignificant compared with the decreasing trends.
Distributions of Arctic SIC trend coefficients (1960–2015) (Unit: %/decade) in January (a), April (b), July (c), and October (d). Dotted areas denote passing the significance test at 95% confidence level. The red box indicates the key region.

A recent study (Sato et al. Reference Sato, Inoue and Watanabe2014) shows that the sea-ice loss in the Barents Sea and the Kara Sea is likely due to the pole-wards shift of the Gulf Stream front and increased ocean heat transport (Årthun et al. Reference Årthun, Eldevik, Smedsrud, Skagseth and Ingvaldsen2012). Several studies have found that the GB sector is an active area for the ice–sea–air interaction in winter and spring, which acts as a stable forcing, generating climate anomalies over the polar regions and even over remote Eurasia (Wu et al. Reference Wu, Wang and Walsh2004; Petoukhov & Semenov, Reference Petoukhov and Semenov2010). We have therefore chosen the GB sector as the key region of SIC variation in winter and spring, and the standardized SIC averaged for the GB sector is defined as the index of SIC (I SIC) in our investigation.
SIC in the key region shows a significant seasonal cycling feature (Fig. 3a). In winter and spring, it is generally relatively high and stable (> 50% during February–April), and low (c. 10% in August and September) in summer and autumn as the ice melt season begins. The ice coverage starts to increase in October. Variations in the standard deviation bear some resemblance to the mean value, with a peak in February (15.4%) and a trough in September (6.1%). We also examine SIC trends in each month. The results show that the declining trend of SIC in the key region persists throughout the entire year, although the declining trends in winter and spring are much more obvious than those in summer and autumn, with a maximum in February (a decline of 6.7% per decade).
(a) Climatological-mean (1960–2015) annual cycle of SIC in the key region. The dark green columns denote the mean values (unit: %), the red columns denote the standard deviations (unit: %), and the black line denotes the trend coefficients (unit: %/decade). The trend coefficients of each month all pass the significance test at the 95% confidence level. (b) Lag-correlation coefficients of monthly SIC in the key region from January to December. The y-axis indicates the lagging month. All of the correlation coefficients presented pass the significance test at the 95% confidence level.

In addition, the variation of SIC in the key region exhibits significant lag-correlations between different months. As shown in Figure 3b, lag-correlation coefficients in the key region peak in winter months. For example, the variation of SIC in January has a high correlation with that in the following months, sustaining a correlation coefficient that exceeds 0.8 with SIC in May. This suggests that the SIC anomaly in winter has strong persistence, which can last nearly half a year.
4. Relationship between East Asian DSF and Arctic SIC
4.a. Correlation analysis
The aforementioned key region of the Arctic sea ice is also the region of SIC that is highly correlated with I DSF. Figure 4 shows the distributions of SIC correlation coefficients in the preceding winter and simultaneous spring with I DSF. The spatial patterns show great similarity: significantly positive correlations prevail over the key GB sector while the negative correlations, which are relatively weak during spring (Fig. 4b), appear in the eastern Siberian Sea and the Beaufort Sea. Notably, the high correlations over the GB sector persist from winter to spring, corresponding to the strong persistence of the key SIC region illustrated in Figure 3b.
Distributions of correlation coefficients of Arctic SIC in the preceding winter (a) and spring (b) with I DSF. The light (dark) orange-colored areas denote positive correlation coefficients passing the significance test at the 95% (99%) confidence level; the light (dark) blue-colored areas denote negative correlation coefficients passing the significance test at the 95% (99%) confidence level.

4.b. Abrupt shift detection
The index of spring DSF (I DSF) demonstrates an identical downwards shift and decadal variation to that of the preceding winter SIC in the key region (Fig. 5). Moreover, their abrupt shifts occur in almost the same years. Dust storms prevailed in the 1960s to the early 1980s, when the Arctic was covered with abundant ice. However, from the mid-1980s to the early twenty-first century, Arctic SIC experienced a sharp loss followed by a sudden decrease in East Asian DSF. In the last decade, the remarkable few occurrences of East Asian dust storms have been closely associated with the drastic sea-ice loss. The correlation coefficient between the two curves is 0.63, which is significant at the 99% confidence level. After the removal of high-frequency signals (< 9 years) with a Gaussian filter, the correlation between the two low-frequency (> 9 years) series reaches 0.91. By computing the 15-year sliding correlation coefficients after removing the linear trends of both series (not shown), it is found that the SIC–DSF relationship is changeable and not significant, suggesting a relatively weak and unstable correlation between SIC and DSF on the interannual timescale. The association between East Asian DSF in spring and Arctic SIC in the preceding winter mainly appears over decadal timescales.
Detection of abrupt shift years of I DSF (green) and the preceding winter I SIC (red) based on B-G method. The solid lines with circles represent standardized sequences; the dashed lines are the stage means before and after the shift. The pink and grey vertical lines denote the shift years of I SIC and I DSF respectively, passing the significance test at the 95% confidence level. The x-axis is the year of I DSF.

Through the B-G segmentation algorithm, the abrupt shift years of I SIC and I DSF are objectively detected. The result shows that there are basically consistent stage changes of Arctic SIC and East Asian DSF with a turning point in the early 1980s. The sudden decrease of I DSF occurred in 1985, keeping pace with the regime shift of I SIC centred on 1981/1982. In fact, there is another shift year around 2004/2005 (not shown) for both SIC and DSF. This indicates a further decrease in the two records, but here we only focus on the greater and more significant shift in the 1980s.
5. Possible mechanisms for the influence of Arctic SIC on East Asian DSF
5.a. Decadal shift of Northern Hemisphere atmospheric circulation
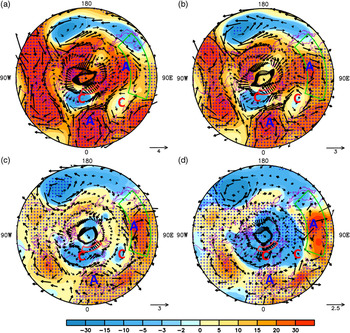
There were clear shifts in SIC and DSF around the early 1980s. To display the characteristics of the abrupt shift-related circulation anomalies in the subsequent analyses, the entire time period is divided into two sub-periods: 1961–1981 and 1986–2015. Significant decadal changes in large-scale atmospheric circulation between the two sub-periods are observed at different levels over the Northern Hemisphere (Fig. 6). The anomalous patterns are generally characterized by a planetary-scale Rossby wave train emanating from the polar sector. This kind of teleconnection pattern has a series of anomaly centres stretching across Eurasia to East Asia, that is, an anomalous cyclone (low pressure) over the Greenland Sea, an anomalous anticyclone (high pressure) over the Poland–Germany plain, an anomalous cyclone (low pressure) over western Kazakhstan and an anomalous anticyclone (high pressure) over Lake Baikal and Mongolia.
Differences of spring-mean geopotential height (colored, unit: gpm) and winds (vectors, unit: m/s) at 300 hPa (a), 500 hPa (b) and 850 hPa (c) between 1986–2015 and 1961–1981. (d) Same as (a), but for SLP (colored, unit: 0.1 hPa) and surface winds (vectors, unit: m/s). Dotted areas denote SLP or geopotential height passing the significance test at the 90% confidence level, and bold vectors represent wind fields passing the significance test at the 90% confidence level. The outermost latitude of domains is 30°N.

In general, the teleconnection pattern is robust across the whole troposphere, but the locations of action centres shift slightly northwards with height. Consider the decadal difference between the two sub-periods in East Asia: the anomalous anticyclone (high pressure) is centred over Mongolia in the middle and lower troposphere (Fig. 6b–d), while it is located over Lake Baikal in the upper troposphere (Fig. 6a). The northwards tilt may relate to the atmospheric baroclinicity in the middle and high latitudes (Yin & Battisti, Reference Yin and Battisti2004).
5.b. Impact of Arctic SIC on Northern Hemisphere atmospheric circulation
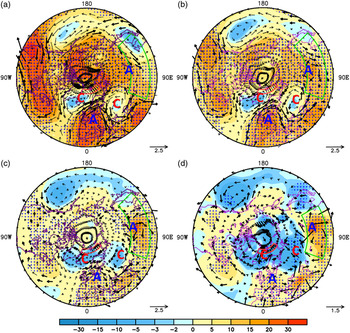
To explore the decadal impact of Arctic SIC variation on the large-scale atmospheric circulation, the spring SLP, geopotential height, and wind fields are regressed onto the 9-year Gaussian-filtered I SIC of the preceding winter (Fig. 7). All of the regression coefficients are multiplied by −1 to obtain the atmospheric response to the decadal loss of Arctic SIC. Based on the regressed atmospheric fields, we can obtain the identical Rossby-wave teleconnection patterns with the decadal difference distributions between the two sub-periods in Figure 6. This means that the inter-decadal shift of large-scale atmospheric circulation in the Northern Hemisphere is to some extent modulated by the phased change in Arctic SIC.
(a) Distribution of spring-mean 300 hPa (a), 500 hPa (b) and 850 hPa (c) geopotential height (colored, unit: gpm) and winds (vectors, unit: m/s) regressed against nine-year Gaussian-filtered I SIC of the preceding winter, in the period 1961–2015. The I SIC has been multiplied by –1 for convenient comparison. (d) Same as (a), but for SLP (colored, unit: 0.1 hPa) and surface winds (vectors, unit: m/s). Dotted areas denote SLP, or geopotential height, passing the significance test at the 90% confidence level; bold vectors represent wind field passing the significance test at the 90% confidence level. The outermost latitude of domains is 30°N.

The possible mechanism can be illustrated as follows. The anomaly of Arctic SIC in the preceding winter can persist to spring, due to its strong persistence. The decadal loss of Arctic SIC results in the warming heat flux over the key region, as there is more open water where the ice melts. The near-surface anomalous diabatic heating tends to excite the low-pressure and cyclonic anomaly locally in the Greenland Sea. This anomaly disperses along the westerly wind, forming the hemispherical-scale Rossby wave train and consequently generating the planetary-scale circulation anomaly in the Northern Hemisphere. As shown in Figure 7, the large-scale Rossby wave train can be depicted by the ‘−+−+’ interlacing anomaly distribution in geopotential height fields, corresponding to the ‘cyclone–anticyclone–cyclone–anticyclone (C–A–C–A)’ anomaly distribution in wind fields. This wave train or atmospheric response is robust across the whole troposphere.
To further elucidate this point, we also compute the WAF and quasi-geostrophic stream function that reflect large-scale atmospheric wave propagation anomalies in the Northern Hemisphere. The WAF represents the large-scale Rossby wave propagation, and the quasi-geostrophic stream function represents the centres of action. By regressing the WAF and stream function onto the 9-year Gaussian-filtered I SIC, Figure 8a depicts the response of the 500-hPa Rossby wave propagation to the Arctic sea-ice loss. Triggered by the decrease of SIC, the WAF exhibits a distinctive arc-shaped trajectory, perturbing the two positive height (anticyclone) anomalies and a negative height (cyclone) anomaly as the teleconnection shown in Figure 7. This teleconnection originates from the Greenland Sea, propagates eastwards along the Poland–Germany plain through Eurasia and arrives in East Asia. Moreover, the propagation route and action centres of the DSF-related Rossby wave (Fig. 8b) match those of the SIC-related teleconnection (Fig. 8a). This suggests that the wave pattern, excited by the decrease of Arctic sea-ice concentration in the preceding winter, should be responsible for East Asian spring dust activities.
Regressed maps of the 500-hPa WAF (vectors, unit: m2 s−2) and quasi-geostrophic streamfunction (contours, unit: 105 m2 s−1) against nine-year Gaussian-filtered I SIC of the preceding winter (a) and I DSF in the contemporary spring (b) during 1961–2015. The I SIC and I DSF have been multiplied by –1.0 for convenient comparison. The bold vectors represent wave activity flux passing the significance test at the 90% confidence level. The outermost latitude of domains is 30°N.

This result is consistent with that from previous studies (Honda et al. Reference Honda, Inoue and Yamane2009; Wu et al. Reference Wu, Zhang and Wang2009), suggesting that the Rossby wave induced by Arctic sea-ice loss plays a fundamental role in modulating the climate system of Eurasia. Recently, Zhang et al. (Reference Zhang, Sun and Li2018) found that a similar wave pattern was excited by the interannual variation of northern Barents Sea and the Baffin Bay ice. This indicates that the abovementioned wave pattern may exist in both interannual and multi-decadal timescales.
Among all the height and wind anomalies within the teleconnection pattern, the positive geopotential height (anticyclonic) anomaly centred over Mongolia (Mongolian high anomaly) in the middle and lower troposphere plays a direct role in impeding the dust storm occurrences. Wave energy propagates into Mongolia and its surrounding region through the Rossby wave train, leading to the regional-scale circulation anomaly in East Asia.
5.c. East Asian circulation anomaly associated with Arctic SIC
Before examining the regional circulation changes in East Asia, it is necessary to present the climatological background fields. Figure 9a shows the climatological mean distributions of the geopotential height and the meridional gradient at 500 hPa. In spring, the middle and high latitudes in East Asia are dominated by the northwesterly flow, and northern China is located in the front zone where there are relatively large meridional gradients (Fig. 9a).
(a) Climatological-mean (1961–2015) distribution of the 500-hPa geopotential height (contour, unit: gpm) and its meridional gradient (colored, unit: 10−5 gpm /m) in spring. (b) Differences of 500 hPa geopotential height (contour, unit: gpm) and its meridional gradient (colored, unit: 10−6 gpm /m) in spring between 1986–2015 and 1961–1981 (1986–2015 minus 1961–1981). (c) Same as (b), but for the latitude-height (averaged in 70°E–110°E) cross-section distribution. (d) Differences of frequency percentage of the 500-hPa westerly jet axis (colored, unit: %) in spring. Dotted areas in (b) (c), and (d) denote the colored variables passing the significance test at the 90% confidence level. Blank areas in (c) denote topographic influences. The green boxes represent the region of northern China.

The regional circulation anomaly, induced by the Rossby wave train, is mainly characterized by the enhancement of geopotential height around Mongolia. As shown in Figure 9b, the enhanced height around Mongolia at 500 hPa exceeds 30 gpm (geopotential metres). This prominent enhancement in height generates a southwards geopotential gradient that is opposite to the mean climate state, and thus weakens the meridional gradient over the dust source region. There is a clear band of the weakened meridional geopotential gradient zonally elongated over northern China (Fig. 9b). Moreover, the enhanced geopotential height exists throughout the whole troposphere, but has larger amplitude in the middle and lower troposphere (Fig. 9c). Correspondingly, the suppressed meridional gradients are also obvious at 700 hPa and 850 hPa.
The 500-hPa wind field adjustment to the height field is further examined (Fig. 9d). If the zonal wind speed in a certain grid is the maximum in the vicinity of meridional grids (both to its north and south), the latitude of the grid is defined as the position of the westerly jet axis. The frequency percentage of the jet axis in each grid is then calculated with the NCEP/NCAR 6-hour zonal wind data. As shown in Figure 9d, a marked reduction in frequency of the jet axis is observed in most areas of northern China, especially over latitudes 40–45° N. According to the thermal wind balance, wind deceleration is closely tied to the reduced meridional gradient over the middle latitudes. The distribution of the reduced westerly jet axis frequency overlaps well with the distribution of the suppressed meridional gradient in Figure 9b. The suppressed meridional gradient, caused by the Mongolian high anomaly, therefore leads directly to the deceleration of westerly wind over the dust source region.
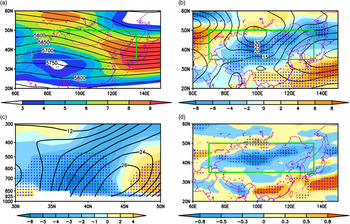
Notably, the wind deceleration over the dust source region does not exist only in the mid-troposphere, but appears throughout the troposphere. From the cross-sections of wind speed averaged for the latitude range (35–50°N) where East Asian major deserts are located (Fig. 10), it can be seen that the climatologically averaged wind speed over the dust source region reaches the maximum (over 30 m s–1) at 200 hPa (Fig. 10a). The mean wind speeds from 1961 to 1981 decrease from the surface to 150 hPa compared with those from 1986 to 2015 (Fig. 10b). The most significant decrease in wind speed occurs in the middle–lower troposphere below 500 hPa, which corresponds to the suppressed meridional gradient (Fig. 9c), reaching 0.48–2.0 m s–1 over the longitudes 85–105° E, where the eastern part of the Taklimakan and Gobi deserts are located. The wind speeds regressed against I SIC and I DSF also show similar changes (Fig. 1c, d).
Longitude-height cross-section maps of the spring-mean wind speed averaged across 35°N–50°N. (Unit: m/s). (a) Climatological mean (1961–2015). (b) Difference between 1986–2015 and 1961–1981 (1986–2015 minus 1961–1981). (c) Regression map against nine-year Gaussian-filtered I SIC of the preceding winter from 1961 to 2015. (d) Regression map against nine-year Gaussian-filtered I DSF of the contemporary spring. The I SIC and I DSF have been multiplied by –1.0 for convenient comparison. Blank areas denote topographic influences. Dotted areas in (b) (c), and (d) denote passing the significance test at the 90% confidence level. Intervals of (a) (b) (c), and (d) are 3 m/s, 0.4 m/s, 0.2 m/s, and 0.2 m/s, respectively.

Assuming that the distribution of the dust source areas was fixed in the past 55 years, climatic factors over the dust source region should be directly responsible for the dust storm activity. It is generally accepted that the strong middle-latitude northwesterly flow is crucial to the genesis of Asian dust storms (Zhou, Reference Zhou2001; Liu et al. Reference Liu, Yin, Zhang and Yang2004; Ding, Reference Ding2005). The decrease of wind speeds in the middle–lower troposphere indicates dampened cold air incursions and stabilized atmospheric conditions, which restrain the genesis of dust storms over the dust source region.
Apart from the reduced mean wind speed, the Mongolian high anomaly and the suppressed meridional gradient in northern China also lead to the reduced baroclinicity and dampened vertical shear. As shown in Figure 11a, significantly reduced meridional gradients of temperature occur in northern China, suggesting a weaker baroclinicity. As a measure of the atmospheric baroclinicity, the maximum Eady growth rate is calculated in the lower troposphere to check the decadal change in baroclinicity (Fig. 11b). A noticeable feature is the zonally elongated band of the weakened Eady growth rate along 42° N, especially in the Taklimakan and Gobi deserts. The reduced baroclinicity is not conducive to the development of synoptic-scale disturbance, which is the direct driving factor of dust storms (Qian et al. Reference Qian, Quan and Shi2002; Gong et al. Reference Gong, Mao and Fan2006). To confirm the relevant variation in synoptic-scale disturbances, we further analysed the synoptic variance of geopotential heights at the 850-hPa level. Here the synoptic variance is defined as  $\sqrt {\overline {\Phi {'^2}} } $
(Nakamura & Wallace, Reference Nakamura and Wallace1990), where the prime denotes the geopotential height perturbations of 1–7 days after band-pass filtering, and the overbar denotes the time average over spring (1 March–31 May). The regions with decreased synoptic variances are mainly located in northwestern China and western Mongolia, including the Taklimakan and Gobi deserts (Fig. 11d). The decrease of synoptic variances over the dust source regions is suggestive of restrained synoptic-scale disturbances and cyclogenesis, which is directly responsible for the decreased DSF.
Differences of various variables between 1986–2015 and 1961–1981 (1986–2015 minus 1961–1981) in spring. (a) Meridional gradient of 850 hPa temperature (unit: 10−7 K /m). (b) The maximum Eady growth rate  ${\sigma _E}$
at 850 hPa (unit: day−1). (c) The vertical wind shear between 700 hPa and the surface (unit: m/s). (d) The synoptic-scale variance at 850 hPa (unit: gpm). Dotted areas denote passing the significance test at the 90% confidence level.

The Mongolian high anomaly may also result in decreased DSF by dampening vertical wind shear and dust emission. Figure 11c shows the inter-decadal change in the vertical wind shear between 700 hPa and the surface. The negative belt is zonally elongated across northern China, with the extreme values centred in the Taklimakan and Gobi deserts. The weakening of vertical wind shear can be attributed to the suppressed height gradient and wind speed in the lower troposphere (Fig. 9c). The dampened vertical wind shear suggests enhanced atmospheric stability, which is also unfavourable for dust storm genesis and downstream transport.
6. Summary and discussion
We have demonstrated the spatial and temporal variations in East Asian DSF and Arctic SIC from 1961 to 2015, and examined the possible relationship between them. The following conclusions can be drawn.
(1) The spring DSF in East Asia has experienced a remarkable fluctuating decrease in the past half-century, with scarce dust storm activity in the last 5 years. In addition, drastic loss of Arctic sea ice has been observed, with seasonal and regional variations. The region from the northern part of the Greenland Sea to the Barents Sea (20° W–60° E, 74.5–78.5° N) is selected as the key region, where the sea ice loss exceeds 10% per decade in winter and spring. The change in Arctic sea-ice concentration in the key region is strongly persistent, indicating that the winter SIC anomaly can last for nearly half a year.
(2) On the decadal timescale, East Asian spring DSF shows a significant positive correlation with the preceding winter Arctic SIC over the key region. Abrupt shifts are objectively detected using the B-G segmentation algorithm and, coincidently, both the spring DSF in East Asia and Arctic SIC in the preceding winter exhibit obvious regime shifts in the early 1980s. The shift year of Arctic SIC occurred around 1981/1982, while the shift year of DSF occurred in 1985. The East Asian DSF experienced a sudden decrease following the sharp loss of Arctic sea ice after the shift year.
(3) The association between Arctic SIC and East Asian DSF is explained in Figure 12. The decadal loss of Arctic SIC tends to excite a large-scale Rossby wave train, which results in a considerably enhanced geopotential height centred in Mongolia. This prominent positive height anomaly causes decadal weakening of the meridional gradient in the middle–lower troposphere. The decreased meridional gradient not only decelerates the regional westerly winds and dampens vertical wind shear, but also weakens atmospheric baroclinicity, which further restrains synoptic-scale disturbances over the major dust source regions. The above three aspects are directly responsible for the decadal reduction in DSF. The Arctic sea-ice loss therefore generates the hemispherical-scale atmospheric teleconnection pattern, inducing the regional-scale circulation anomalies over East Asia and, consequently, resulting in the reduction in DSF.
Schematic diagram of the mechanisms of the influence of Arctic SIC on East Asian DSF.

In this study, we have focused only on the role of decadal loss of Arctic SIC in modulating East Asian DSF. Apart from Arctic sea ice, other boundary forcings, such as the tropical ocean-surface temperature in the Pacific (Gao & Li, Reference Gao and Li2015) and Atlantic Multidecadal Oscillation (AMO) (Xiao et al. Reference Xiao, Li, Fan, Zhang, Sun and Wang2014), have also been reported to be responsible for the weakened wind during past decades. It is notable that, during the 1980s, several atmospheric internal variables and external forcings exhibited certain adjustments: the significant weakening of the East Asian winter monsoon (Miao et al. Reference Miao, Wang, Wang, Zhu and Sun2018), the increase of snow cover in northeastern Asia (Wang & He, Reference Wang and He2012), the significant warming over East Asia (Lee et al. Reference Lee, Kim, Jhun, Ha and Seo2013), and the expansion and strengthening of Ferrel circulation (Kim et al. Reference Kim, Kim, Lau, Kim and Cho2015). Recent studies attribute those regime shifts to the shifts of sea-surface temperature in the 1980s over equatorial India (Zou et al. Reference Zou, Qiao, Feng, Wu and Feng2018), North Pacific Ocean (Yeh et al. Reference Yeh, Kang, Noh and Miller2011) and Atlantic Ocean (Feng et al. Reference Feng, Zou, Qiao, Zhi and Gong2018). These external forcing changes may have profound impacts on the East Asian climate, through direct or indirect ways. Yasunaka & Hanawa (Reference Yasunaka and Hanawa2003) pointed out that the shift in the 1980s may have been independent of tropical forcing. More evidence is needed to determine whether the forcing anomaly from the polar region played a prior role. Reid (Reference Reid, Hari, Beaugrand, Livingstone, Marty, Straile, Barichivich, Goberville, Adrian, Aono, Brown, Foster, Groisman, Helaouet, Hsu, Kirby, Knight, Kraberg, Li, Lo, Myneni, North, Pounds, Sparks, Stubi, Tian, Wiltshire, Xiao and Zhu2016) pointed out that the 1980s regime shift represented a major change in the Earth’s biophysical systems, from the ocean to the upper atmosphere, from the Arctic to the Antarctic. The regime shift of East Asian dust storm frequency in 1980s was therefore likely caused by combined factors through complex physical and chemical processes, which calls for further investigation.
Acknowledgments
We thank Chang Quan, Xiaoxun Xie and Xugeng Cheng for their assistance with data processing and the two anonymous reviewers for their insightful criticism and suggestions. This work was jointly supported by the National Key Research and Development Program of China (2016YFA0601904), the Strategic Priority Research Program of Chinese Academy of Sciences (XDA20070103), the National Natural Science Foundation of China (41690115) and China’s Ministry of Environmental Protection through the Key Task Project (DQGG0104).