Introduction
Chinstrap penguins (Pygoscelis antarctica Forster) are important predators in the Southern Ocean that feed mainly on Antarctic krill (Euphausia superba Dana) (Trivelpiece et al. Reference Trivelpiece, Trivelpiece and Volkman1987, Lynnes et al. Reference Lynnes, Reid and Croxall2004). The global population is estimated to be c. 8 000 000 individuals (Trivelpiece et al. Reference Trivelpiece, Trivelpiece and Volkman1987, Fishpool & Evans Reference Fishpool and Evans2001) and is believed to be stable or possibly increasing (BirdLife International 2008). Because of their dependence on krill they are a key monitoring species under the Convention for the Conservation of Antarctic Marine Living Resources (CCAMLR) Ecosystem Monitoring Program (CEMP, CCAMLR 2004).
While much is known about the breeding biology, population dynamics and diet of chinstrap penguins during the summer breeding period, little is known about their distribution, movement patterns or feeding behaviour outside of the breeding season (Wilson et al. Reference Wilson, Culik, Kosiorik and Adelung1998, Trivelpiece et al. Reference Trivelpiece, Buckelew, Reiss and Trivelpiece2007). Trivelpiece et al. (Reference Trivelpiece, Buckelew, Reiss and Trivelpiece2007) showed that chinstrap penguins from the South Shetland Islands tend to remain in the vicinity of their colonies throughout early winter, although they are also capable of long-ranging migrations during this period. Two satellite-tracked penguins from King George Island undertook long migrations towards the north-east and appeared to feed for a period near the South Orkney Islands. One of these birds subsequently proceeded towards the South Sandwich Islands but the signal was lost before the animal reached this archipelago. A similar path towards the South Sandwich Islands was described by Wilson et al. (Reference Wilson, Culik, Kosiorik and Adelung1998) for another chinstrap penguin tagged at King George Island. Thus, while two of seven birds tracked from the South Shetland Islands undertook migrations of ∼1500 km towards the South Sandwich Islands none were recorded to have come ashore there.
Trivelpiece et al. (Reference Trivelpiece, Buckelew, Reiss and Trivelpiece2007) suggested that the long-range winter migrations observed in their study and that by Wilson et al. (Reference Wilson, Culik, Kosiorik and Adelung1998) reflect ties to ancestral epicentres of chinstrap penguins. While the colonies at the South Sandwich Islands today contain only about 30% of the global population (Convey et al. Reference Convey, Morton and Poncet1999), this archipelago is at the geographic epicentre of the global range and most probably represents the ancestral colonies of this species (Trivelpiece et al. Reference Trivelpiece, Buckelew, Reiss and Trivelpiece2007). Significant increases in range appear to have occurred during the 1930s–70s (Sladen Reference Sladen1964), with expansions both east and west. Colonies at Bouvetøya probably became established as a consequence of such expansions from the South Sandwich Islands. If long-range migrations do indeed represent ties to ancestral epicentres, we would expect to find evidence of such migrations also from smaller, relatively recently established colonies such as those at Bouvetøya.
In this study we describe a long-range migration by a chinstrap penguin leaving the Nyrøysa colony at Bouvetøya at the end of the summer breeding season, and arriving at Montagu Island in the South Sandwich Islands in time for the annual moult. Nyrøysa has a mixed breeding colony of penguins, which is dominated by macaroni penguins. Following a rapid decline from about 2500 breeding pairs in 1996 the macaroni penguin population appears to have remained stable since year 2000, and the 2007–08 population estimate was ∼1100 breeding pairs (CEMP unpublished). During the same period chinstrap penguin numbers have declined from about 200 to less than 40 breeding pairs in 2007–08 (CEMP unpublished).
Methods
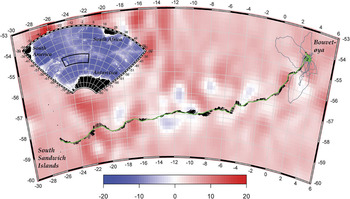
This study is part of the 2007–08 Norwegian Antarctic Research Expeditions (NARE) summer expedition to Bouvetøya in the Southern Ocean. Bouvetøya is the only landmass within CCAMLR Subarea 48.6 and is a CEMP network site for monitoring chinstrap penguins, macaroni penguins (Eudyptes chrysolophus Brandt) and Antarctic fur seals (Arctocephalus gazelle (Peters)). The expedition was based at Nyrøysa on the west coast of the island (54.41°S, 03.29°E, Fig. 1a).
Paths of one chinstrap penguin from Bouvetøya to the South Sandwich Islands overlaid on Mean Sea Level Anomaly (MSLA) averaged over the tracking period. The focal penguin track is represented by the solid green line, while the tracks of six other penguins tracked simultaneously are represented by the thin grey lines. Currents experienced by the bird along the track are represented by thin black lines along the focal track. The lengths of the lines are proportional to the speed of the current (ranging from zero (no line) to 32 cm s-1). The angles of the current vectors indicate the direction of the current from the points where current vectors are anchored to the black penguin track-line towards the free ends of the vectors. Current speeds and directions were calculated from the daily Mean Absolute Dynamic Topography (MADT, see text for details). The coloured surface representing average sea level anomalies highlight mesoscale eddies encountered by the penguin during the migration. Positive MSLA values indicate anticyclonic eddies surrounded by anticlockwise current flows while negative values represent cyclonic eddies surrounded by clockwise current flows. The inset map shows the general region of the Southern Ocean for easier orientation. The background colour represents bottom topography extracted from the ETOPO 2 global ocean bathymetry database (http://www.ngdc.noaa.gov/mgg/image/2minrelief.html).

The focal penguin in this study was initially equipped with a Time Depth Recorder (TDR) and a Platform Terminal Transmitter (PTT) on 28 January 2008, as part of a larger programme studying at-sea behaviour of three of Bouvetøya’s krill predators. Six other chinstrap penguins were also instrumented following the same methods, and the tracks from these individuals are presented here for general comparison. The bird weighed 3.4 kg at this time and was guarding two large chicks. Data from the TDR were not used in this study, so no details about this instrument have been included here, except for its dimensions and weight. We attached the PTT (0.5 W Kiwisat 202, Sirtrack Ltd, Havelock North, New Zealand) linked to the ARGOS Collection and Location System (Argos 2008) to the dorsal feathers using Loctite 323 rapid setting glue. The TDR had a cross-sectional area of 2.25 cm2 and weighed 32 g in air (∼14 g in seawater) while the PTT had a cross-sectional surface area of ∼9.5 cm2 and weighed 100 g in air (16 g in water). When we removed the TDR on 10 February the bird weighed 3.5 kg, and both chicks were present at the nest and in healthy condition. The PTT unit was still firmly attached without any signs of wear or discomfort, and we left it attached to monitor sea movements during the period between breeding and moulting.
We used data on Mean Sea Level Anomaly (MSLA) to examine the track of the penguin in relation to ocean mesoscale eddy structure, and we used ocean currents calculated from Mean Absolute Dynamic Topography (MADT) to examine changes in movements in relation to ocean currents. We obtained these datasets from the AVISO online data access service at http://www.aviso.oceanobs.com/.
Statistical analyses
Location estimates obtained through the Argos system have uncertainties associated with them. To obtain tracks that most probably resemble the unobserved true paths taken by penguins, we applied a state-space model based on a Kalman Filtering algorithm described in Patterson et al. (in press). We used R (R Development Core Team 2008) for all statistical and numerical data analyses. Unless otherwise indicated, results are presented as means ± SD. We used circular statistics (Jammalamadaka & SenGupta Reference Jammalamadaka and SenGupta2001) available in the CircStats package for R (Lund & Agostinelli Reference Lund and Agostinelli2007) to summarize the movement patterns, and presented these results as circular mean ± circular variance. To examine diurnal variations in travel speeds we used time series cross-correlation (the acf function in R, see Venables & Ripley Reference Venables and Ripley2002).
Results and discussion
During the 14 day period (28 January–10 February 2008) of coupled TDR/PTT attachment, the bird undertook 14 feeding trips interspersed with periods of attendance at the colony. Feeding trips typically lasted between 5–15 h (12.4 ± 10.7 h), although one long trip lasted almost 45 h and another lasted ∼17 h. Attendance periods at the colony were quite consistent and typically lasted 8–10 h (9.2 ± 3.6 h). Most trips ranged within 10 km from Nyrøysa, and were either directed offshore from the colony or around to the east side of the island (Fig. 1). Two extended trips occurred, the first in late January to an area ∼32 km to the west/south-west and the other in early February to an area ∼48 km to the north-west. During the week between the removal of the TDR and its final departure from the island the bird undertook six more short trips to areas within 10 km from Nyrøysa, alternating between areas to the west/north-west and areas to the south-east of the island. These patterns all conformed to the general patterns observed in all seven chinstraps tracked during this period.
The focal penguin finally left Bouvetøya around 06h00 on 17 February for a migration towards Montagu Island in the South Sandwich Islands (Fig. 1), where it arrived at Phyllis Bay close to Allen Point at the south-eastern extreme of the island around 15h00 on 8 March, after 22 days at sea. Chinstrap colonies at Montagu Island are estimated to contain c. 5000–20000 breeding pairs, representing ∼1% of the total population in the archipelago (Convey et al. Reference Convey, Morton and Poncet1999). There is a large colony at Allen Point and a smaller colony at Scarlett Point at the western end of Phyllis Bay (Convey et al. Reference Convey, Morton and Poncet1999). The other six penguins also began undertaking longer trips during this period, but none of these reached more than 300 km from Bouvetøya, and all appeared to return to the island between these extended trips.
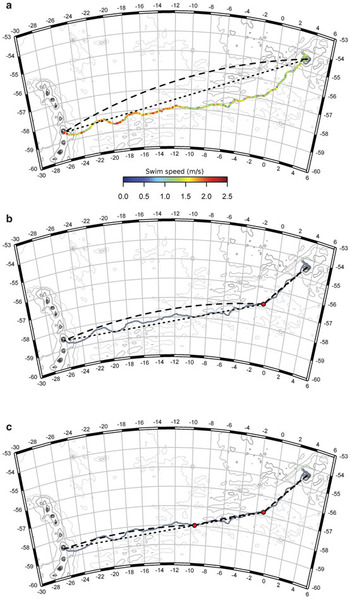
After departure from Nyrøysa the focal bird initially travelled northwards for ∼20 km before it veered towards the west and subsequently south-west (Fig. 1). The track did not follow either the shortest path (i.e. great circle route) or the rhumb line (loxodrome) of constant bearing from Bouvetøya to Montagu Island (Fig. 2a). Instead, the bird initially travelled in a more southerly direction before veering towards the west or southwest. The overall length of the path taken by the bird was 3634 km, representing almost twice the distance the bird would have travelled, had it followed the great circle route between Bouvetøya and Montagu Island.
Track of a chinstrap penguin migrating from Bouvetøya to the South Sandwich Islands. a. The track coloured according to the swim speed. The broken lines represent rhumb lines (loxodromes) of constant bearing while the dotted lines represent great circle routes (i.e. shortest paths) between two points. b. The track and affiliated lines through one breakpoint, and c. the same data viewed with two breakpoints.

Figure 2b & c shows the observed path of the penguin as well as the great circle routes and rhumb lines between one (b) or two (c) breakpoints along the path. These breakpoints were visually selected based on apparent alterations in the general swimming direction. Assuming that these breakpoints reflect true path-alteration events, we can describe the entire path as follows. Following the short northward excursion after leaving Bouvetøya the bird initially travelled in a relatively constant south to south-westerly course over ground (circular mean ± variance = 221.1 ± 14.3 degrees) until 22 February when it had reached a latitude of almost 57°S and a longitude of approximately 1°W. The great circle route and rhumb line from Bouvetøya to this breakpoint are almost identical and the path closely followed these routes. Assuming that no further breakpoints occurred throughout the track, the penguin subsequently followed a west/south-westerly track (circular mean ± variance = 263.8 ± 9.89 degrees) that appeared to be intermediate between the great circle route and the rhumb line to Montagu Island (Fig. 2b).
Assuming the existence of one additional breakpoint, the second segment of the track followed a directed south-westerly path (circular mean ± variance = 255.3 ± 6.8 degrees) until the penguin reached a point at about 58°S and longitude 9.5°W on 28 February (Fig. 2c). While the great circle route and the rhumb line along this segment were again very similar, the penguin track appeared to be slightly closer to the rhumb line. Two consecutive dramatic deviations from this path occurred roughly midway between the two breakpoints. The first deviation towards the west/north-west occurred when the penguin entered a region of strong northerly water flows (Fig. 1), while the subsequent deviation towards the south/south-west coincided with a sharp decrease in this northerly flow, followed by a sharp increase in an easterly and later north-easterly flow (Fig. 1). These sharp spatial variations in ocean currents were associated with a region of high variability in sea surface height anomalies and the occurrence of cyclonic and anticyclonic eddies, the locations of which were relatively stable through time (Fig. 1).
During the remaining migration to Montagu Island the penguin travelled almost due west, and consequently the difference between the rhumb line and great circle route was more pronounced than during previous sections of the track (Fig. 2c). The penguin appeared to follow the rhumb line more closely than the great circle route (circular mean ± variance = 270.3 ± 11.3 degrees), but there were dramatic deviations towards the north and south particularly as the bird came closer to the South Sandwich Islands. These deviations were again closely related to local water flows associated with anticyclonic and cyclonic mesoscale eddies (Fig. 1).
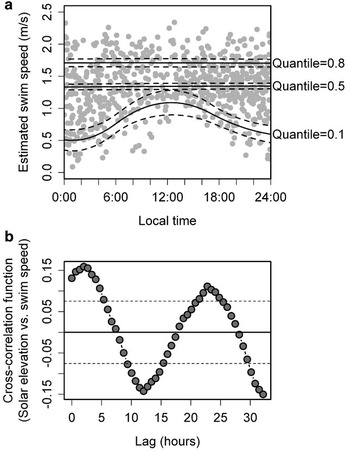
The speed over ground (SOG, calculated here as the minimum speed assuming straight-line continuous travel between two consecutive location fixes) throughout the migration was typically relatively low (1.3 ± 0.5 m s-1), and was lower and more variable at night while speeds slower than 1 m s-1 were rare during the day (Fig. 3a). Figure 3b shows the cross-correlation between solar elevations at time t and SOG at time t + k, where k is a time lag. There were significant positive cross-correlations between solar elevation and SOG for lags between about 0 and 5 hours, indicating that the slowest SOGs were recorded during a period between about 0 and 5 hours after minimum solar elevations, (i.e. in the morning hours) or that the highest speeds were recorded at similar lags after maximum solar elevations (Fig. 3b). The first of these is probably the more significant, given the occurrence of slow speeds only at night (Fig. 3a). Significant negative correlations were similarly observed for lags between 9 and 16 hours, indicating that high speeds were recorded from mid-morning until mid-afternoon. It is possible that the typically slow speeds observed at night indicate night time feeding while en route. It is also possible that these slow speeds are a result of the penguin resting mostly at night to reduce the risk of predation.
a. Diurnal variations in estimated speed over ground (SOG), expressed in m s-1. The lines represent predicted SOG for any given time of day from constrained β-splines fitted through specific quantiles of the data. The lower solid line indicates the lower limit (10% quantile) of SOG as a function of time of day while the middle and top (solid) lines indicate the median and the top limit (80% quantile) of the data respectively. Broken lines represent confidence limits on the predictions. b. Cross correlation function between solar elevation (degrees) and SOG. Values represent the correlation between solar elevation at time t and SOG at time t + lag. Broken, horizontal lines represent approximate confidence intervals for cross-correlations, i.e. values above the upper or below the lower line represent significant positive or negative cross correlations respectively.

There was a marked increase in average SOG from 1 March onwards (Fig. 2a), i.e. a few days after the second breakpoint in the overall direction of movement. This may indicate that during the first half of the migration the penguin was actively searching for food while travelling in the general direction of the target, while during the second half of the trip the emphasis was on more rapid transit towards the targeted location. During the second half of the trip substantial reductions in night-time swim speeds appeared to occur only every second night.
This study is based on a single migratory event performed by one chinstrap penguin. We do not know how common such migrations are in this population, but the other six chinstrap penguins that carried PTTs after the end of the breeding season remained within 300 km of Bouvetøya (Fig. 1) and most probably returned there to moult. This single migration could therefore represent an extremely rare event observed by chance in this study. It is interesting, however, that all studies to date which have described similar long-range migrations, were based on relatively small sample sizes. If such events were extremely rare and infrequent, it seems to us that the probability of observing them in several independent studies, all with small sample sizes, is relatively small. We therefore believe that these long-range migrations between distant colonies are regularly undertaken by a small number of individuals. The geographical epicentre of chinstrap penguin populations is at the South Sandwich Islands (Jammalamadaka & SenGupta Reference Jammalamadaka and SenGupta2001, Trivelpiece et al. Reference Trivelpiece, Buckelew, Reiss and Trivelpiece2007), and colonies in this archipelago represents ∼30% of the global population (Convey et al. Reference Convey, Morton and Poncet1999). The small Bouvetøya population was most probably established during the species expansion during the mid-1900s (Sladen Reference Sladen1964, Conroy Reference Conroy1975). It is therefore plausible that migrations between Bouvetøya and the South Sandwich Islands, such as the one described in this study, reflect ecological ties to ancestral colonies (Trivelpiece et al. Reference Trivelpiece, Buckelew, Reiss and Trivelpiece2007). Based on this small-scale study we obviously cannot estimate how common these types of long-range migrations between distant colonies are, but the fact that they have been independently observed in other studies, also with relatively small sample sizes, suggest to us that they may be more than just rare and infrequent occurrences. If this is the case, such links between relatively distant colonies may have several important implications. Firstly, the fact that the feeding range of penguins from these relatively distant colonies is broad and at least seasonally overlapping is important in terms of the management of krill and krill-dependent predators. Trivelpiece et al. (Reference Trivelpiece, Buckelew, Reiss and Trivelpiece2007) argued that multiple feeding areas would provide a mechanism for safeguarding a population against major local catastrophes. This may be especially important during winter, which is believed to be the most critical period for adult survival and juvenile recruitment. Wintertime adult mortalities of more than 30% have been recorded at some populations in some years (Croxall & Davis Reference Croxall and Davis1999, Hinke et al. Reference Hinke, Salwicka, Trivelpiece, Watters and Trivelpiece2007). The potential for predators to migrate vast distances across the boundaries between several CCAMLR management zones, suggests that we may have to adopt a wider regional strategy to the management of this ecosystem. Secondly, this study shows that chinstrap penguins from different colonies not only utilize overlapping feeding areas at sea, but that there is potential for intermixing of birds between different land based colonies. While this bird visited the South Sandwich Islands during the annual moult rather than during breeding, it nevertheless shows that it is possible that birds are able to switch between colonies. This can have important implications for the transmission of diseases or parasites between colonies and, if it occurs during the breeding season, gene flow and population structure in this species can also be affected by such inter-colony migrations.
Acknowledgements
This study was carried out as part of the 2007–08 Norwegian Antarctic Research Expedition to Bouvetøya. Additional logistical support was kindly provided by the South Africa National Antarctic Program (SANAP). We thank the captain and crew of the S.A. Agulhas for transport to and from the island and Titan Helicopters Ltd for cargo and personnel transfer between the ship and the island. We also thank Weatherhaven Ltd for their prompt manufacture and delivery of a Polarhaven base-camp shelter with very short notice. The constructive criticism and suggestions from two anonymous reviewers substantially improved the quality of the manuscript.