


Highlights
-
LCT pegmatites in the Benin–Nigeria Shield formed during the late Pan-African orogeny.
-
In situ geochronology links metamorphism, magmatism and Li-enrichment processes.
-
A regional metallogenic model guides LCT pegmatite exploration in West Africa.
1. Introduction
Lithium–caesium–tantalum (LCT) pegmatites are the principal source of economically important lithium and play a critical role in the global transition to low-carbon energy technologies. However, the timing of LCT pegmatite formation relative to orogenic evolution varies among different belts and remains an important aspect of understanding their petrogenesis. In this study, syn-orogenic refers to pegmatite emplacement during active crustal shortening and deformation, late-orogenic refers to emplacement during the waning stages of orogenesis when deformation has largely ceased, but elevated crustal temperatures and magmatic activity persist, and post-orogenic refers to emplacement following the cessation of orogenic processes during extensional collapse or post-collisional tectonic evolution. Worldwide, LCT pegmatites have been reported in syn-, late- and post-orogenic settings, reflecting a range of geodynamic environments and melt-generation mechanisms (e.g. Černý Reference Černý1991; London, Reference London2008; Gourcerol et al. Reference Gourcerol, Gloaguen, Melleton, Tuduri and Galiegue2019; Ballouard et al. Reference Ballouard, Carr, Monnier, Fidalgo, Rocher, Esteves, Laurent, Daoulas-Gérardin, Peiffert, Declercq, Mercadier, Plunder and Melleton2026; Carr et al. Reference Carr, Ballouard, Marignac, Cathelineau, Noronha, Michaud, González, Timón Sánchez and Mercadier2026). For example, some LCT pegmatites have been documented in syn- or post-orogenic extensional settings in regions such as the Variscan Belt of Europe (Melleton and Gloaguen, Reference Melleton, Gloaguen and Frei2015) and parts of the North American Cordillera (Bradley et al. Reference Bradley, Shea, Buchwaldt, Bowring, Benowitz, O’Sullivan and McCauley2016; Bradley Reference Bradley2019). Nevertheless, the dominant global pattern remains late-orogenic, as documented across many regions (Araújo et al. Reference Araújo, da Silva and de Sá2001; Černý and Ercit Reference Černý and Ercit2005; Silva et al. Reference Silva, Groat, Martins and Linnen2023; Gardiner et al. Reference Gardiner, Palin, Koopmans, Mangler and Robb2024; Liu et al. Reference Liu, Kohn, Wang, He and Wang2024; Acke et al. Reference Acke, Dewaele, Barros, Burlet, Nachtergaele, Uwiringiyimana, Fußwinkel and Borst2025; Koopmans et al. Reference Koopmans, Gardiner, St, Richard, Rutendo and Robb2025), and reflects the tectonic controls on the distribution of lithium mineralization across orogenic belts, as well as the role of regional deformation in pegmatite migration and emplacement. Globally, the petrogenetic processes responsible for LCT pegmatite formation remain debated. LCT pegmatites and associated rare-metal granites commonly occur as genetically and spatially related components of rare-metal magmatic systems (Melcher et al. Reference Melcher, Graupner, Gäbler, Sitnikova, Henjes-Kunst, Oberthür, Gerdes and Dewaele2015, Reference Melcher, Graupner, Oberthür and Schütte2017). LCT pegmatite-forming melts are thought to result either from (1) extreme fractional crystallization of felsic magmas (Černý Reference Černý1991; Černý and Ercit Reference Černý and Ercit2005; London Reference London2005), or (2) from low degree partial melting of either metasedimentary rocks (Simmons et al. Reference Simmons, Falster, Webber, Roda-Robles, Boudreaux, Grassi and Freeman2016; Müller et al. Reference Müller, Romer and Pedersen2017; Konzett et al. Reference Konzett, Schneider, Nedyalkova, Hauzenberger, Melcher, Gerdes and Whitehouse2018), or (3) from the remelting of felsic intrusions that have already undergone fractional crystallization (Ballouard et al. Reference Ballouard, Couzinié, Bouilhol, Harlaux, Mercadier and Montel2023; Koopmans et al. Reference Koopmans, Martins, Linnen, Gardiner, Breasley, Palin, Groat, Silva and Robb2023). A key method for distinguishing between these models is determining the timing of LCT pegmatite crystallization in relation to regional felsic magmatism and orogeny. Pegmatites formed by extreme fractional crystallization are expected to crystallize at the same time as the regional magmatism event, whereas those resulting directly from anatexis of metasediments, or from remelting of earlier granitoids, would have younger crystallization ages, post-dating the regional magmatism. Moreover, a lag between the timing of regional magmatism and pegmatite crystallization age may be indicative of the tectonic processes that facilitated their formation, either a fractionation or a remelting event.
The Benin–Nigerian Shield, situated south of the Trans-Saharan Orogenic Belt in Northwest Africa, is a Pan-African belt that has undergone significant crustal thickening. With widespread emplacement of voluminous (predominantly) calc-alkaline felsic intrusions and various lithium ores (e.g. spodumene, lepidolite, petalite and amblygonite), the Benin–Nigerian Shield is one of the least explored LCT provinces in Africa. These systems host lithium of high economic potential that has the capacity to transform the region economically if fully exploited. This study investigates three key regions along a west–east transect of the southern Benin–Nigerian Shield: the Ife–Ilesha Schist Belt in the central southwestern basement, the Igarra Schist Belt on its eastern margin and the southern portion of the Oban Massif. Within these three focus regions, we document the timing of granite emplacement, the timing and conditions of peak-metamorphism, and the timing of LCT pegmatite emplacement in the central west, all of which are consistent with late- to post-orogenic mineralization in thermally matured crust.
2. Geological background
The Trans-Saharan Mobile Belt (TSMB) is the principal Pan-African orogenic structure in northwestern Africa. The TSMB is a major Neoproterozoic collisional belt delineated by the West African Craton to the west, the Saharan Metacraton to the northeast and the Congo Craton to the south of the Central African Fold Belt (Figure 1). In addition to these three major cratonic blocks, the TSMB also comprises several Precambrian basement provinces such as the Central Hoggar Shield in Algeria, the Aïr Shield in Niger and the Benin–Nigerian Shield (Figure 1a). The present configuration of the belt is generally interpreted to represent remnants of the Precambrian Goiás–Pharusian oceanic domain, which was progressively closed during the Pan-African orogenic cycle (∼950–500 Ma; Ferré et al. Reference Ferré, Gleizes and Caby2002). Collisional interactions among these cratons resulted in the development of prominent north–south-trending regional structures throughout the TSMB. These tectonic events also produced a network of major dextral shear zones and transcurrent fault systems that extend from northwestern Africa into parts of the Paleo-Neoproterozoic basements in West and Central Africa (Figure 1a), reflecting the broader geodynamic framework of West Gondwana assembly.
(a) Structural map of Northwest Africa showing the Pan-African nappe system and the Benin–Nigerian shield (modified after Ugwuonah et al. Reference Ugwuonah, Tsunogae and Ekwueme2019; Nweke et al. Reference Nweke, Ugwuonah, Onuba and Egbueri2024); (b) Map of the Nigerian basement complex (modified after Nweke et al. Reference Nweke, Ugwuonah, Onuba and Egbueri2024; Nweke Reference Nweke2025; Cao et al. Reference Cao, Chen, Jiang, Garba, Li, Chao, Hu and Lv2024). The black star and associated 572–548 Ma age range indicate the Nassarawa–Keffi rare-metal pegmatite belt and published cassiterite U–Pb ages reported by Cao et al. (Reference Cao, Chen, Jiang, Garba, Li, Chao, Hu and Lv2024).

The Benin–Nigerian Shield (Figure 1b), one of the Pan-African provinces, forms a significant portion of the West African Precambrian basement complex, comprising exposures of magmatic and metamorphic units ranging in age from Paleoarchean to Neoproterozoic (Oshin and Rahaman Reference Oshin and Rahaman1986; Kröner et al. Reference Kröner, Ekwueme and Pidgeon2001). This shield is partially exposed in Nigeria, where it underlies approximately two-thirds of the country’s surface geology (Oshin and Rahaman Reference Oshin and Rahaman1986). Geographically, it occupies the southernmost part of the TSMB and is bounded to the west by the >2.0 Ga West African Craton and to the east and southeast by the Central African Fold belt and Congo Craton, respectively (Turner Reference Turner1983; Woakes et al. Reference Woakes, Rahaman and Ajibade1987; Caby Reference Caby1989; Kröner et al. Reference Kröner, Ekwueme and Pidgeon2001; Ukwang et al. Reference Ukwang, Ekwueme and Horsley2003) (Figure 1).
The Benin–Nigerian Shield has been regionally subdivided into three principal domains based on geographical occurrences: the north-central, southwestern and southeastern basement complexes (Rahaman Reference Rahaman1973; Odeyemi Reference Odeyemi and Kogbe1976, Reference Odeyemi1977; Rahaman et al. Reference Rahaman, Ajayi, Oshin, Asubiojo and Oluyide1988; Olarewaju and Rahaman Reference Olarewaju and Rahaman1982; Ekwueme and Ekwere Reference Ekwueme and Ekwere1989; Ekwueme Reference Ekwueme1990) (Figure 1b). Structural and geophysical analyses have led to the further subdivision of the basement into two distinct domains: the Eastern and Western Terranes (Ferré et al. Reference Ferré, Déleris, Bouchez, Lar and Peucat1996, Reference Ferré, Gleizes and Caby2002) (Figure 1b). These terranes are separated by a prominent ∼500 km-long north–south structural lineament located near longitude 8°E (Figure 1b). This lineament was first recognized through the interpretation of spatial lineament density from Landsat imagery (Ananaba and Ajakaye Reference Ananaba and Ajakaiye1987). The Western Terrane of the shield is characterized by synclinally folded schist belts that are infolded into a migmatitic basement of upper amphibolite-facies (Oyawoye Reference Oyawoye, Dessauvagie and Whiteman1972). In contrast, the Eastern Terrane hosts significant uranium mineralization and is dominated by Paleoproterozoic plutons, Neoproterozoic Pan-African granitoids and Jurassic younger post-orogenic granites intruding a granulite-facies basement (Dickson et al. Reference Dickson, Halliday and Bowden1991; Ferré et al. Reference Ferré, Déleris, Bouchez, Lar and Peucat1996; Ukwang et al. Reference Ukwang, Ekwueme and Horsley2003; Ugwuonah et al. Reference Ugwuonah, Tsunogae and Ekwueme2019).
The Benin–Nigerian shield was affected by multiple orogenic cycles, with structural and metamorphic imprints from the Liberian (∼2700 Ma), Eburnean (∼2200 Ma), Kibaran (∼1400 Ma) and Pan-African (∼900–600 Ma) events (Odeyemi Reference Odeyemi1981). Vestiges of these tectonothermal episodes are preserved in rocks across the Nigerian terrain and have been documented in several studies (e.g. Fitches et al. Reference Fitches, Ajibade, Egbuniwe, Holt and Wright1985; Ekwueme Reference Ekwueme1987; Ajibade Reference Ajibade1988; Ekwueme and Caen-Vachette Reference Ekwueme and Caen-Vachette1992; Kröner et al. Reference Kröner, Ekwueme and Pidgeon2001; Ekwueme and Kröner Reference Ekwueme and Kröner2006). Although overprinted by the extensive magmatism, deformation and metamorphism associated with the Pan-African orogeny, relics of earlier orogenic fabrics and structures remain preserved in some metamorphic complexes (Oyawoye Reference Oyawoye, Dessauvagie and Whiteman1972; Rahaman Reference Rahaman1976; Onyeagocha and Ekwueme Reference Onyeagocha and Ekwueme1982; Ekwueme Reference Ekwueme1987, 1994).
2.a. LCT pegmatite mineralization
The southern Benin–Nigerian Shield is notably enriched in LCT pegmatites; however, the timing and tectonomagmatic context of their formation remain poorly understood. Two principal types of rare-metal mineralization associated with tin (Sn), niobium–tantalum (Nb–Ta), lithium (Li), beryllium (Be) and zinc (Zn) have been identified within the Benin–Nigerian Shield (Kinnaird Reference Kinnaird1984). These types differ markedly in age, tectonic setting, mineralogy and geochemistry. They are hosted within two distinct lithological suites: (1) Proterozoic pegmatites and (2) Jurassic ring-complex granites, commonly referred to as the ‘Younger Granites’ (Kinnaird Reference Kinnaird1984; Matheis and Emofurieta Reference Matheis and Emofurieta1990; Melcher et al. Reference Melcher, Graupner, Oberthür and Schütte2017). Although the pegmatites are integral to the Neoproterozoic crustal architecture of the shield, the Jurassic ring complexes represent later, alkaline, anorogenic intrusions along hotspot-related lineaments of the TSMB, extending from the Aïr region (Niger) to the Afu complex in central Nigeria (Wright Reference Wright1985).
Kinnaird (Reference Kinnaird1984) further subdivided the Paleoproterozoic Pan-African pegmatites into barren and mineralized types. These bodies typically occur as dykes and sheets intruding metasedimentary units (e.g. schists), amphibolites, paragneisses, migmatites and granitic host rocks. Their emplacement postdates the syn- to post-tectonic Pan-African granites (c. 640–580 Ma), with crystallization ages spanning c. 560–450 Ma (Ferré et al. Reference Ferré, Gleizes and Caby2002; Goodenough et al. Reference Goodenough, Lusty, Roberts, Key and Garba2014; Bute et al. Reference Bute, Yang, Cao, Liu, Deng, Haruna, Girei, Abubakar and Akhtar2020; Cao et al. Reference Cao, Chen, Jiang, Garba, Li, Chao, Hu and Lv2024). Early classifications based on mineralogical assemblages include microcline–quartz, microcline–quartz–mica and quartz–mica pegmatites (Kinnaird Reference Kinnaird1984; Adetunji and Ocan Reference Adetunji and Ocan2010a).
A dominant northeast–southwest trend of pegmatite mineralization has been mapped from Ife–Ilesha through the Eastern terrane, interpreted as structurally controlled by Pan-African dextral shear zones (Kinnaird Reference Kinnaird1984; Woakes et al. Reference Woakes, Rahaman and Ajibade1987; Adetunji and Ocan Reference Adetunji and Ocan2010a; Goodenough et al. Reference Goodenough, Lusty, Roberts, Key and Garba2014; Cao et al. Reference Cao, Chen, Jiang, Garba, Li, Chao, Hu and Lv2024). Mineralization intensity appears to increase from the southern to the north-central portions of the shield (Wright Reference Wright1970; Adetunji and Ocan Reference Adetunji and Ocan2010a). Nevertheless, pegmatite mineralization is not confined to this structural trend, with additional occurrences in southeastern Nigeria, specifically within the Oban Massif and the Adamawa Massif, suggesting multiple pegmatite districts of potentially varied magmatic sources and emplacement histories.
To date, only a few preliminary geochronological studies have investigated pegmatites in the north-central segment of the shield; Matheis & Caen-Vachette (Reference Matheis and Caen-Vachette1983) reported whole-rock Rb–Sr crystallization ages between c. 560 and 450 Ma. These dates fall within the late to post-orogenic period and mark the final stages of Pan-African magmatism in the Trans-Saharan Orogenic Belt. More recently, Cao et al. (Reference Cao, Chen, Jiang, Garba, Li, Chao, Hu and Lv2024) presented cassiterite and zircon U–Pb ages ranging between c. 570–548 Ma for LCT pegmatites in central Nigeria. These dates overlap with the regional emplacement age of most granites within the region (Bute et al. Reference Bute, Yang, Girei, Kayode and Lu2022).
Despite these advances, the temporal and petrogenetic evolution of LCT pegmatites in the southern Benin–Nigerian Shield remains largely unexplored. Constraining the timing of pegmatite emplacement relative to regional deformation, magmatism and metamorphism, alongside characterizing their source lithologies and the depth of emplacement, would provide critical insights into the evolution of these mineral systems. Furthermore, new geochronological and metamorphic information would contribute to a broader understanding of the role of the Benin–Nigerian Shield in the late stages of Gondwana assembly.
3. Materials and methods
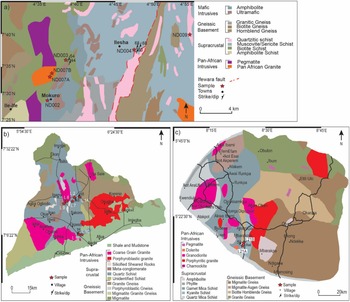
This study focuses on a west-to-east transect across three key regions of the southern Benin–Nigerian Shield (Figures 1b and 2) and integrates petrological, geochronological and thermodynamic approaches. Geochronological techniques include in situ Rb–Sr dating of mica, Lu–Hf dating of garnet, U–Pb dating of monazite and titanite and phase equilibrium modelling. All analyses were conducted at the Fipke Laboratory for Trace Element Research (FiLTER), University of British Columbia, Kelowna, Canada. A total of 34 rock samples were collected from three regions, the Oban Massif, Igarra Schist Belt, and Ife–Ilesha Schist Belt, with structural orientations recorded (see Supplementary Table 1). Six thin sections representative of the regional transect were selected for geochronological analysis based on the availability of suitable mineral assemblages. These include three metasedimentary samples (ND003-2, Igarra L1A and ND021A) from the Ife-Ilesha and Igarra Schist Belts and the Oban Massif; two granitic samples (ND007A and L9) from the Ife-Ilesha and Igarra Schist Belts; and one LCT pegmatite sample from the Igarra Schist Belt (Igarra 1C).
(a) Geological map of the Ife–Ilesha Schist Belt (modified after Ige et al., Reference Ige, Okrusch, Schüssler, Schmädicke and Cook1998; Nweke Reference Nweke2025); (b) Geological map of the Igarra Schist Belt (modified after Nweke et al. Reference Nweke, Ugwuonah, Onuba and Egbueri2024; Nweke Reference Nweke2025); (c) Geological map of the Oban Massif (modified after Ekwueme Reference Ekwueme1987; Nweke Reference Nweke2025; the Nigerian Geological Survey Sheet map of Cross River State).

Figure 2. Long description
Panel A: Geological map of the Ife–Ilesha Schist Belt. The map shows different rock types such as mafic intrusives, amphibolite, ultramafic, gneissic basement, quartzite schist, and supracrustal rocks. It also marks sample locations, towns, and the Ifewara fault. Panel B: Geological map of the Igarra Schist Belt. This map includes shale and mudstone, coarse grain granite, porphyroblastic granite, and other rock types. It marks sample locations, villages, and strike/dip measurements. Panel C: Geological map of the Oban Massif. This map shows pan-African intrusives, pegmatite, dolerite, granodiorite, porphyritic granite, and charnockite. It also marks sample locations, villages, and strike/dip measurements.
3.a. Geochronology
All geochronological analyses were carried out using an Elemental Scientific Lasers (ESL) New Wave Research (NWR) 193 nm laser with a TwoVol3 ablation cell paired with an Agilent 8900 tandem inductively coupled plasma mass spectrometer (ICP-MS). Rb–Sr geochronology of mica (biotite, muscovite and lepidolite) was carried out on thin sections from all three study regions following the instrumentation set-up and data reduction approach of Larson et al. (Reference Larson, Button, Shrestha and Camacho2023, Reference Larson, Cottle, Button, Dyck, Lihter and Shrestha2024, Reference Larson, Dyck, Cottle, Canam and Milkowski2025). Lu–Hf dating of garnet (Simpson et al. Reference Simpson, Gilbert, Tamblyn, Hand, Spandler, Gillespie, Nixon and Glorie2021) was performed on two of the thin sections of the metasedimentary host rock from the Ife/Ilesha and the Igarra Schist belts, following the approach outlined in Larson et al. (Reference Larson, Cottle, Button, Dyck, Lihter and Shrestha2024). Finally, U–Pb dating of monazite and titanite was performed in two thin sections, a metasedimentary host rock and a granite from the Igarra Schist belt, following the approach outlined by McKinney et al. (Reference McKinney, Cottle and Lederer2015). The dates returned for all secondary reference materials used in each run are presented in Supplementary Tables 2–4 for mica Rb–Sr, garnet Lu–Hf, titanite and monazite U–Pb, respectively, and the full datasets for all spots are provided in the Supplementary Tables 5–7. The uncertainties associated with the data are reported as two standard errors (2SEs) of the mean. Plots of geochronological data were prepared using the ChrontourR package for the open R platform (Larson Reference Larson2020). Regressions were calculated using the method of Powell et al. (Reference Powell, Green, Marillo and Woodhead2020), wherein dispersion is expressed as an ‘s’ value that indicates the robustness of the spine of the main regression (larger = more dispersion). If the distribution is Gaussian, s should range around 1, similar to mean-squared weighted deviates.
3.b. Mineral chemistry
The chemical composition of major mineral phases in a metapelite thin section (ND003) from the Ife–Ilesha Schist Belt, with a suitable mineral assemblage for pressure and temperature determination, was obtained using a CAMECA SX-Five electron microprobe analyser (EMPA), housed at FiLTER. The probe operational conditions include an accelerating voltage of 15 kV, 20 nA beam current, 20 s counting time on the peaks, 10 s background position and a 5 µm beam spot size. Details of mineral calibration are provided in Supplementary Table 8. The EMPA dataset reduction was done following the steps outlined by Pouchou and Pichoir (Reference Pouchou and Pichoir1985). Spot locations for analysis on all mineral phases were chosen to be representative of the variety of petrographic positions (i.e. matrix, porphyroblast core and rim). Multiple spots were collected across the thin section to identify both inter- and intra-crystalline compositional variety. The full EMPA dataset is presented in Supplementary Table 8.
3.c. Petrological modelling
To determine the pressure and temperature (P–T) conditions at which the rocks of the southwestern Nigerian basement were metamorphosed, we performed phase diagram-based petrological modelling following the approach of Dyck et al. (Reference Dyck, Waters, St-Onge and Searle2020) using the Theriak-Domino Gibbs minimization software (de Capitani and Petrakakis Reference de Capitani and Petrakakis2010) and the thermodynamic dataset ds-55 (Powell and Holland, Reference Holland and Powell1998). Phase equilibrium was modelled in the Na2O–CaO–K2O–FeO–MgO–MnO–Al2O3–SiO2–H2O–TiO2–O2 (NCKFMASHTO) system using the activity–composition relations of White et al. (Reference White, Powell, Holland, Johnson and Green2014), which were developed for pelitic bulk compositions. Dataset ds-55 was chosen over the newer ds-62 as it better replicates the stability and composition of garnet in low-to-moderate pressure metapelitic rocks (e.g. Dyck et al. Reference Dyck, Goddard, Wallis, Hansen and Martel2021; McKenzie et al. Reference McKenzie, Dyck, Gibson and Larson2024; Bowie et al., Reference Bowie, Gibson, Dyck, Godin and Larson2025). Uncertainty on pressures and temperatures associated with assemblage boundaries, isopleths and isomodes on metamorphic phase diagrams is estimated to be ±20–30°C and ±0.05 GPa at 1σ (Palin et al. Reference Palin, St-Onge, Waters, Searle and Dyck2014). Water was considered in excess, and thus only conditions below the solidus were considered.
4. Results
Given the lithological variability along this transect and the corresponding differences in the applicability of geochronological and petrological modelling techniques, it was not possible to implement a uniform analytical framework across all areas. Instead, the approach was tailored to maximize the quality and reliability of geochronological and P–T data in each region, enabling the construction of a robust, regionally integrated tectonothermal interpretation. The following sections describe the lithological characteristics, mineral assemblages, geochronological datasets and phase equilibrium modelling results for each area. Together, these data provide new constraints on the tectonometamorphic evolution of the southern segment of the Benin–Nigerian Shield. All mineral abbreviations are after Whitney and Evans (Reference Whitney and Evans2010).
4.a. Ife–Ilesha Schist Belt
4.a.1. Petrography and mineral chemistry of representative samples
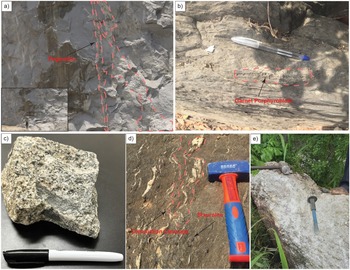
Sample ND007A is a muscovite–biotite leucogranite collected from the Itanrin quarry, approximately 500 m east of the Ile–Ife Road near Ife Town, Osun State, Nigeria (Figures. 2a and 3a). The quarry exposes over 500 m of homogeneous leucogranite, intruded by a coarse-grained pegmatitic biotite granite (sample ND007B). Petrographic analysis of ND007A reveals an igneous mineral assemblage, comprising quartz (∼33%), orthoclase (∼30%), plagioclase (∼24%), biotite (∼4%), muscovite (∼8%) and accessory apatite (<1%).
Representative field photographs of the principal lithological units and structures investigated in this study. (a) Leucogranite intruded by a pegmatite dyke (sample ND007A), Ife–Ilesha Schist Belt. (b) Road-cut exposure of garnet–biotite schist showing garnet porphyroblasts (sample Igarra L1A), Igarra Schist Belt. (c) Biotite granite containing a metapelitic xenolith (sample Igarra L9), Igarra Schist Belt. (d) Staurolite-bearing schist showing crenulation cleavage and staurolite porphyroblasts (sample ND003), Ife–Ilesha Schist Belt. (e) Lepidolite-bearing LCT pegmatite dyke (sample Igarra L1C), Igarra Schist Belt.

Sample ND003 is a garnet–staurolite-bearing schist collected from an outcrop east of the Ilesha–Akure expressway in the Osu area, Osun State, Nigeria (Figures 2a and 3b–e). The schist is fine-grained, with porphyroblastic staurolite grains (Figure 3d) and exhibits a consistent north–south foliation with an easterly dip of 44–54° (Figure 3d). The rock is cut by foliation-parallel quartz veins, which are highly deformed and display boudinages and ptygmatic folding (Figure 3d). Two thin sections (ND003-1 and ND003-2) were prepared for detailed petrographic and mineral chemical analysis.
The thin section of sample ND003-1 contains quartz (∼30%), plagioclase (∼28%), biotite (∼17%), muscovite (∼19%), garnet (∼2%), staurolite (∼2%), chlorite (∼1%) and accessory apatite (∼1%). The thin section ND003-2 comprises biotite (∼30%), quartz (∼30%), muscovite (∼17%), plagioclase (∼17%), staurolite (∼4%), garnet (∼1%) and chlorite (∼1%) (Figure 4a–d). The foliation in both sections is defined by the preferred orientation of biotite and muscovite, in addition to the alignment of elongated quartz and feldspar grains. Zircon, quartz and opaque minerals exist as inclusions in most of the garnet and staurolite porphyroblasts. Garnet and staurolite occur as post-kinematic porphyroblasts (up to 2 mm) that overgrow the main foliation, consistent with crystallization during a thermal overprint that post-dates the main foliation-forming deformation event (Figure 4b–d).
Petrological features in metapelite, ND003 (Ife–Ilesha Schist Belt) and Igarra LA1 (Igarra Schist Belt). (a) Quartz porphyroclast wrapped by the main mica-defined foliation in sample ND003; (b) Garnet–staurolite–biotite–chlorite association, ND003; (c – d) static thermal overprinting of post-kinematic garnet and syn-to-post-kinematic staurolite growth on the foliation planes of mica, ND003; (e) Static growth of post-kinematic garnet on the foliation planes of biotite, Igarra LA1; (f) Fine-grained biotite defining the main foliation of the rock surrounded by micro- and porphyroclastic quartz matrices, Igarra LA1.

Figure 4. Long description
Panel A: A cross-sectional view of a metapelite sample labeled ND003. Quartz porphyroclasts are wrapped by the main mica-defined foliation. Panel B: A cross-sectional view of a metapelite sample labeled ND003. It shows an association of garnet, staurolite, biotite, and chlorite. Panel C: A cross-sectional view of a metapelite sample labeled ND003. It displays static thermal overprinting of post-kinematic garnet and syn-to-post-kinematic staurolite growth on the foliation planes of mica. Panel D: A cross-sectional view of a metapelite sample labeled ND003. It shows static thermal overprinting of post-kinematic garnet and syn-to-post-kinematic staurolite growth on the foliation planes of mica. Panel E: A cross-sectional view of a metapelite sample labeled Igarra LA1. It shows static growth of post-kinematic garnet on the foliation planes of biotite. Panel F: A cross-sectional view of a metapelite sample labeled Igarra LA1. It shows fine-grained biotite defining the main foliation of the rock surrounded by micro- and porphyroclastic quartz matrices.
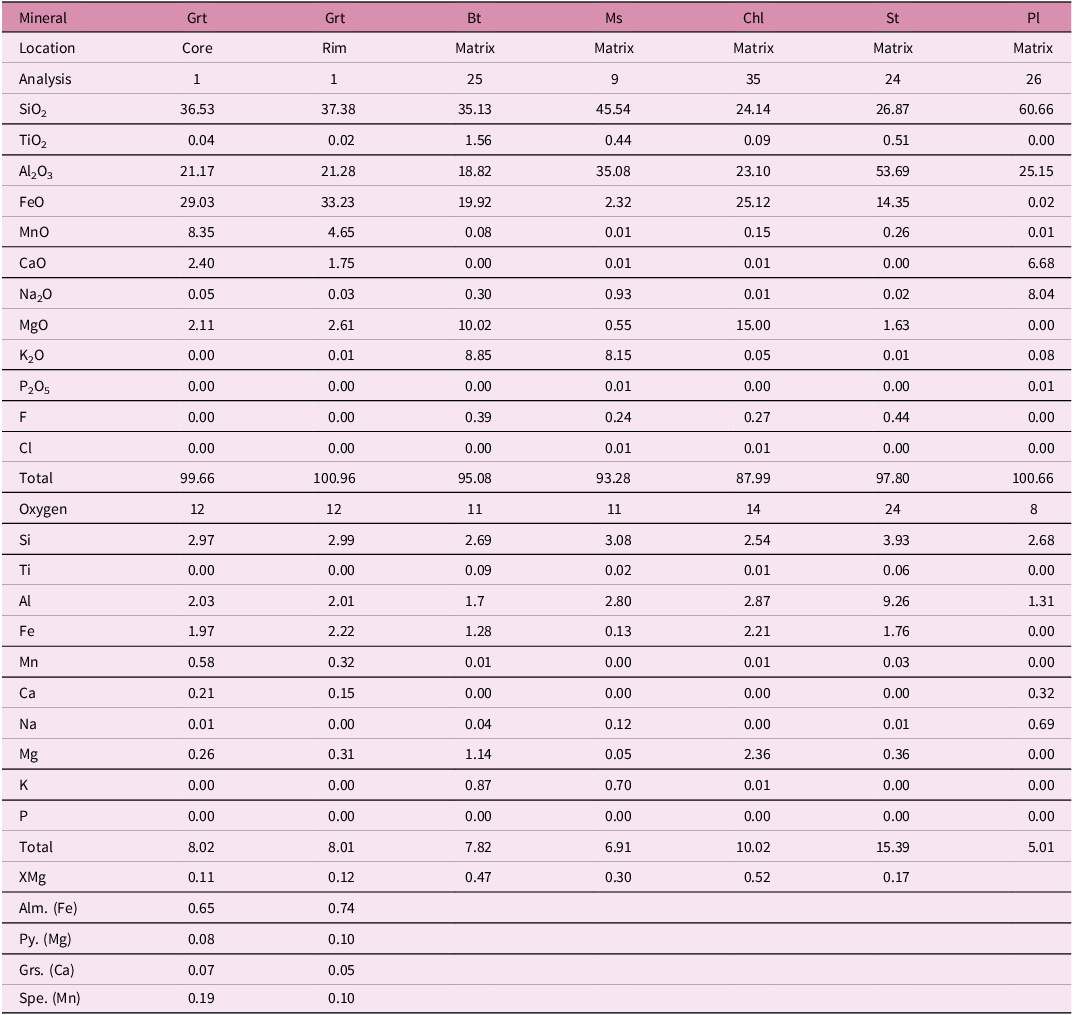
EMPA across garnet grains reveals a bell-shaped Mn zoning profile (Figure 5a–b), interpreted to reflect prograde growth (Carlson and Schwarze Reference Carlson and Schwarze1997). Garnet cores exhibit average end-member compositions of almandine (∼0.65), pyrope (∼0.085), grossular (∼0.07) and spessartine (∼0.19) (see Table 1). Towards the rims, almandine increases to ∼0.74, pyrope to ∼0.10, whereas grossular and spessartine decrease to ∼0.05 and ∼0.10, respectively.
Garnet compositional line profiles from the Ife–Ilesha Schist Belt. (a) Rim-to-rim profiles of garnet end-member mole fractions for ND003-1. (b) Plane polar micrograph of a garnet porphyroblast surrounded by phyllosilicates and staurolite matrix. Location of probe points marked by red circles.

Representative mineral compositions (wt.% oxides and cations per formula unit) for sample ND003

Table 1. Long description
The table presents mineral compositions in weight percent oxides and cations per formula unit for various minerals and locations. It includes data for garnet (Grt) core and rim, biotite (Bt) matrix, muscovite (Ms) matrix, chlorite (Chl) matrix, staurolite (St) matrix, and plagioclase (Pl) matrix. The table has 26 rows and 12 columns, with column headers including mineral types, locations, analysis numbers, and various oxide and cation measurements. Each row provides specific values for each mineral and location combination. Notable trends include variations in oxide and cation concentrations across different minerals and locations.
Matrix biotite shows XMg = 0.46–0.47, Ti = 0.09–0.10 cations per formula unit (cpfu) normalized to 11 oxygen and Aliv = 5.27–5.30. Biotite adjacent to garnet ranges in XMg from 0.45–0.48, Ti = 0.09 cpfu and Aliv = 5.31–5.39, whereas grains adjacent to staurolite show slightly higher XMg (0.49–0.50), Ti = 0.08–0.09 cpfu and Aliv = 5.31–5.33. Matrix muscovite has XMg = 0.30–0.31, Aliv = 4.88–4.95 and XNa = 0.11–0.18, normalized to 11 oxygen, whereas muscovite adjacent to garnet varies more widely in XMg (0.23–0.31), with Aliv = 4.94–4.95 and XNa = 0.11–0.13. Chlorite consistently shows XMg = 0.50–0.54, Fe = 2.2–2.3, Mn = 0.011–0.015, Ti = 0.006–0.01 and Mg = 2.3–2.4 cpfu, normalized to 14 oxygen. Staurolite has XMg = 0.15–0.18, Fe = 1.66–1.80, Mn = 0.026–0.037, Ti = 0.050–0.059 and Mg = 0.29–0.39, cpfu-normalized to 24 oxygen. Matrix plagioclase has XAb = 0.66–0.69 and XOr = 0.003–0.006.
These mineralogical and microstructural features indicate that the schist experienced amphibolite-facies metamorphism under static thermal conditions, with garnet and staurolite growth occurring after the main foliation development.
4.a.2. In situ mica Rb–Sr
Rb–Sr isotopic dating was conducted on two samples from the Ife–Ilesha Schist Belt: ND007A (muscovite–biotite leucogranite) and ND003-1 (garnet–staurolite schist). For sample ND007A, 97 spot analyses of muscovite and plagioclase define an errorchron (over-dispersed regression) at c. 559 Ma (Figure 6a). The spot muscovite data across multiple cores and rims of parallel grains and porphyroclast spread between an upper bound of 575 ± 2 Ma and a lower bound of 521 ± 5 Ma (Figure 6b–c). Ninety-five analyses of biotite and plagioclase produce an isochron of 524 ± 3 Ma (Figure 6d), overlapping the younger white mica bound.
Isochron diagrams for in situ Mica Rb/Sr and Garnet Lu–Hf from the Ife–Ilesha Schist Belt. (a) Rb–Sr isochron result from muscovite spot analyses on granitic sample ND007A (all textures); (b–c) Rb–Sr isochron results from muscovite spot analyses on sample ND007A, showing variable textures; (d) Rb/Sr isochron result for biotite spot analysis on ND007A; (e) Rb/Sr isochron result for muscovite spot analysis on ND003; (f) Rb/Sr isochron result for biotite spot analysis on ND003. (g) Garnet Lu/Hf isochron plot for sample ND003.

In sample ND003-1, 93 biotite–plagioclase spot analyses yielded an isochron age of 507 ± 3 Ma (Figure 6e), whereas 92 muscovite–plagioclase analyses returned an age of 542 ± 14 Ma (Figure 6f).
4.a.3. In situ garnet Lu–Hf
Sample ND003-1 was also analysed for garnet Lu–Hf geochronology. A total of 81 spot analyses conducted across multiple garnet porphyroblasts yield a single population isochron at 546 ± 11 Ma (Figure 6g). The dataset includes analyses from both core and rim domains of individual garnet grains and indicates no significant intracrystalline isotopic variation.
4.a.4. Pressure–temperature modelling
ND003-1 – lower amphibolite-facies schist
Sample ND003–1 was selected for quantitative P–T analysis using petrological modelling. This sample was chosen for two primary reasons: (1) it represents the only Al-rich metapelitic supracrustal lithology identified across all three study regions, and (2) the presence of post-kinematic garnet and staurolite porphyroblasts provides a robust opportunity to constrain the crustal depths and thermal gradients associated with the late stages of metamorphism, specifically during static garnet growth.
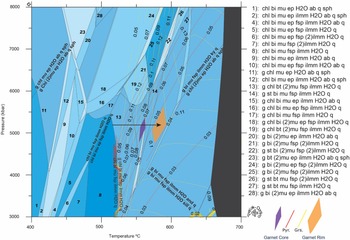
The garnet-in reaction between 3 and 5 kbar occurs at 525 ± 30°C (Figure 7). By matching the modelled compositional isopleths to the observed core chemistry of garnet, the conditions of initial garnet growth are estimated at 5.3 ± 0.5 kbar and 560 ± 30°C. Final equilibration of garnet rims is inferred at 5.5 ± 0.5 kbar and 590 ± 30°C. Throughout the modelled P–T trajectory, biotite and muscovite minerals remain stable, with staurolite predicted to crystallize in the temperature range of 525–580°C, coeval with garnet growth.
Calculated P–T pseudo-section for metapelite sample from the Ife–Ilesha Schist Belt ND003 using ds_55 (Powell and Holland 1998). Relevant fields are contoured for pyrope and grossular isopleths mode (legend, bottom right). The purple polygon represents the garnet core, and the orange polygon represents the rim composition.

Figure 7. Long description
A phase diagram representing the relationship between pressure and temperature for a metapelite sample from the Ife-Ilesha Schist Belt. The x-axis represents temperature in degrees Celsius, ranging from 400 to 700 degrees Celsius. The y-axis represents pressure in kilobars, ranging from 3000 to 8000 kbar. The diagram is contoured with isopleths for pyrope and grossular modes, as indicated by the legend at the bottom right. The purple polygon represents the garnet core composition, and the orange polygon represents the garnet rim composition. Various fields are labeled with different mineral assemblages and conditions, such as ‘chl bi mu ep H2O ab q sph’ and ‘g chl bi mu fsp ilmm H2O q’. Arrows indicate specific paths or transitions within the diagram.
4.b. Igarra Schist Belt
4.b.1. Petrography and field relations of the Igarra Schist Belt and associated intrusions
The Igarra Schist Belt, like most other parts of the Nigerian basement, is predominantly made up of migmatite-gneiss with minor exposure of infolded supracrustal rocks, all of which are intruded by Pan-African plutons. The intrusive lithologies include biotite granite, leucogranite and LCT pegmatite.
Samples Igarra L1A and L2 are biotite schists collected from an outcrop located along a village road off Ojirami-Oke Road, northeast of Igarra in Edo State, Nigeria (Figure 3b). The outcrop exhibits a steep foliation-dipping 88° southwest with a strike of 015°. The schist is fine-grained and characterized by a pervasive, uniform foliation (Figure 4e–f). Petrographic analysis of sample L1A reveals a mineral assemblage of plagioclase (∼43%), biotite (∼32%), quartz (∼23%), garnet (∼1%) and accessory zircon (∼1%) (Figure 4e–f). Sample L2 shows similar mineralogy, comprising plagioclase (∼56%), quartz (∼25%), biotite (∼18%) and garnet (∼1%). In both samples, foliation is defined by aligned biotite grains (Figure 4e–f). Quartz and plagioclase in the matrix exhibit polygonal textures without elongation, although microliths of quartz are locally aligned with foliation. Garnet occurs as post-kinematic porphyroblasts distributed throughout the thin sections, indicating static overprinting (Figure 4e–f).
Samples Igarra L7, L8 and L9 are granitic rocks (Figure 3c and Supplementary Figure 1) collected from the central region of the Igarra Schist Belt near Igarra town (Figure 2b). These granitoid bodies are well exposed northeast of Igarra and southeast of Semolika Hill, particularly in the Akuku and Ojirami areas near the Ojirami Dam. Sampling was conducted at the base of Semolika Hill (∼450 m elevation). Following petrographic assessment, sample L9 was prioritized for U–Pb geochronology due to its abundant titanite (Figure 3c).
Sample L9 is a coarse-grained biotite granite that includes xenoliths of surrounding schistose lithologies (Figure 3c). The unit is weakly deformed, with foliation defined by quartz ribbons and the preferred alignment of biotite. Petrographic analysis shows a mineral composition of plagioclase (∼34%), orthoclase (∼26%), quartz (∼29%), biotite (∼4%), chlorite (∼3%) and hornblende (∼3%), with accessory allanite and titanite (∼1%). Titanite occurs in two distinct microtextural populations: (1) idiomorphic, diamond-shaped grains ranging from 800 to 1600 µm (Figure 8a–b), and (2) non-idiomorphic grains measuring 90–450 μm (Figure 8c–d). Chlorite locally pseudomorphs hornblende, and sericitization of plagioclase is observed.
Backscatter electron images showing two microstructural populations of titanite in granite sample Igarra L9 from the Igarra Schist Belt. a–b represent the idiomorphic microtexture. c–d represent the non-idiomorphic microtexture.

Sample Igarra L1C represents a surface exposure of an LCT pegmatite dyke (Figure 3e), with no visible zonation. The sample was collected ∼500 m east of the Igarra–Ekpeshi Road in Ekpeshi, Edo State. The sample is mineralogically dominated by lepidolite mica (∼60%), quartz (∼24%), plagioclase (∼15%) and microlite (∼1%), with minor accessory zircon and monazite (<0.5%). The thin section reveals an igneous micro-texture, with characteristic acicular feldspar patches and graphic intergrowths of quartz and feldspar. Other minerals include microlite, which is surrounded by lepidolite flakes and quartz grains. Lepidolite forms coarse flakes with low relief, second-order interference colours and displays both euhedral and spongy morphologies (Supplementary Figure 2). The lepidolite displays chemical homogeneity as no zonation is observed.
4.b.2. In situ U–Pb geochronology of monazite and titanite
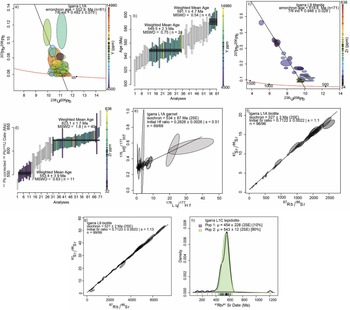
U–Pb isotopic dating was conducted on monazite from sample Igarra L1A (metapelite) and titanite from sample Igarra L9 (granite). In total, 61 laser ablation spot analyses were investigated across multiple monazite grains from Igarra L1A. A regression through the analyses in Tera-Wasserburg space is overdispersed with an errorchron (lower intercept) date of 553 Ma (Figure 9a). 207Pb corrected 206Pb/238U dates spread between c. 590 and 530 Ma with possible sub-populations at 591.1 ± 4.7 Ma (n = 6) and 549.5 ± 2.3 Ma (n = 24) (Figure 9a–b). There is no discernible correlation between spot chemistry and date.
Isochron and Tera-Wasserburg diagrams for in situ Mica Rb/Sr, Garnet Lu–Hf, and monazite and titanite U–Pb. (a) Tera-Wasserburg diagram showing the lower intercept age derived from 61 spot analyses of monazite in the biotite schist (Igarra L1A), with trace element Yttrium (Y) plotted as a color gradient on the right axis; (b) U–Pb 206Pb/238U-weighted mean age plot for the same monazite dataset, exhibiting over-dispersion indicative of complex age populations or open-system behavior; (c) Tera-Wasserburg diagram showing a single, dispersed lower intercept age from 71 spot analyses of titanite in the biotite granite (Igarra L9), with trace element Zirconium (Zr) plotted as a colour gradient on the right axis; (d) U–Pb-weighted mean age plot for the titanite analyses in (c), illustrating multiple, inseparable age populations. Trace element Zr is again plotted on the right axis; violet-green-yellow coloured data points (above the 600 Ma line) correspond to analyses of idiomorphic titanite, whereas violet below the 550 Ma line points represents non-idiomorphic titanite; (e) Garnet Lu/Hf isochron plot for sample ND003; (f) Rb/Sr isochron result for biotite spot analysis on Igarra L1A.. (g) Rb/Sr isochron result for biotite spot analysis on granite sample Igarra L9 from the Igarra Schist Belt; (h) Gaussian mix modelling plot for lepidolite analysis on LCT pegmatite sample Igarra 1C from the Igarra Schist Belt showing dominant lepidolite peak.

Figure 9. Long description
Panel A: A Tera-Wasserburg diagram showing the lower intercept age derived from 61 spot analyses of monazite in the biotite schist (Igarra L1A), with trace element Yttrium (Y) plotted as a color gradient on the right axis. Panel B: A U-Pb 206Pb/238U-weighted mean age plot for the same monazite dataset, exhibiting over-dispersion indicative of complex age populations or open-system behavior. Panel C: A Tera-Wasserburg diagram showing a single, dispersed lower intercept age from 71 spot analyses of titanite in the biotite granite (Igarra L9), with trace element Zirconium (Zr) plotted as a color gradient on the right axis. Panel D: A U-Pb-weighted mean age plot for the titanite analyses in Panel C, illustrating multiple, inseparable age populations. Trace element Zr is again plotted on the right axis; violet-green-yellow colored data points (above the 600 Ma line) correspond to analyses of idiomorphic titanite, whereas violet below the 550 Ma line points represents non-idiomorphic titanite. Panel E: A Garnet Lu/Hf isochron plot for sample ND003. Panel F: An Rb/Sr isochron result for biotite spot analysis on Igarra L1A. Panel G: An Rb/Sr isochron result for biotite spot analysis on granite sample Igarra L9 from the Igarra Schist Belt. Panel H: A Gaussian mix modeling plot for lepidolite analysis on LCT pegmatite sample Igarra 1C from the Igarra Schist Belt showing dominant lepidolite peak.
A total of 71 spot analyses were performed across multiple titanite grains in Igarra L9. The full dataset defines an over-dispersed errorchron with a lower intercept of c. 619 Ma (Figure 9c). 207Pb corrected 206Pb/238U dates generally spread between c. 640 and 550 Ma with sub-populations at 623.1 ± 1.7 Ma (n = 40) and 553.4 ± 3.9 Ma (n = 11) (Figure 9d). These populations generally correlate with grain morphology, idiomorphic (euhedral) grains comprising the old sub-population and non-idiomorphic (anhedral) grains forming the young sub-population. The two populations also have distinct Zr concentrations, with the older spots having generally higher Zr amounts (Figure 9d).
4.b.3. In situ garnet Lu–Hf
Sample Igarra L1A was also analysed for garnet Lu–Hf geochronology. A total of 69 laser ablation spot analyses were performed on multiple garnet porphyroblasts, targeting both core and rim domains. The dataset defines a single, low-precision isochron at 534 ± 87 Ma (Figure 9e), interpreted to represent the timing of garnet growth during metamorphism.
4.b.4. In situ Mica Rb/Sr
Samples Igarra L1A, L9 and L1C were analysed for Rb–Sr geochronology. In sample Igarra L1A, 96 spot analyses on biotite and plagioclase define an isochron of 527 ± 3 Ma (Figure 9f). In sample Igarra L9, 92 analyses of biotite and plagioclase define an isochron age of 521 ± 2 Ma, with an initial 87Rb/86Sr ratio of 0.7080 ± 0.0032 (Figure 9g).
For the LCT pegmatite sample, Igarra L1C, 79 laser ablation spot analyses targeting lepidolite mica are characterized by extreme 87Rb/86Sr ratios up to ∼300 000, reflecting negligible common Sr (86Sr). Given the lack of common Sr, dates for individual spots were calculated based on the measured 87Rb/87Sr normalized to repeat analyses of Tanco lepidolite (2631 ± 12 Ma; Camacho et al. Reference Camacho, Lee, Gerald, Zhao, Abdu, Jenkins, Hawthorne, Kyser, Creaser, Armstrong and Heaman2012). Gaussian mix modelling of the calculated dates indicates a dominant peak (90% of the data) at 543 ± 12 Ma (Figure 9h).
4.c. The Oban Massif
4.c.1. Lithologic description and petrography
Sample ND021A is a mica schist collected from the Mark-Sino quarry along the Calabar–Ikom Highway in Awi Town, Cross River State, southeastern Nigeria. The sample was obtained from a freshly exposed quarry face previously mapped by Ekwueme (Reference Ekwueme1987) as a kyanite schist (Figure 2c). However, petrographic analysis of a thin section prepared from this sample does not confirm the presence of kyanite. Instead, the mineral assemblage is composed of quartz (∼42%), muscovite (∼38%), biotite (∼17%) and orthoclase (∼5%) (Supplementary Figure 3). The foliation is defined by the preferred alignment of biotite and muscovite, which are present both as matrix-forming grains and as larger porphyroclasts. Biotite porphyroclasts range in size from ∼200 to ∼600 μm, whereas muscovite porphyroclasts are generally larger, measuring ∼580 to 1800 μm in length. Orthoclase occurs as fine-grained phases localized along quartz-rich domains and within discrete quartz veins.
4.c.2. In situ mica Rb–Sr
Sample ND021A was analysed for Rb–Sr isotopic dating, targeting biotite, muscovite and plagioclase. A total of 157 spot analyses were performed. A regression through 81 biotite + plagioclase analyses defined an errorchron (over-dispersed) at 501 Ma (Figure 10a). Seventy-six spot analyses targeting muscovite in various microstructural settings (main foliation and porphyroclasts) form a single statistical regression at 406 ± 14 Ma (Figure 10b), although outliers are visually apparent. Analyses of muscovite that forms the main foliation of the specimen define an isochron at 509 ± 17 Ma (n = 36) (Figure 10c), whereas analyses from muscovite porphyroclast cores and rims outline dates of 487 ± 35 Ma (n = 26) and 433 ± 36 Ma (n = 15), respectively (Figure 10d–e).
Isochron diagrams for in situ mica Rb/Sr on metapelite sample ND021A from the Oban Massif. (a) Rb/Sr result for biotite spot analyses on sample ND021A; (b) Rb–Sr isochron result from muscovite spot analyses on sample ND021A (all textures); (c–e) Muscovite Rb/Sr result for muscovite spot analysis showing multiple regression across different muscovite textures (main foliation, cores and rims of porphyroclasts, respectively).

5. Discussion
Timing of magmatism, metamorphism and cooling across the southern Benin–Nigerian Shield
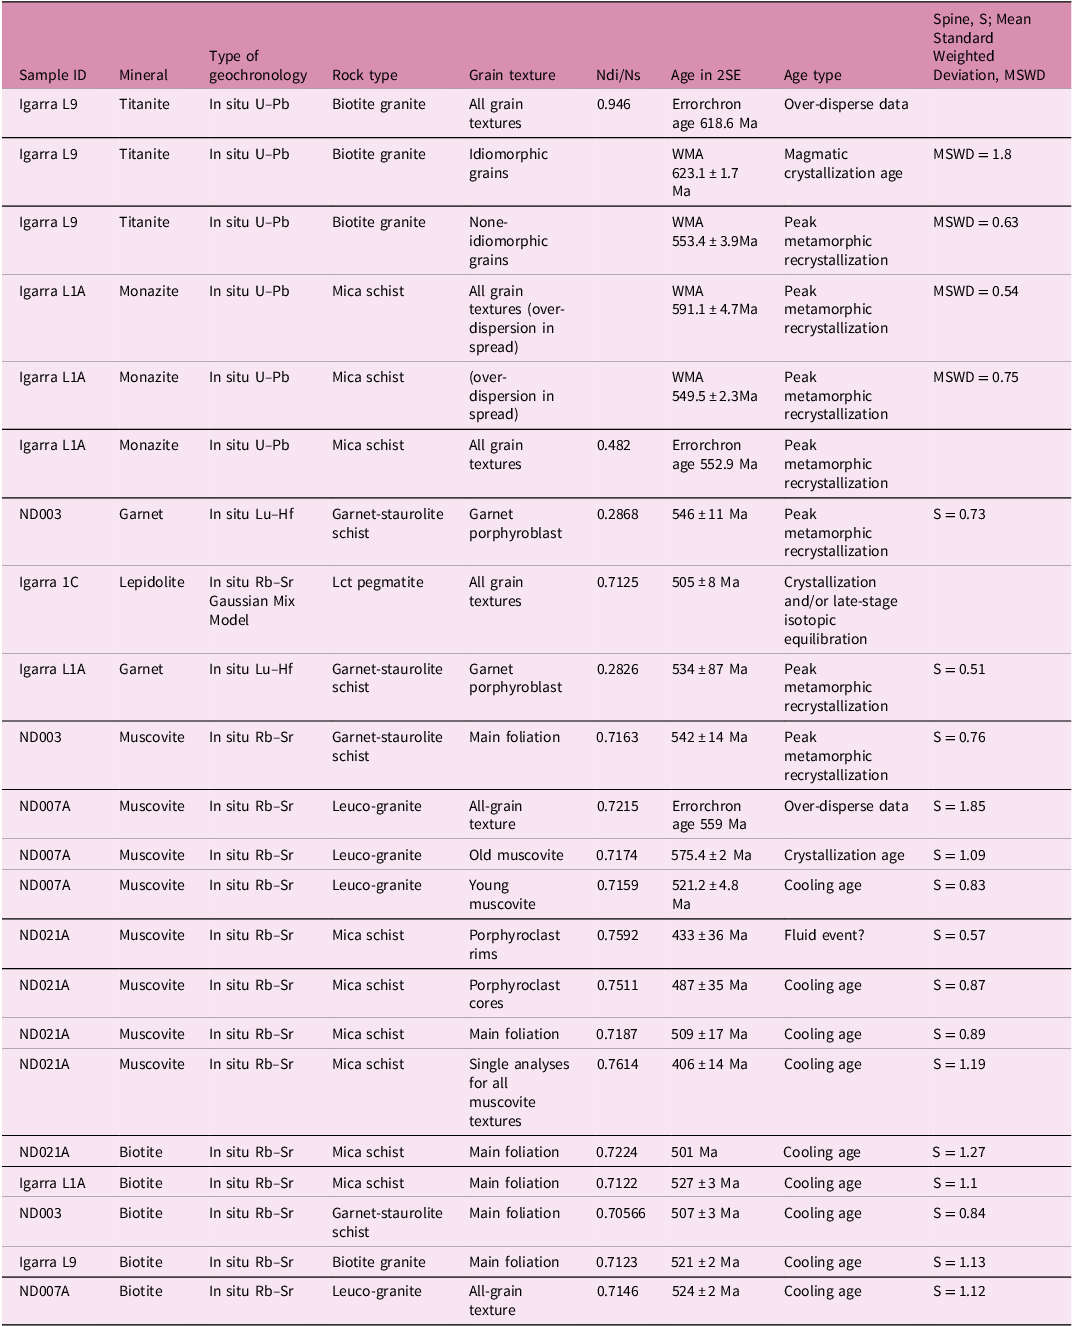
The following sections present a spatial synthesis of geochronological results derived from in situ analyses of mica (Rb–Sr), garnet (Lu–Hf), monazite and titanite (U–Pb) across key lithological units of the southern Benin–Nigerian Shield (Table 2). The interpretation proceeds west to east along the study transect (Figure 1b). Each isotopic date is interpreted in terms of its geological significance, reflecting either the timing of magmatic crystallization, metamorphism or isotopic closure during post-orogenic cooling. The broader tectonothermal implications of these chronometers are evaluated in the subsequent discussion.
Summary of in situ geochronology dates from this study

Table 2. Long description
The table presents a detailed summary of in situ geochronology dates from a study, focusing on various minerals and their geological contexts. It includes 18 rows and 10 columns, with headers such as Sample ID, Mineral, Type of geochronology, Rock type, Grain texture, Nd/iNs, Age in 2SE, Age type, and Spine, S, Mean Standard Weighted Deviation, MSWD. Each row provides specific data for different samples, including minerals like titanite, monazite, garnet, lepidolite, and muscovite. The table lists the type of geochronology used, the rock type, grain texture, isotopic ratios, ages, and the type of age determined. Notable trends include various age types such as magmatic crystallization age, peak metamorphic recrystallization, and cooling age, with specific age values and their standard deviations.
Weighted mean age = WMA; Powell spine = S; mean standard weighted deviation = MSWD.
5.a. Ife–Ilesha Schist Belt
The in situ Rb–Sr isotopic dates of 575 ± 2 Ma and 521 ± 5 Ma from muscovite sub-populations, together with the 524 ± 2 Ma biotite date obtained from leucogranite sample ND007A in the Ife–Ilesha Schist Belt, indicate a complex post-emplacement thermal history. The older muscovite population (575 ± 2 Ma) overlaps with the timing of regional Pan-African granitoid emplacement and may record magmatic crystallization and/or early isotopic equilibration during granite emplacement (Figure 6a–d). The younger muscovite population (521 ± 5 Ma) overlaps, within uncertainty, with the biotite age (524 ± 2 Ma), suggesting a later thermal event involving mica crystallization, isotopic re-equilibration or cooling (Figure 6c–d).
The approximately 50 Myr difference between the two muscovite age populations could reflect prolonged post-emplacement cooling through the Sr closure interval in micas (e.g. muscovite ∼500–600°C; biotite ∼350–450°C; Verschure et al. Reference Verschure, Andriessen, Boelrijk, Hebeda, Maijer, Priem and Verdurmen1980; Del Moro et al. Reference Del Moro, Puxeddu, Radicati Di Brozolo and Villa1982; von Blanckenburg et al. Reference von Blanckenburg, Villa, Baur, Morteani and Steiger1989; Freeman et al. Reference Freeman, Inger, Butler and Cliff1997). However, such an interpretation would require sustained thermal stability and slow exhumation over an extended period, conditions that are not independently constrained by the present dataset. Alternatively, the two muscovite populations may record discrete episodes of mica crystallization and/or isotopic resetting associated with multiple tectonothermal events during the late stages of the Pan-African orogeny. Because the muscovite populations are texturally and compositionally indistinguishable, the available petrographic and isotopic data do not uniquely discriminate between these interpretations. Consequently, the age distributions are most conservatively interpreted as recording a prolonged and potentially episodic thermal evolution involving both cooling and localized isotopic re-equilibration.
Sample ND003-1 (garnet–staurolite schist) from the Ife–Ilesha Schist Belt yields an Rb–Sr isochron age of 542 ± 14 Ma for muscovite and 507 ± 3 Ma for biotite, whereas in situ Lu–Hf garnet geochronology from sample ND003-1 yields an isochron date of 546 ± 11 Ma (Figure 6g). The garnet date is interpreted to reflect garnet growth during peak metamorphic conditions. This is because, unlike the more traditional diffusion-controlled thermochronometers, Lu–Hf dating in garnet typically records the timing of garnet growth because Lu is strongly partitioned into garnet during prograde metamorphism, and Hf isotopic systems are effectively retained at temperatures below ∼700°C (Bloch et al Reference Bloch, Ganguly, Hervig and Cheng2015). As a result, Lu–Hf garnet ages are widely considered to approximate the timing of peak metamorphism, although they may integrate growth over a prograde interval rather than recording a single instantaneous peak (Simpson et al. Reference Simpson, Glorie, Hand, Spandler and Gilbert2023; Larson et al. Reference Larson, Cottle, Button, Dyck, Lihter and Shrestha2024).
In contrast, both mica dates are interpreted as cooling ages. Although the muscovite Rb–Sr age overlaps, within uncertainty, with the garnet age, there is no petrographic or textural evidence linking the growth or dynamic recrystallization of muscovite to the static peak metamorphic conditions. Consequently, its age is more plausibly interpreted to reflect cooling through the closure temperature during the early stages of exhumation rather than peak metamorphism. Similarly, the younger biotite age of 507 ± 3 Ma is interpreted to record cooling through the Rb–Sr closure window following peak metamorphism. Collectively, these data indicate a transition from peak metamorphism at c. 546 Ma to post-peak cooling by c. 507 Ma, suggesting a protracted but continuous exhumation history rather than discrete magmatic or prograde events within this interval.
Overall, these data are best explained by a polyphase thermal evolution involving: (i) an early thermal episode recorded in muscovite Rb–Sr at ∼575 Ma, (ii) peak metamorphism recorded by garnet growth at 546 ± 11 Ma and (iii) post-peak cooling through muscovite and biotite Rb–Sr closure at c. 525–500 Ma.
5.b. Igarra Schist Belt
The in situ U–Pb analyses of titanite from granite sample Igarra L9 (Igarra Schist Belt) define an overdispersed age distribution with a lower intercept age of c. 619 Ma, indicating isotopic heterogeneity within the titanite population (Figure 9c). Back-scattered electron (BSE) imaging reveals two distinct titanite textural populations: (i) large, relatively euhedral grains (c. 800–1600 μm) and (ii) smaller, anhedral to fragmented grains (c. 90–450 μm) that commonly occur along fractures or grain boundaries (Figure 8a–d). The euhedral titanite grains yield a weighted mean 207Pb-corrected U–Pb age of 623 ± 2 Ma, interpreted as primary magmatic crystallization (Figure 9d). In contrast, the smaller anhedral and fragmented grains yield a significantly younger weighted mean age of 553 ± 4 Ma (Figure 9d). The younger population is interpreted to reflect partial recrystallization and/or Pb-loss during a later tectonothermal overprint.
Monazite U–Pb geochronology results from Igarra L1A are also over-dispersed with a lower intercept errorchron of c. 550 Ma in Tera-Wasserburg space. Although the 207Pb-corrected 206Pb/238U dates are almost normally distributed, there appear to be minor sub-populations at c. 550 and c. 590 Ma (Figure 8b), with no apparent systematic differences in trace element content. The older date is interpreted to record a metamorphic (re)crystallization event (Figure 9b), whereas the younger date overlaps with that of the young, non-idiomorphic titanite and, as such, likely records the same event. Garnet Lu–Hf geochronology from the same rock defines an imprecise isochron of 534 ± 87 Ma (Figure 9e). Although the garnet porphyroblasts overgrew the main foliation and display post-kinematic textures, indicating static recrystallization following the principal deformation phase, the date is not precise enough to distinguish between the two monazite or titanite populations. Finally, in situ Rb–Sr biotite dates of 527 ± 3 Ma and 521 ± 2 Ma obtained from samples Igarra L1A and L9, respectively, are interpreted to reflect the timing of cooling below biotite closure to Sr diffusion (∼350–450°C; Figure 9h–i).
The 543 ± 12 Ma (Figure 9h) date obtained from lepidolite in sample Igarra L1C is older than Rb–Sr biotite cooling ages from the surrounding country rocks (e.g. Igarra L1A). It is, however, consistent with published dates of LCT pegmatite emplacement across the north-central Benin–Nigerian Shield with cassiterite U–Pb ages clustering between c. 570 and 550 Ma (e.g. Cao et al. Reference Cao, Chen, Jiang, Garba, Li, Chao, Hu and Lv2024). The dominant lepidolite age population at 543 ± 12 Ma overlaps the younger end of the cassiterite U–Pb ages (c. 572–548 Ma) reported for LCT pegmatites elsewhere in the Benin–Nigerian Shield (Cao et al. Reference Cao, Chen, Jiang, Garba, Li, Chao, Hu and Lv2024). This correspondence suggests that pegmatite evolution in the southwestern Benin–Nigerian Shield occurred broadly contemporaneously with regional LCT mineralization during the late stages of the Pan-African orogeny. However, because the closure temperature of the Rb–Sr system in lepidolite remains poorly constrained and because lepidolite is characterized by extremely high Rb/Sr ratios, the 543 ± 12 Ma age is interpreted cautiously as recording lepidolite crystallization and/or isotopic equilibration during the late evolution of the pegmatite rather than unequivocally dating pegmatite emplacement.
5.c. Oban Massif
Previous geochronological investigations of the Oban Massif using whole-rock Rb–Sr systematics (e.g. Ekwueme Reference Ekwueme1990; Ekwueme and Matheis Reference Ekwueme, Matheis, Srivastava and Chandra1995) yielded metamorphic ages of 676 ± 20 Ma for a kyanite schist and 572 ± 16 Ma for a retrogressed kyanite-bearing schist. These ages have been interpreted as recording early Pan-African metamorphism followed by later retrogression. However, whole-rock Rb–Sr systems commonly integrate multiple mineral reservoirs and may therefore obscure discrete metamorphic, cooling or overprinting events.
This type of complexity is evident in regional pegmatite studies across the Pan-African reactivation zone of Nigeria. For example, Rb–Sr investigations of rare-metal and barren pegmatites by Matheis & Caen-Vachette (1983) demonstrate a wide range of isotopic signatures, reflecting variable degrees of isotopic disturbance, fluid interaction and multi-stage evolution within pegmatitic systems. These findings highlight that whole-rock Rb–Sr systematics in both metamorphic and pegmatitic rocks across the Nigerian Shield may record composite thermal histories rather than single, discrete events.
In contrast, the in situ Rb–Sr mica dates presented here from sample ND021A provide more precise timing of the region’s late-stage thermal evolution. Biotite analyses define an over-dispersed errorchron date of c. 501 Ma, interpreted to approximate cooling below the closure of the Rb–Sr system in biotite following Pan-African metamorphism (Figure 10a). Muscovite in the sample occurs as matrix grains that define the foliation and as porphyroclasts. A regression through 36 analyses in foliation-defining grains defines a date of 509 ± 17 Ma (Figure 10c), which overlaps the biotite result. Twenty-six analyses from porphyroclast cores overlap those from the matrix with a date of 487 ± 35 Ma (Figure 10d); however, 15 porphyroclast rim analyses outline a younger date at 433 ± 36 Ma (Figure 10e). That younger date may reflect localized, possibly fluid-mediated isotopic disturbance during post-tectonic cooling. Independent evidence for late-stage fluid activity, including pervasive sericitization of plagioclase and chloritization of hornblende in nearby granitoids, is consistent with late fluid-related overprinting and localized resetting of the Rb–Sr isotopic system. It is possible that the dispersion in the biotite systematics also reflects partial re-equilibration during this event. All the in situ mica dates are younger than the previously reported whole-rock Rb–Sr ages for the region (Ekwueme Reference Ekwueme1990) and are interpreted to record the final cooling and exhumation of the Oban Massif.
5.d. Pressure–temperature evolution of the Ife–Ilesha Schist Belt
The phase equilibria modelling results for sample ND003-1 are interpreted to record prograde metamorphism during a single metamorphic cycle (Figure 5). This interpretation is supported by compositional zoning observed in garnet porphyroblasts (Figure 5), which display symmetrical manganese profiles characteristic of growth during progressive metamorphism (e.g. Kohn and Spear Reference Kohn and Spear2000; Dyck et al. Reference Dyck, Goddard, Wallis, Hansen and Martel2021). The porphyroblast microstructures and P–T path indicate a static isobaric thermal overprint at approximately 5.0 ± 0.5 kbar, with temperature increasing from ∼520 ± 30°C to ∼580 ± 30°C. These conditions are consistent with garnet growth and subsequent staurolite stability, reflecting lower amphibolite-facies metamorphism. Importantly, this overprint postdates development of the regional foliation and is interpreted as a post-deformational thermal event associated with late-stage Pan-African thermal evolution.
This isobaric heating trajectory corresponds to an increase in geothermal gradient from approximately 1040°C/GPa to 1160°C/GPa, indicative of enhanced crustal heating without significant burial or exhumation. Such P–T conditions are characteristic of static thermal re-equilibration, potentially driven by lithospheric thinning, radiogenic heat production or advective heat input during late orogenic evolution (Hasterok and Chapman Reference Hasterok and Chapman2007; Jaupart and Mareschal Reference Jaupart and Mareschal2015; Li et al. Reference Li, Liu and Gerya2016).
In summary, the Ife–Ilesha Schist Belt records a post-tectonic isobaric thermal pulse interpreted as part of the waning Pan-African thermal regime rather than ongoing crustal thickening or discrete metamorphic overprinting.
5.e. Tectonothermal history of the Southern Benin–Nigeria Shield
The new geochronological data delineate a coherent but protracted tectonothermal history (Figure 11), rather than discrete isolated events.
Summary of geochronological constraints and interpreted tectonothermal events across the southern Benin–Nigerian Shield. Coloured fields represent the inferred timing of granite crystallization, peak metamorphism/thermal overprint, LCT pegmatite evolution and regional cooling based on integrated in situ U–Pb, Lu–Hf and Rb–Sr geochronology. Error bars represent analytical uncertainties at the 2σ level.

Stage I (c. 623–575 Ma): Syn-tectonic granitoid magmatism
This phase is characterized by voluminous granite emplacement in the Igarra and Ife–Ilesha Schist Belts, with crystallization ages consistent with Pan-African granitoids in the region (e.g. Tubosun et al. Reference Tubosun, Lancelot, Rahaman and Ocan1984; Ferré et al. Reference Ferré, Gleizes and Caby2002; Adetunji et al. Reference Adetunji, Olarewaju, Ocan, Macheva and Ganev2018). The foliated nature of sample Igarra L9 supports syn-tectonic emplacement. These ages overlap with ∼620 Ma ultrahigh-pressure coesite-bearing eclogitic assemblages recognized within the Pan-African suture zone of West Africa (Jahn et al. Reference Jahn, Caby and Monié2001), consistent with subduction-related crustal thickening and magmatic reworking during continental collision.
Stage II (c. 550–530 Ma): Peak metamorphism, thermal overprint and LCT pegmatite formation
Following granitoid emplacement, garnet Lu–Hf ages record peak regional metamorphism (∼546 ± 11 Ma), interpreted to represent peak thermal conditions associated with post-kinematic (static) garnet/staurolite growth. This phase is also reflected in titanite and monazite U–Pb ages and in Rb–Sr mica systematics from syn- to post-tectonic rocks.
In both the Igarra and Ife–Ilesha Schist Belts, garnet growth is characterized by static overgrowth of regional foliation, consistent with near-isobaric heating conditions (∼5.0 ± 0.5 kbar). The cause of this late thermal overprint remains uncertain but may be related to lithospheric delamination, slab breakoff or asthenospheric upwelling during the waning stages of Pan-African convergence (Black and Liégeois Reference Black and Liegeois1993; Priestley et al. Reference Priestley, McKenzie, Debayle and Pilidou2008; Globig et al. Reference Globig, Fernàndez, Torne, Vergés, Robert and Faccenna2016). Thermobarometric modelling indicates elevated geothermal gradients during this period, consistent with an additional heat source operating after the main deformation event.
Importantly, this thermal phase broadly overlaps with the timing of LCT pegmatite formation. The dominant lepidolite Rb–Sr age population of 543 ± 12 Ma falls within the interval of peak metamorphism and overlaps, within uncertainty, the younger portion of the cassiterite U–Pb ages reported for LCT pegmatites elsewhere in the Benin–Nigerian Shield (Cao et al. Reference Cao, Chen, Jiang, Garba, Li, Chao, Hu and Lv2024). Although the Rb–Sr system in lepidolite should be interpreted cautiously owing to its extreme Rb/Sr ratios and poorly constrained closure behaviour, these data suggest that pegmatite evolution was broadly contemporaneous with the late thermal pulse recorded throughout the region. This temporal relationship supports a genetic link between crustal anatexis, extreme granite fractionation and rare-metal pegmatite formation during the late stages of the Pan-African orogeny.
Stage III (c. 530–500 Ma): Regional cooling and isotopic re-equilibration
The final stage records progressive cooling and heterogeneous isotopic closure during exhumation of the crust. Rb–Sr mica systematics define spatially variable cooling ages across the shield. In the Oban Massif, biotite and muscovite yield ages of approximately 501–509 Ma, and the Ife–Ilesha Belt records overlapping but slightly older cooling signals. The spread in muscovite ages, including younger porphyroclast-rim populations (∼433 Ma), is interpreted to reflect localized isotopic disturbance and partial re-equilibration during late deformation and/or fluid-assisted recrystallization.
The exact mechanism responsible for this dispersion cannot be uniquely resolved from isotopic data alone. Consequently, the observed age patterns are more conservatively interpreted as reflecting heterogeneous closure and localized resetting during protracted cooling and exhumation rather than discrete tectonothermal events. Continued fluid circulation during this stage may have contributed to localized isotopic re-equilibration, but there is no direct evidence for a major regional metamorphic or magmatic event after c. 530 Ma.
5.f. Model for the formation of late Pan-African LCT pegmatites
Magmatic crystallization of granitoids occurred between c. 623–575 Ma in the Igarra and Ife–Ilesha Schist Belts. Following this, the region experienced peak metamorphism and thermal reorganization at c. 550–530 Ma, as recorded by garnet Lu–Hf ages and P–T modelling results.
LCT pegmatite formation elsewhere in the Benin–Nigerian Shield is broadly constrained by cassiterite U–Pb ages between c. 570 and 550 Ma (Cao et al. Reference Cao, Chen, Jiang, Garba, Li, Chao, Hu and Lv2024), indicating that rare-metal pegmatite evolution occurred during the late stages of Pan-African crustal reworking. These ages overlap with the timing of the static metamorphic overprint documented in this study and are supported by the new lepidolite Rb–Sr age population of 543 ± 12 Ma. Collectively, these data suggest that LCT pegmatite formation was closely linked to the late-orogenic thermal evolution of the shield rather than representing a significantly younger and unrelated magmatic event.
The temporal relationship between pegmatite formation, granitoid magmatism and peak metamorphism provides some constraints on possible genetic models (Figure 12). Across the Benin–Nigerian Shield, the overlap between LCT pegmatite ages and the later stage of granitoid emplacement is consistent with models involving extreme fractionation of fertile peraluminous granitic magmas. However, in the study area, the lepidolite age post-dates the main phase of granite emplacement and instead overlaps with the post-deformation metamorphic thermal peak. This relationship suggests that, at least locally, pegmatite-forming melts may have been generated through partial melting of fertile metasedimentary rocks, re-melting of previously emplaced granites or a combination of both processes during late-orogenic heating (Figure 12). Although the available data do not allow discrimination between these alternatives, they indicate that the thermal event responsible for peak metamorphism likely played an important role in the generation and evolution of rare-metal pegmatite systems in the southwestern Benin–Nigerian Shield.
Proposed geodynamic and tectonothermal evolution of the southern Benin–Nigerian Shield during granite emplacement, regional metamorphism and LCT pegmatite formation.

Figure 12. Long description
Panel A: A cross-sectional diagram showing the initial stage of granite emplacement. The diagram includes layers labeled as continental crust, continental lithospheric mantle, and asthenosphere. Arrows indicate movement directions, and a magnified section shows granitic emplacement with Chl+Bt schist. Panel B: A cross-sectional diagram depicting the second stage involving slab breakoff, peak metamorphism, granite fractionation, and LCT generation. It shows the continental crust, lithospheric mantle, and asthenosphere with temperature and pressure conditions. A magnified section illustrates peak static metamorphism with Grt+St+Bt schist. Panel C: A cross-sectional diagram of the final stage showing cooling, fluid circulation, and isotopic re-equilibration. It includes similar layers as previous panels with a magnified section showing Grt+St+Bt schist.
Supplementary material
The supplementary material for this article can be found at https://doi.org/10.1017/S0016756826101022.
Acknowledgements
This project was supported by the Natural Sciences and Engineering Research Council of Canada (#R611772 (BVD)) and made possible by infrastructure funding provided by the British Columbia Knowledge Development Fund and the Canadian Foundation for Innovation (#42967 (BVD)). NDN acknowledges support from the UBC Okanagan Graduate Research Scholarships (#26367). The authors are grateful to the two anonymous reviewers as well as to Dr Mark Button and Dr Sudip Shrestha for their contributions to the analytical work.
Competing interests
The authors declare none.








 Open access

