





Introduction
Formal thought disorder (FTD) represents a disturbance in the organization and expression of thought, manifesting through observable abnormalities in speech and language production (Sass & Parnas, Reference Sass and Parnas2017). Historically regarded as a cardinal feature of psychotic disorders, particularly schizophrenia, FTD has often been conceptualized as a ‘disorder’ of normal thought processes that emerges in the context of severe mental illness (Barrera, Reference Barrera2025; Jerónimo, Queirós, Cheniaux, & Telles-Correia, Reference Jerónimo, Queirós, Cheniaux and Telles-Correia2018).
Despite its clinical importance and functional relevance (Soldovieri et al., Reference Soldovieri, Elleuch, Ahrens, Bambini, Delgaram-Nejad, Garani, Harrison, Kircher, Kuperberg, Rossell, Sommer, Bosia and Palaniyappan2026), three critical questions about FTD remain empirically unresolved.
What is the latent structure of FTD?
We do not yet know if FTD is a discrete manifestation (as formulated in the concepts of hebephrenia (Barrera, Curwell-Parry, & Raphael, Reference Barrera, Curwell-Parry and Raphael2019; Taylor, Shorter, Vaidya, & Fink, Reference Taylor, Shorter, Vaidya and Fink2010) and categorical FTD+ subgroups (Roche et al., Reference Roche, Lyne, O’Donoghue, Segurado, Kinsella, Hannigan, Kelly, Malone and Clarke2015b), a continuum that extends across clinical categories (Kircher, Bröhl, Meier, & Engelen, Reference Kircher, Bröhl, Meier and Engelen2018) or a quasi-dimension with taxonic structures emerging under certain conditions. Several studies in the past have derived latent factors using data-reduction procedures (e.g. factor analysis often reporting three subconstructs – Loosening, Impoverishment, and Peculiarities (Abboud et al., Reference Abboud, Ahrens, Ballès, Bambini, Deakin, Harrison, Kircher, Kuperberg, Liddle, Lodhi, Mackinley, Rossell, Singh, Sommer, Voppel, Zaher, Zeramdini and Palaniyappan2026; Zamperoni et al., Reference Zamperoni, Tan, Rossell, Meyer and Sumner2024)) and interpreted the presence of clustered items as evidence for dimensionality. Factor analysis alone cannot determine whether apparently continuous latent factors emerge from discrete classes (taxa); for this we need taxometric studies (Lenzenweger, Reference Lenzenweger2004). If FTD exists in a continuum, then the use of dimensional assessment tools (e.g. deviations in naturalistic language, thought dynamics, communicative style) will be valid, and the presence of FTD in non-clinical settings may not be pathological; this has implications for accurately assessing the risk of psychosis, including the avoidance of false alarms of potential risk.
What is the prevalence of FTD subconstructs in non-clinical samples?
Subtle thought and language Peculiarities have been documented in about 6% of healthy individuals (Kircher et al., Reference Kircher, Bröhl, Meier and Engelen2018; Roche et al., Reference Roche, Creed, MacMahon, Brennan and Clarke2015a) and in symptomatic individuals without diagnosed psychiatric conditions, for example, schizotypal individuals, voice-hearers (Deyo & Langdon, Reference Deyo and Langdon2019; Sommer et al., Reference Sommer, Derwort, Daalman, de Weijer, Liddle and Boks2010; Sumner, Carruthers, & Rossell, Reference Sumner, Carruthers and Rossell2020), and first-degree relatives of individuals with schizophrenia (Gooding et al., Reference Gooding, Coleman, Roberts, Shenton, Levy and Erlenmeyer-Kimling2012). While other psychotic symptoms (delusions and hallucinations) can be evaluated through self-report questionnaires, FTD requires direct observation and expert rating of speech. This observational requirement has precluded large-scale surveys. The prevalence of FTD, especially its distinct subconstructs in non-clinical populations, remains unclear.
If FTD subconstructs co-occur in the same person, does that mark clinical status?
When these subconstructs co-occur, they may either reflect a spurious or chance overlap of independent continuous distributions or a dependent causal structure (e.g. a shared etiology or mutual risk enhancement among symptoms). These possibilities can be examined using the comorbidity framework of Klein and Riso (Reference Klein, Riso and Costello1993) (extended to dimensional constructs by Ruscio & Ruscio, Reference Ruscio and Ruscio2004), which distinguishes between artifactual and etiologically meaningful sources of co-occurrence.
Most established FTD rating scales, such as the Thought, Language, and Communication Scale (TLC; Andreasen, Reference Andreasen1979) and Thought and Language Disorder Scale (TALD; Kircher et al., Reference Kircher, Krug, Stratmann, Ghazi, Schales, Frauenheim, Turner, Fährmann, Hornig, Katzev, Grosvald, Müller-Isberner and Nagels2014), were developed for clinical populations and are fundamentally deficit-oriented. Their focus on pathological deviations means variations in thought organization are only captured once they cross a certain threshold. Moreover, conventional scales require ‘psychiatric examination’, that is, eliciting descriptions of pathological mood, perceptions, beliefs, and thoughts to assess thought disorder severity. This symptom-focused approach, while clinically valuable, assumes that FTD comprises discrete abnormalities and cannot fully quantify the subtle thought disturbances that may exist in healthy individuals.
The Thought and Language Index (TLI; Liddle et al., Reference Liddle, Ngan, Caissie, Anderson, Bates, Quested, White and Weg2002) provides a particularly suitable instrument for investigating both latent structure and population prevalence. Unlike traditional symptom-based rating scales designed primarily for clinical populations, the TLI employs a standardized picture description task that elicits naturalistic speech samples amenable to dimensional quantification. The TLI yields scores across multiple aspects of thought and language organization, including Loosening (tangentiality, weak semantic associations), Peculiarities (unusual linguistic constructions, atypical word usage), and Impoverishment (poverty of speech, reduced elaboration) (Abboud et al., Reference Abboud, Ahrens, Ballès, Bambini, Deakin, Harrison, Kircher, Kuperberg, Liddle, Lodhi, Mackinley, Rossell, Singh, Sommer, Voppel, Zaher, Zeramdini and Palaniyappan2026). These subconstructs capture complementary facets of thought organization and have shown distinct clinical correlates. Loosening acts as an upstream driver of other FTD phenomena in network and directed acyclic graph analyses. Impoverishment correlates with negative symptoms, while Peculiarities track positive symptoms, with both independently predicting social and occupational functioning (Abboud et al., Reference Abboud, Ahrens, Ballès, Bambini, Deakin, Harrison, Kircher, Kuperberg, Liddle, Lodhi, Mackinley, Rossell, Singh, Sommer, Voppel, Zaher, Zeramdini and Palaniyappan2026).
Taxometric methods offer a rigorous approach to adjudicating among categorical, dimensional, and quasi-dimensional latent structures (Grove & Meehl, Reference Grove and Meehl1993; Meehl, Reference Meehl1999; Meehl & Yonce, Reference Meehl and Yonce1994, Reference Meehl and Yonce1996; Waller & Meehl, Reference Waller and Meehl1998). By examining covariation patterns among observed indicators to infer the nature of the underlying construct, taxometric analyses can distinguish whether the patterns reflect true discontinuity or merely extremes of a continuous distribution via multiple complementary procedures, and have been widely used to study many psychiatric phenomena (Haslam, McGrath, Viechtbauer, & Kuppens, Reference Haslam, McGrath, Viechtbauer and Kuppens2020), though not FTD to date.
We employed multiple taxometric procedures, cutoff determination methods, and co-occurrence analysis to address the interrelated questions on the latent structure of FTD, its prevalence in healthy populations, and the relationships among its subconstructs. Given the inferences made from factor analytic studies to date, we hypothesized that (1) FTD is unlikely to be a categorical taxon, (2) its latent subconstructs are detectable and prevalent in non-clinical (healthy) individuals, and (3) convergence of its subconstructs will be more frequent in the clinical population (patients). Addressing these questions will clarify whether clinical FTD reflects the expected overlap among independent latent processes or a distinct syndrome emerging from a separate process.
Methods
Participants
Our sample consisted of 520 participants (352 clinical [i.e. people with psychotic disorder who had a clinical need and were recruited from treatment programs, not the general population] and 168 non-clinical) drawn from multiple research cohorts collected between 2010 and 2024 across five sites: Prevention and Early Intervention for Psychosis Program (London, Ontario, Canada; TOPSY, WOW datasets), Douglas Hospital (Montreal, Canada; IMPLEMENT dataset), and three UK sites in Manchester, Cardiff, and Nottingham (SPRING cohorts). Data from five separate studies were pooled: DISCOURSE-UWO, IMPLEMENT, TOPSY, WOW, and SPRING. Participants were included if they had: (1) a clinical diagnosis confirmed by consensus procedure or no lifetime psychiatric history (for controls), (2) completed the same three-picture FTD assessment using TLI, and (3) TLI ratings completed via consensus approach using recorded and transcribed speech, yielding a single reliable score.
The clinical sample encompassed individuals with psychotic disorders. The psychosis-spectrum group (n = 352) comprised schizophrenia (n = 293, 83%), schizoaffective disorder (n = 25, 7%), psychosis not otherwise specified (n = 22, 6%), bipolar disorder with psychosis (n = 9, 3%), major depressive disorder with psychosis (n = 2), schizophreniform disorder (n = 1). Diagnoses were established by Best Estimate Consensus procedures based on comprehensive clinical assessment, medical records review, and structured diagnostic interviews aligned with DSM-IV (SPRING) or DSM-5 criteria.
The non-clinical comparison group comprised healthy individuals without a lifetime history of psychiatric diagnosis, recruited through community advertisements and screening procedures. Exclusion criteria for the comparison group included first-degree family history of psychotic disorder, personal history of psychotic symptoms, current psychiatric treatment, and neurological conditions affecting cognition.
All sites received local institutional review board approval, and all participants provided written informed consent. The authors assert that all procedures contributing to this work comply with the ethical standards of the relevant national and institutional committees on human experimentation and with the Helsinki Declaration of 1975, as revised in 2008 and the Assessment Instruments. Ethics approval codes: DISCOURSE-UWO: 2024-119548-101057; TOPSY: 2025-108268-113605; WOW: 2024-112846-101698; IMPLEMENT: 2022-IUSMD-21-53; SPRING: 14/NW/0298.
Thought and Language Index
The TLI (Liddle et al., Reference Liddle, Ngan, Caissie, Anderson, Bates, Quested, White and Weg2002), which quantifies thought and language organization by systematically coding linguistic and semantic features, was used as the main tool for assessing FTD. Unlike other similar instruments like the Thought Disorder Index (TDI; Johnston & Holzman, Reference Johnston1979), which uses unstructured clinical interview and Rorschach cards to yield categorical severity classifications, the TLI employs a less ambiguous picture description task amenable to identical scoring across transcribed audio recordings from clinical and non-clinical populations.
For the present investigation, we focused on three TLI subconstructs derived from our prior factor-analytic work (Abboud et al., Reference Abboud, Ahrens, Ballès, Bambini, Deakin, Harrison, Kircher, Kuperberg, Liddle, Lodhi, Mackinley, Rossell, Singh, Sommer, Voppel, Zaher, Zeramdini and Palaniyappan2026): (1) Loosening characterized by tangentiality, derailment, and weak semantic associations (comprising Looseness and Illogicality items, e.g., ‘the farmer … the election was postponed. I guess democracy is done’ [departure from the depicted scene]); (2) Peculiarities , indexing unusual grammatical constructions and atypical word usage (comprising Peculiar Sentences and Peculiar Words items, e.g., ‘this tree is geometrically whispering’ [atypical word choice]); and (3) Impoverishment , reflecting poverty of speech and reduced elaboration (comprising Poverty of Speech and Weakening of Goal items, e.g., ‘er‥, a man…, a house…’ [reduced elaboration with extended pauses]). Individual item scores were aggregated to create subconstruct scores for each participant. These subconstructs represent conceptually and empirically distinct aspects of thought organization. Each TLI item is rated 0 to 1 per picture (3 pictures per participant), resulting in a score range of 0 to 3 (theoretically, this can exceed 3, if multiple distinct instances of perseveration occur). Each subconstruct score is the sum of two constituent items derived from prior factor-analytic work (Abboud et al., Reference Abboud, Ahrens, Ballès, Bambini, Deakin, Harrison, Kircher, Kuperberg, Liddle, Lodhi, Mackinley, Rossell, Singh, Sommer, Voppel, Zaher, Zeramdini and Palaniyappan2026). Individual items were summed to preserve interpretability and enable thresholding. TLI administration and scoring (blind to diagnosis and functional status) were harmonized under supervised consensus (see Abboud et al. (Reference Abboud, Ahrens, Ballès, Bambini, Deakin, Harrison, Kircher, Kuperberg, Liddle, Lodhi, Mackinley, Rossell, Singh, Sommer, Voppel, Zaher, Zeramdini and Palaniyappan2026), for formal cross-site comparability data).
Taxometric analysis
Data preprocessing and indicator selection
Prior to taxometric analysis, we conducted comprehensive data quality checks and indicator specification. To study the latent structure of FTD, we utilized the three subconstruct scores as indicators. We assessed indicator suitability using standard taxometric criteria (Beauchaine, Reference Beauchaine2007), evaluating sample size adequacy, indicator validity (taxon versus complement Cohen’s d), and within-group correlations.
Taxometric procedures
We employed three complementary taxometric procedures – MAMBAC, MAXEIG, and L-Mode to provide convergent evidence regarding latent structure. Each procedure examines indicator covariation patterns from different analytical perspectives. All analyses were conducted using the RTaxometrics package (version 3.2.1) in R (version 4.5.2) (R Core Team, 2025; Wang & Ruscio, Reference Wang and Ruscio2017).
-
1. MAMBAC: MAMBAC examines how the mean difference on one indicator varies across sequential subgroups formed by sorting cases along another indicator. Under categorical structure, this produces a peaked curve; under dimensional structure, the curve remains flat or dish-shaped. We implemented MAMBAC with 50 cuts along the input indicator, with 25 cases reserved at each extreme. All possible input–output indicator pairings were examined. Cases with tied input scores were randomly reordered 10 times, with results averaged.
-
2. MAXEIG: MAXEIG examines the leading eigenvalue from covariance matrices calculated within overlapping windows as cases are sorted along an input indicator. Categorical structure produces a peaked eigenvalue curve; dimensional structure produces a flat or dish-shaped curve. This was implemented using 50 overlapping windows with 90% overlap between adjacent windows; this follows the RTaxometrics package default (Wang & Ruscio, Reference Wang and Ruscio2017) and was selected to maximize smoothness of the eigenvalue trajectory and to ensure adequate within-window covariance estimation.
-
3. L-Mode: L-Mode examines the factor score distribution to identify modes. Categorical structure produces bimodal distributions and dimensional structure produces unimodal distributions. We conducted L-Mode analysis using factor scores derived from all indicators, with mode detection parameters set to identify peaks beyond 0.001 from the distribution center.
Comparison data generation
For each taxometric procedure, we generated comparison datasets simulating both categorical and dimensional latent structures while preserving key empirical data properties. We created large finite populations (n = 100,000) for each structure, then drew 100 random samples (matching empirical sample size) from each population for analysis. Categorical comparison data were constructed to match empirical base rates, indicator means and variances within each putative group, and overall indicator intercorrelations. Dimensional comparison data were constructed to match overall indicator means, variances, skewness, kurtosis, and intercorrelation patterns using factor-analytic methods.
Consistency tests and decision rules
The Comparison Curve Fit Index (CCFI) quantifies the degree to which empirical taxometric curves resemble categorical versus dimensional comparison curves. CCFI values range from 0 (perfect fit to dimensional data) to 1 (perfect fit to categorical data). Following established guidelines (Ruscio, Walters, Marcus, & Kaczetow, Reference Ruscio, Walters, Marcus and Kaczetow2010), we employed the following decision rules: CCFI < 0.45 supports dimensional structure, CCFI 0.45–0.55 indicates ambiguous structure, and CCFI > 0.55 supports categorical structure. We calculated CCFIs for each procedure and averaged across procedures to derive mean CCFIs. We also conducted a visual inspection of curve morphology, as this provides critical interpretive context beyond numerical fit indices.
Base rate determination
For standard taxometric analysis, we determined the base rate from previous literature rather than from sample-specific estimates. Roche et al. (Reference Roche, Creed, MacMahon, Brennan and Clarke2015a) reported FTD prevalence ranging from 5% to 91%, with 6% in healthy individuals being the most common estimate and 50.39% in patients, based on the single largest study in their review (Breier & Berg, Reference Breier and Berg1999). Given our sample composition (352 patients, 168 controls), this yielded a weighted mean base rate of 10.4%, which we used for initial taxometric analyses in the full sample (for precedent, see [Bräscher, Brähler, Häuser, & Witthöft, Reference Bräscher, Brähler, Häuser and Witthöft2024]; alternate sample-based approaches [Garber, Taisir, Costello, & MacKillop, Reference Garber, Taisir, Costello and MacKillop2025; Ren et al., Reference Ren, Zhou, Zhou, Schneider and Storch2020]). This base rate is an approximation based on a single large study. Given its fragility, and as base rate misspecification can bias standard CCFIs, our main interpretation is based on the CCFI profile analysis. These profile analyses systematically varied 39 simulated base rates from 0.025 to 0.975 in increments of 0.025, generating separate CCFI values across this range. This provides a less biased assessment of latent structure and more precise estimation when the structure is categorical (Ruscio et al., Reference Ruscio, Carney, Dever, Pliskin and Wang2018).
Prevalence analysis
We employed three complementary statistical approaches to determine optimal cutoff points for distinguishing clinically significant FTD from normal variation. TLI subconstruct scores were computed by summing the three picture scores of the two constituent TLI items for each subconstruct.
-
1. Intuitive Binarization Procedure: Following Liddle et al.’s original definition (Reference Liddle, Ngan, Caissie, Anderson, Bates, Quested, White and Weg2002), scores of 0.25 on individual TLI items were considered indicative of mild symptomatology. As our TLI subconstructs comprised two TLI items, summed subconstruct scores of 0.5 or below were classified as mild, with scores exceeding this threshold considered indicative of abnormal phenomena.
-
2. Receiver Operating Characteristic Analysis: For each TLI subconstruct, receiver operating characteristic (ROC) curves were constructed by plotting the true positive rate against the false positive rate across a range of cutoff values for patients versus controls classification. These ROC curves were used to identify the cutoff that optimally balances sensitivity and specificity. Overall discriminative performance was quantified using the area under the curve (AUC), where 1.0 indicates perfect discrimination and 0.5 indicates random chance.
-
3. Minimally Important Change Criteria: To identify optimal FTD cutoffs using MIC criteria, we employed the methodology outlined in Terluin, Eekhout, Terwee, and de Vet (Reference Terluin, Eekhout, Terwee and de Vet2015). The MIC in our study is defined as the TLI subconstruct score at which the likelihood ratio of being a patient or a control subject equals 1, calculated using logistic regression, modeling the odds of being in the patient group given TLI subconstruct scores. The MIC approach, though originally developed for longitudinal change detection, can be applied cross-sectionally. It locates the score where the odds of a binary state (e.g. improvement or patient versus control) equal one (Ingelsrud et al., Reference Ingelsrud, Terwee, Terluin, Granan, Engebretsen, Mills and Roos2018; Pedersen et al., Reference Pedersen, Roos, Thorlund, Terluin and Ingelsrud2021; Pua et al., Reference Pua, Tay, Terluin, Clark, Thumboo, Tay, Mah and Ng2023). MIC, ROC, and Binarization converge on qualitatively similar prevalence estimates, providing convergent validation.
Prevalence estimation
For each of the three analytical methods, we calculated prevalence estimates for each subconstruct. Prevalence was defined as the proportion of non-clinical participants whose scores exceeded the established cutoff point. We examined the convergence of prevalence estimates across methods and explored demographic correlates using appropriate statistical tests. Figures were created using Python (ver. 3.14.2) and Seaborn (ver. 0.13.2).
Co-occurrence analysis
We examined patterns of multi-construct FTD by calculating the proportion of participants showing elevations on all three subconstructs using each cutoff method. Co-occurrence rates were compared between patients and controls using Fisher’s exact tests. Effect sizes (Cohen’s h, odds ratios) were calculated to quantify the magnitude of group differences. We applied the Klein and Riso’s (D. N. Klein & Riso, Reference Klein, Riso and Costello1993) framework, as extended by Ruscio and Ruscio’s (Reference Ruscio and Ruscio2004) for dimensional constructs, to assess the potential sources of co-occurrence and correlations. This involved evaluating consistency of our observations against 11 theoretical explanatory models ranging from methodological artifacts to shared vulnerability.
Results
Sample characteristics
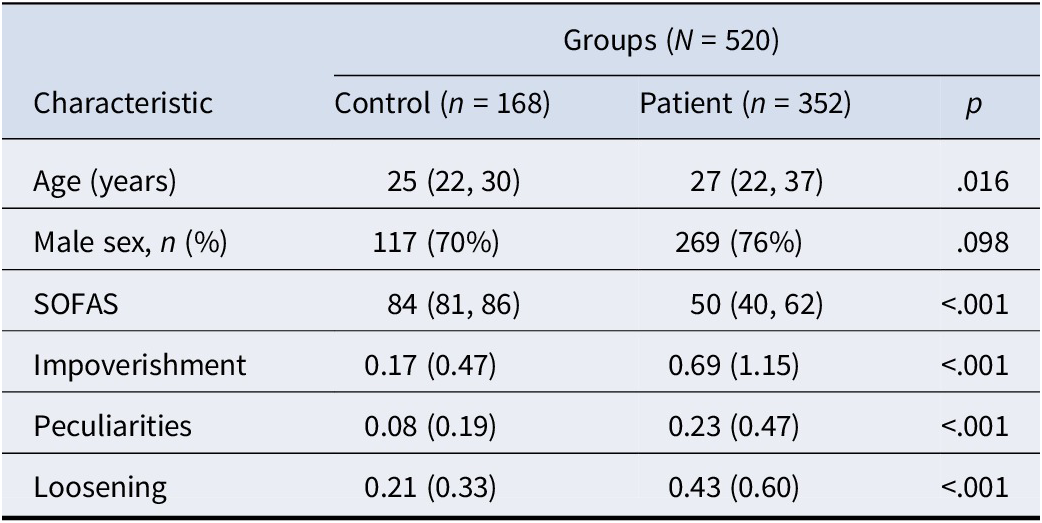
Participant demographics are presented in Table 1. All FTD subconstructs were significantly higher in patients compared to controls. Among controls, the highest mean scores were observed for the Loosening subconstruct, whereas patients scored highest in Impoverishment. For both groups, Peculiarities had the lowest mean scores. Age-adjusted group comparisons confirmed the same pattern (all p < .001).
Demographic and clinical characteristics

Table 1. Long description
The table presents data for a total of 520 participants, divided into a Control group (n = 168) and a Patient group (n = 352).
* Age (years): Control median 25 (22, 30); Patient median 27 (22, 37); p = .016.
* Male sex, n (%): Control 117 (70%); Patient 269 (76%); p = .098.
* S O F A S: Control median 84 (81, 86); Patient median 50 (40, 62); p < .001.
* Impoverishment: Control mean 0.17 (0.47); Patient mean 0.69 (1.15); p < .001.
* Peculiarities: Control mean 0.08 (0.19); Patient mean 0.23 (0.47); p < .001.
* Loosening: Control mean 0.21 (0.33); Patient mean 0.43 (0.60); p < .001.
Note: S O F A S stands for Social and Occupational Functioning Assessment Scale. Thought and Language Index scores (Impoverishment, Peculiarities, and Loosening) report mean and standard deviation due to zero-inflated distribution.
Note: Values shown as median (Q1, Q3) for continuous variables. SOFAS = Social and Occupational Functioning Assessment Scale (Morosini et al., Reference Morosini, Magliano, Brambilla, Ugolini and Pioli2000) – a single-item measure between 1 and 100 determined based on consensus with the clinical team, available medical notes, and information on daily functions provided by participants; higher values indicate better functioning. SOFAS values are available only for n = 432. Thought and Language Index scores (Impoverishment, Peculiarities and Loosening) are zero-inflated, so median and IQR alone would obscure the distribution, and mean (SD) is therefore reported for these variables. Age and SOFAS were non-normally distributed (Shapiro–Wilk); so, all group comparisons for continuous variables used Wilcoxon rank-sum tests, which make no distributional assumption; sex was compared using Pearson’s chi-squared test.
Taxonicity of FTD
Initial data screening confirmed the sample size (n = 520) for taxometric analysis as adequate, exceeding the recommended minimum of 300 cases. Nuisance covariance was within acceptable limits (mean within-group r = −0.26). Negative nuisance correlations reduced the eigenvalue peak expected under categorical structure in MAXEIG, biasing toward a dimensional appearance; however, MAMBAC, which examines mean differences rather than covariance matrices, is less affected by this issue. Indicator validity, assessed through between-group Cohen’s d effect sizes, was adequate for FTD with d = 1.51 (>1.25 recommended by Meehl (Reference Meehl1995) and Ruscio, Ruscio, and Carney (Reference Ruscio, Ruscio and Carney2011)).
The CCFI profile analysis across simulated base rates ranging from 0.025 to 0.975 yielded a mean CCFI of 0.37, with individual procedure CCFIs of 0.22 (MAMBAC), 0.45 (MAXEIG), and 0.42 (L-Mode), all below the 0.45 threshold, thus supporting dimensional structure. The profile analysis identified varying optimal base rates across procedures (MAMBAC: 28.9%, MAXEIG: 2.5%, L-Mode: 3.7%, mean: 2.5%), though critically, no stable region of taxonic fit (CCFI >0.55) emerged across the full range of simulated base rates, negating categorical or quasi-dimensional (i.e. emergence of taxa at certain base rates) interpretations. A patient-only CCFI profile also confirmed no taxonic structure (mean profile CCFI = 0.41; no method exceeding 0.55; see Supplementary Information S1).
Taxometric analysis using a literature-based base rate of 10.4% (derived from Roche et al., Reference Roche, Creed, MacMahon, Brennan and Clarke2015a) also supported the lack of the taxonic structure. MAMBAC analysis produced a predominantly flat curve consistent with dimensional structure (CCFI = 0.20). MAXEIG analysis showed a relatively flat curve with moderate elevation but no distinct peak characteristic of categorical structure (CCFI = 0.55). L-Mode analysis revealed a unimodal distribution (CCFI = 0.60), which likely reflects the positive skewness in TLI subconstruct distributions that L-mode may misidentify as taxonic. The mean CCFI across all three procedures was 0.45 at the threshold for dimensional interpretation.
A visual inspection of taxometric curves (Figure 1) corroborated the numerical findings. Empirical curves for all three procedures more closely resembled dimensional comparison data, characterized by flat or dish-shaped patterns, rather than categorical comparison data, which exhibit distinct peaks. Both the literature-based standard analysis (mean CCFI = 0.45) and the base rate-corrected CCFI profile analysis (mean CCFI = 0.37) converged on the same interpretation (mean of the 2 approaches = 0.41): FTD does not have a categorical latent structure, and is more likely to be dimensional in our combined patient-control sample.
Taxometric analysis of overall formal thought disorder (FTD). Left: the comparison curve fit index (CCFI) profile, showing the CCFI for each procedure (MAMBAC, MAXEIG, and L-Mode) and their mean across taxon base rates. CCFI values below 0.50 indicate dimensional structure; the profile remains below this line across the full range of base rates, with no stable taxonic region, giving a mean profile CCFI of 0.37. Right: taxometric curves for the three procedures (rows: MAMBAC, MAXEIG, and L-Mode), each compared against categorical (left column) and dimensional (right column) comparison data. In each panel, the bold black line is the empirical curve from the observed data, and the grey band with thin bounding lines shows the spread of the simulated comparison curves. Flat or dish-shaped curves signify dimensional latent structure; across all three procedures, the observed curves resemble the dimensional rather than the categorical comparison data. Using a literature-based taxon base rate of 0.10, the CCFIs were 0.20 (MAMBAC), 0.55 (MAXEIG), and 0.60 (L-Mode); combined with the profile analysis, the mean CCFI was 0.41; this also supports a dimensional interpretation.

Figure 1. Long description
The left panel is a line graph with Taxon Base Rate on the x-axis from 0.0 to 1.0 and C C F I on the y-axis from 0.0 to 1.0. A horizontal dotted line marks the 0.5 threshold. Four lines are plotted: a solid black line with circular markers representing the mean, and three dashed or dotted lines representing individual procedures. All lines remain below the 0.5 threshold across the entire x-axis range, showing a slight downward trend as the base rate increases.
The right section contains six smaller panels arranged in a 3 by 2 grid.
Top row: M A M B A C procedure. The x-axis is Cut and the y-axis is Mean Difference. Both the Categorical (left) and Dimensional (right) panels show upward-sloping curves. The bold empirical line in both panels closely tracks the center of the grey simulated band.
Middle row: M A X E I G procedure. The x-axis is Score and the y-axis is Eigenvalue. The Categorical panel (left) shows a jagged empirical line that rises and then plateaus, while the Dimensional panel (right) shows a similar trend where the bold line stays within the grey simulated region.
Bottom row: L-Mode procedure. The x-axis is Factor Score and the y-axis is Density. Both panels show a sharp, narrow peak near a factor score of 0. The bold empirical line forms a steep bell-shaped curve that aligns with the simulated dimensional data on the right.
Cutoff determination for prevalence
The ROC and MIC methods were used to identify optimal discriminative cutoffs (Table 2). ROC analysis produced similar cutoffs for all three FTD subconstructs (range: 0.624–0.673; see ROC curves in Supplementary Information S2). MIC consistently identified lower cutoffs for discriminating between patients and controls (range: 0.142–0.349), aligning with the low mean TLI subconstruct scores in controls. The intuitive binarization approach used a cutoff of 0.5 for all subconstructs.
Prevalence and co-occurrence of FTD by subconstruct, method, and group

Table 2. Long description
The table presents data for a total N of 520, consisting of 168 controls and 352 patients.
* Impoverishment:
- Binarization and R O C methods (cutoff > 0.5 and > 0.624 respectively) show 15 (8.9%) controls versus 107 (30.4%) patients; p < .001; O R 4.46; Cohen’s h 0.56.
- M I C method (cutoff > 0.349) shows 32 (19.0%) controls versus 142 (40.3%) patients; p < .001; O R 2.87; Cohen’s h 0.48.
* Peculiarities:
- Binarization and R O C methods (cutoff > 0.5 and > 0.673 respectively) show 2 (1.2%) controls versus 45 (12.8%) patients; p < .001; O R 12.15; Cohen’s h 0.51.
- M I C method (cutoff > 0.142) shows 35 (20.8%) controls versus 125 (35.5%) patients; p < .001; O R 2.09; Cohen’s h 0.34.
* Loosening:
- Binarization and R O C methods (cutoff > 0.5 and > 0.631 respectively) show 19 (11.3%) controls versus 91 (25.9%) patients; p < .001; O R 2.73; Cohen’s h 0.39.
- M I C method (cutoff > 0.309) shows 35 (20.8%) controls versus 131 (37.2%) patients; p < .001; O R 2.25; Cohen’s h 0.37.
* All 3 subdomains:
- Binarization/R O C (cutoff > 0.5) shows 0 (0.0%) controls versus 11 (3.1%) patients; p = .020; O R 11.33; Cohen’s h 0.26.
- M I C method (various cutoffs) shows 8 (4.8%) controls versus 37 (10.5%) patients; p = .030; O R 2.35; Cohen’s h 0.23.
Note: MIC = Minimally Important Change; ROC = Receiver Operating Characteristic; OR = Odds Ratio; CI = Confidence Interval. Single-subconstruct comparisons tested using Pearson’s chi-squared test; three-subdomain co-occurrence tested using Fisher’s exact test. Total N = 520 (168 controls, 352 patients). †Continuity correction (0.5 added to all cells) applied due to zero cell count. Binarization and ROC methods produced identical prevalence rates within each subconstruct as both methods classified the same cases above their respective thresholds (reflecting a distributional property due to the absence of observed scores in 0.5–0.624 range). The complete absence of three-domain convergence at the >0.5 threshold in controls supports the interpretation that concurrent elevation across all FTD dimensions represents clinically significant pathology, whereas single-dimension elevation may reflect dimensional variation.
Prevalence estimates
Critically, all three subconstructs of FTD were observable in apparently healthy populations, with no dimension showing an absence of cases in the non-clinical sample (Table 2). Regardless of the method used, prevalence was significantly lower in the control group than in the patient group (all p < .05). Binarization and ROC analyses yielded identical prevalence estimates of supra-threshold FTD with prevalence in healthy controls ranging from 1.2% (Peculiarities) to 11.3% (Loosening), whereas for the more sensitive MIC criteria, prevalence ranged from 19.0% (Impoverishment) to 20.8% (Loosening and Peculiarities) (Figure 2).
(A-C): Distribution of TLI subconstruct scores by group. Violin plots showing the distribution of (A) Impoverishment, (B) Peculiarities, and (C) Loosening scores for control (light grey) and patient (dark grey) groups. Horizontal dashed lines indicate cutoff values determined by binarization (solid line), ROC (large dotted line), and MIC (small dotted line) methods. Note the substantial overlap in distributions between groups and the presence of all subconstructs in the control group, supporting dimensional structure and population prevalence of FTD features. (D-F): Prevalence of FTD by subconstruct (D) Impoverishment, (E) Peculiarities, and (F) Loosening and cutoff method. Bar graph showing the percentage of controls (light grey) and patients (dark grey) exceeding cutoff thresholds for each subconstruct using three methods: (i) Intuitive Binarization, (ii) ROC Analysis, and (iii) MIC Criteria. Error bars represent 95% confidence intervals. All subconstructs show measurable prevalence in healthy controls, with estimates varying by method but consistently exceeding 5% (reference line) when using the most sensitive (MIC) criteria.
Note: TLI = Thought and Language Index; ROC = Receiver Operating Characteristic; MIC = Minimally Important Change.

Figure 2. Long description
Panel A, B, and C are violin plots showing T L I scores for Impoverishment, Peculiarities, and Loosening. The Y-axis represents T L I score, and the X-axis shows Control (light grey) and Patient (dark grey) groups. Each plot includes three horizontal lines for cutoff thresholds: Binarization (dotted), R O C (dashed), and M I C (dash-dot). In all three subconstructs, the patient group shows a wider distribution and higher peaks than the control group, though significant overlap exists.
Panels D, E, and F are bar graphs showing Prevalence percentage for the same three subconstructs. The Y-axis ranges from 0 to 50 percent. The X-axis lists the three cutoff methods: Binarization, R O C, and M I C. Light grey hatched bars represent Controls and solid dark grey bars represent Patients. A horizontal dashed line marks a 5 percent threshold.
* In Panel D (Impoverishment), prevalence is approximately 10 percent for controls and 30 to 40 percent for patients across methods.
* In Panel E (Peculiarities), control prevalence is very low for Binarization and R O C but rises to 20 percent for M I C, while patient prevalence ranges from 12 to 35 percent.
* In Panel F (Loosening), control prevalence is around 10 to 20 percent, while patient prevalence is between 25 and 38 percent.
Error bars on all bar graphs indicate 95 percent confidence intervals.
Co-occurrence of FTD subconstructs
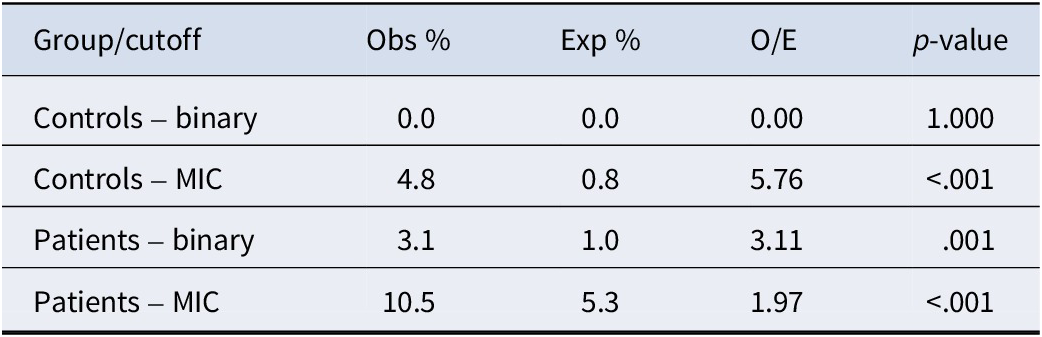
To clarify the nature of subconstruct associations, we evaluated the co-occurrence patterns using Klein and Riso’s (Reference Klein, Riso and Costello1993) framework. Multi-construct FTD co-occurrence significantly exceeds chance levels, indicating meaningful association between dimensions. Though relatively rare in healthy controls (range across methods: 0.0% for Binarization/ROC to 4.8% for MIC), co-occurrence of dimensions beyond any severity cut-off (MIC or Binarization method) is more frequent in patients (3.1–10.5%; odds ratios of 2.35–11.35). However, effect sizes remain small (Cohen’s h = 0.22–0.36), consistent with dimensional rather than categorical structure (Table 2). Critically, even in clinical samples, 89.5% of patients do not show elevations across all three dimensions, supporting relatively independent dimensions with shared vulnerability. The co-occurrence exceeded chance expectations for both MIC and Binarization cut-offs in patients, but only for MIC in healthy controls (Table 3). This was attributable to a specific consolidation of Impoverishment in the clinical sample (see Supplementary Information S3).
Observed versus expected co-occurrence rates of the three subdomains of FTD

Table 3. Long description
The table consists of five columns: Group/cutoff, Obs %, Exp %, O/E, and p-value.
* Controls – binary: Obs % 0.0, Exp % 0.0, O/E 0.00, p-value 1.000.
* Controls – M I C: Obs % 4.8, Exp % 0.8, O/E 5.76, p-value less than .001.
* Patients – binary: Obs % 3.1, Exp % 1.0, O/E 3.11, p-value .001.
* Patients – M I C: Obs % 10.5, Exp % 5.3, O/E 1.97, p-value less than .001.
A note below the table explains that it tests whether co-occurrence of all 3 F T D subdomains exceeds statistical independence. M I C stands for Minimally Important Change. O/E is the observed/expected ratio.
Note: Testing whether co-occurrence of all 3 FTD subdomains exceeds what would be expected if they were statistically independent. Under independence: P(A∩B∩C) = P(A) × P(B) × P(C). O/E = observed/expected ratio. P-values from binomial tests. MIC = Minimally Important Change.
Mapping our results onto Klein and Riso’s (Reference Klein, Riso and Costello1993) co-occurrence framework rules out most artifactual explanations for the observed subconstruct co-occurrence: the excess of observed over expected co-occurrence (O/E ratios of 1.97–5.76) confirms non-independence; the absence of categorical structure eliminates taxonic explanations; the modest shared variance (mean 8.1%) and presence of all subconstructs in healthy controls reject a unitary syndrome model. The data are most consistent with a shared etiology model in which common vulnerability factors increase the likelihood of elevations across subconstructs while permitting substantial independence among them. Full model evaluation is presented in Supplementary Information S4.
Sensitivity analyses removing site-related variance, sex-specific analysis, and schizophrenia-only sample are reported in Supplementary Information S5; these analyses continued to support the conclusion of lack of categorical taxonicity for FTD.
Discussion
This study provides direct taxometric evidence that FTD extends along a continuum into healthy populations. It also questions whether the term disorder in the label ‘FTD’ is the right word, given that in current usage it connotes an illness or disease (e.g. as in bipolar disorder). This parallels longstanding debates in mood and anxiety disorders, where decades of taxometric evidence consistently support dimensional structure (Haslam et al., Reference Haslam, McGrath, Viechtbauer and Kuppens2020) yet categorical diagnostic classifications are retained for pragmatic reasons. We advocate a similar position for FTD: reconceptualising threshold-based clinical designations as points of severity rather than as categorical boundaries of origin for FTD phenomenon. Put simply, much of the FTD goes unnoticed when only clinical thresholds are used to detect it.
All three subconstructs (Loosening, Peculiarities, and Impoverishment) are observable in apparently healthy individuals (purposefully recruited to have no first-degree relatives with psychotic disorders and no personal history of psychotic symptoms), with 7 of 9 cutoff-based estimates agreeing on >5% prevalence. These dimensional findings align with broader evidence that self-endorsed psychotic phenomena (e.g. psychotic-like experiences [Ahmed, Buckley, & Mabe, Reference Ahmed, Buckley and Mabe2012; Elahi et al., Reference Elahi, Perez Algorta, Varese, McIntyre and Bentall2017; Taylor, Freeman, & Ronald, Reference Taylor, Freeman and Ronald2016] and hallucinations [Elahi et al., Reference Elahi, Fletcher, Perez Algorta, White and Bentall2025]) exist along a continuum with the general population and extend this framework to a set of observed – not self-endorsed – signs of psychosis. The prevalence estimates of subclinical psychotic experiences in community samples are 5–8% (van Os et al., Reference van Os, Linscott, Myin-Germeys, Delespaul and Krabbendam2009); this is remarkably consistent with our FTD prevalence using stringent cutoffs.
FTD has been positioned as an endophenotypic marker of the schizophrenia diathesis (Gooding et al., Reference Gooding, Coleman, Roberts, Shenton, Levy and Erlenmeyer-Kimling2012; Gooding, Ott, Roberts, & Erlenmeyer-Kimling, Reference Gooding, Ott, Roberts and Erlenmeyer-Kimling2013; Morgan et al., Reference Morgan, Coleman, Ulgen, Boling, Cole, Johnson, Lerbinger, Bodkin, Holzman and Levy2017); our observation that >5% of healthy controls purposefully recruited to have no family history of psychosis show elevated subconstruct scores (Loosening/Impoverishment) support this stance. This also aligns with the evidence that the degree to which speech is organized varies greatly among speakers across the lifespan, due to a complex interplay of cognitive and environmental factors (Kidd, Donnelly, & Christiansen, Reference Kidd, Donnelly and Christiansen2018), in addition to polygenic influences (Legge et al., Reference Legge, Jones, Kendall, Pardiñas, Menzies, Bracher-Smith, Escott-Price, Rees, Davis, Hotopf, Savage, Posthuma, Holmans, Kirov, Owen, O’Donovan, Zammit and Walters2019).
The presence of measurable FTD subconstructs in healthy populations and their continuous distribution across clinical and non-clinical samples challenge the assumption that constructs of thought disorder are ‘qualitative departures’ (Andreasen, Reference Andreasen1986; Kircher et al., Reference Kircher, Krug, Stratmann, Ghazi, Schales, Frauenheim, Turner, Fährmann, Hornig, Katzev, Grosvald, Müller-Isberner and Nagels2014; Liddle et al., Reference Liddle, Ngan, Caissie, Anderson, Bates, Quested, White and Weg2002); instead, continuous variations in TLC likely contribute to this clinical phenomenon. This does not negate the practical value of clinical thresholds (e.g. ‘grossly disorganized’ or ‘markedly incoherent’ speech of DSM and ICD) though they force clinicians to make arbitrary decisions about pathological significance. We recommend dimensional severity ratings across Loosening, Peculiarities, and Impoverishment and assessment of their co-occurrence to complement such decisions. Within the specific domain of FTD-based risk assessment, instruments capturing the co-occurrence across dimensions, rather than elevation on any single item (e.g. disorganized speech), may have lower false positives and better predictive value in psychosis risk screening; this remains to be tested prospectively.
The dimensional structure we observe, combined with subconstruct co-occurrence patterns, constrains theoretical models of FTD. Applying Klein and Riso’s (Reference Klein, Riso and Costello1993) framework for diagnostic co-occurrence to our dimensional data rules out most artifactual explanations and rejects a unitary syndrome interpretation. Instead, the data support a shared etiology model wherein common vulnerability factors increase the likelihood of elevations across multiple dimensions while permitting substantial independence. This aligns with emerging conceptualizations of dynamic neurocognitive systems wherein clinically significant states emerge only beyond a tipping point (Scheffer et al., Reference Scheffer, Bockting, Borsboom, Cools, Delecroix, Hartmann, Kendler, van de Leemput, van der Maas, van Nes, Mattson, McGorry and Nelson2024a, Reference Scheffer, Bockting, Borsboom, Cools, Delecroix, Hartmann, Kendler, van de Leemput, van der Maas, van Nes, Mattson, McGorry and Nelsonb). The low absolute prevalence of multi-construct convergence, even in patients (89.5% lacking elevations across all three subconstructs), suggests, but does not demonstrate, that clinical FTD reflects varying combinations of partially independent mechanisms to overlap. This may explain the observed heterogeneity in speech phenotypes (Bambini et al., Reference Bambini, Frau, Bischetti, Cuoco, Bechi, Buonocore, Agostoni, Ferri, Sapienza, Martini, Spangaro, Bigai, Cocchi, Cavallaro and Bosia2022;Dalal et al., Reference Dalal, Liang, Silva, Mackinley, Voppel and Palaniyappan2024). Such mechanistic interpretations require prospective and experimental designs beyond the scope of this cross-sectional study.
The lack of three-domain co-occurrence in controls at conservative thresholds is not surprising as the individual subconstruct prevalences (1.2–11.3%) mean the expected number of triple co-occurrences (assuming independence) is <1 in 168 controls. But the meaningful finding is the patient–control asymmetry, with 3.1% of patients showing three-domain convergence versus 0% of controls (ROC method), driven in part by the higher single-subconstruct prevalences in patients. The specificity of more severe multi-construct patterns in patients suggests additional factors operate in the clinically ill group. A gradient of risk based explicitly on the coalescence of multiple dimensions (0 dimensions elevated [baseline] → 1 dimension [slightly elevated risk] → 2 dimensions [moderate risk] → 3 dimensions [substantial risk approaching clinical threshold]) may predict psychosis conversion; this working hypothesis, the FTD gradient requires prospective validation in longitudinal high-risk cohorts. Gooding and colleagues initially highlighted this in a youth cohort (Gooding et al., Reference Gooding, Ott, Roberts and Erlenmeyer-Kimling2013). Recent longitudinal speech-based studies also report higher predictive accuracy when features related to Losening (semantic coherence) are used in conjunction with Impoverishment (reduced syntactic complexity achieving 100% in a small sample of 34 high-risk participants [Bedi et al., Reference Bedi, Carrillo, Cecchi, Slezak, Sigman, Mota, Ribeiro, Javitt, Copelli and Corcoran2015]; acoustic signals in Tan et al. (Reference Tan, Lieu, Kai, Yang, Kk, Lwin and Goh2025), compared to features tapping only one subconstruct (e.g. [Corcoran et al., Reference Corcoran, Carrillo, Fernández-Slezak, Bedi, Klim, Javitt, Bearden and Cecchi2018]: 83% with mostly semantic coherence features [Rezaii, Walker, & Wolff, Reference Rezaii, Walker and Wolff2019]: 80% with semantic density alone).
Study strengths include substantial sample size (N = 520), which exceeds the recommended taxometric minima, multi-site data collection enhancing external validity, and comprehensive convergent methodology, employing three complementary taxometric procedures and multiple cutoff determination methods, and the use of the TLI, which permits dimensional assessment of the thought form in non-clinical populations through standardized picture description rather than symptom-focused psychiatric examination. Several limitations also warrant consideration. First, our cross-sectional design precludes determining whether FTD elevations in healthy individuals represent stable traits, transient states, or markers of future psychosis risk. Second, while multi-site design enhances generalizability, site-specific differences in assessment procedures, or population characteristics may introduce heterogeneity, however, our sensitivity analysis removing site-related variance was consistent with our original analysis (Supplementary Material S5). Third, our non-clinical sample was group-matched and recruited primarily for neuroimaging studies, reducing the prevalence of physical ailments, substance use problems, and genetic loading. Our estimated FTD rates should thus be considered conservative and not directly comparable to survey-based estimates of self-endorsed psychotic symptoms. Fourth, we also lacked questionnaire-based assessments of psychotic-like experiences among healthy controls. Understanding whether subclinical FTD tracks the broader extended psychosis phenotype in prospective multi-measure designs is an important priority for future studies. Fifth, subjective FTD could not be measured with the current approach; scales such as TALD (Kircher et al., Reference Kircher, Krug, Stratmann, Ghazi, Schales, Frauenheim, Turner, Fährmann, Hornig, Katzev, Grosvald, Müller-Isberner and Nagels2014) are better suited to address this component, which is especially important in the context of depression (Palaniyappan, Wang, & Meister, Reference Palaniyappan, Wang and Meister2026). Most rating scales have construed the subjective aspect of FTD to contribute to categorical discontinuities in the phenotype (see Sreeraj et al., Reference Sreeraj, Voppel, Venkatasubramanian and Palaniyappan2026; Palaniyappan, Wang, & Meister, Reference Palaniyappan, Wang and Meister2026). In this case, their absence from the present analysis would have biased our findings toward dimensionality.
Many critical questions emerge from our work. Do subclinical FTD features in healthy individuals remain stable, remit, or predict later psychosis? What distinct neural processes underlie each subconstruct’s emergence and clinical coupling/decoupling? Can automated speech analysis capture these dimensional variations for scalable assessment? Can dimension-specific interventions reduce accruing severity (e.g. targeting semantic network dysfunction for Loosening versus supporting communication spontaneity for Impoverishment), prevent clinical coalescence of the FTD subconstructs? Such preventive interventions need not wait for risk thresholds to be crossed, though this possibility requires careful empirical validation of subclinical FTD’s predictive utility and early intervention effectiveness.
We conclude that FTD has a continuous, dimensional structure extending to the general population. Measurable FTD in over 5% of apparently healthy individuals reinforces the need to study non-clinical populations with continuous measurement approaches tapping language and thought that preserve severity information in mechanistic studies. Despite the absence of natural discontinuities, higher severity with syndromic tendency (all 3 subconstructs crossing a threshold) appears to be more likely among patients with psychosis. Future research should examine pathways of convergence, its transdiagnostic nature as well as the temporal trajectory of these dimensional thought disturbances to refine risk assessment and develop targeted interventions.
Supplementary material
The supplementary material for this article can be found at http://doi.org/10.1017/S0033291726106084.
Acknowledgments
We would like to thank the patients for taking the time to participate in this study, as well as the numerous research assistants and clinicians who were involved in this project. The authors wish to thank Estee Balles, Paulina Dzialoszynski, Sabrina D. Ford, and Betsy Schaefer (London Health Sciences Center), Nadia Zeramdini (Douglas Research Center) for clinical recruitment and coordination, Drs. Julie Richard and Hooman Ganjavi for logistical support, Drs. Ridha Joober, David Bloom, Rohit Lodhi, Karim Tabbane and Martin Lepage (Douglas University Mental Health Institute) for assistance with recruitment, Emanuel Schwarz (Heidelberg), Alkomiet Hasan, and Nikolas Koutsouleris (Munich) for resources, Zia Katshu and Mohan Rathnaiah (University of Nottingham), Catherine C. Gregory (University of Manchester) and Gemma Williams (Cardiff University) for recruitment to SPRING, all staff members of PEPP-London for recruitment and clinical support, and all participants for their time and effort in participating in the study. We thank the DISCOURSE consortium (https://discourseinpsychosis.org/) Steering Group for their assistance in developing the speech assessment protocol.
Author contribution
Data Curation, Formal Analysis, Visualization, Writing Original Draft, and Writing – Reviewing and Editing: F.A.; Data Acquisition, Data Curation, and Writing – Reviewing and Editing: J.A.; Writing – Reviewing and Editing: B. D.; Resources and Writing – Reviewing and Editing: V.B.; Writing – Reviewing and Editing: N.A.H.; Writing – Reviewing and Editing: T.K.; Writing – Reviewing and Editing: G.K.; Data Acquisition, Data Curation, and Writing – Reviewing and Editing: P.F.L.; Data Acquisition, Data Curation, and Writing – Reviewing and Editing: M.M.; Writing – Reviewing and Editing: S.L.R.; Resources and Writing – Reviewing and Editing: K.D.S.; Writing – Reviewing and Editing: I.E.S.; Data Acquisition, Data Curation, and Writing – Reviewing and Editing: A.V.; Data Acquisition, Data Curation, and Writing – Reviewing and Editing: F.Z.; Conceptualization, Resources, Data Acquisition, Supervision, Funding Acquisition, Writing Original Draft, and Writing Reviewing and Editing: L.P.
Funding statement
DISCOURSE-UWO: Data collected for this study were supported by the Academic Medical Organization of Southwest Ontario (AMOSO Innovation).
TOPSY: Data acquisition was supported by the Canadian Institutes of Health Research Foundation Grant (375104/2017), Innovation Fund for Academic Medical Organization of Southwest Ontario, Bucke Family Fund, The Chrysalis Foundation, and The Arcangelo Rea Family Foundation (London, Ontario).
IMPLEMENT: This work was supported by the Canadian Institutes of Health Research (CIHR) – ERA-Net Personalized Medicine Program (#ENP-161423).
SPRING: This work was supported by the Medical Research Council (grant number MR/K020803/1). Experimental Medicine Challenge project grant: Defining the disturbance in cortical glutamate and GABA function in psychosis, its origins, and consequences. We would also like to acknowledge the Medical Research Council (grant number MR/M006301/1) and Medical Research Council (grant number MR/K005464/1).
WOW: Data acquired for this study were funded by grant 371730 from the Canadian Institutes of Health Research Project Grant.
A. Voppel is supported by NARSAD Young Investigator Grant 32574 from the Brain & Behavior Research Foundation. J. Ahrens is supported by the Canadian Institutes of Health Research, Schizophrenia Society of Canada Foundation, the Canadian Consortium for Early Intervention in Psychosis, the Fonds de Recherche du Quebec – Santé, and Quebec Bio-Imaging Network. L. Palaniyappan is supported by Monique H. Bourgeois Chair in Developmental Disorders, the Academic Medical Organization of Southwestern Ontario (AMOSO) Opportunities Fund, Tanna Schulich Endowment, Academic Medical Organization of the Southwestern Ontario (Opportunities Fund), Bucke Funds, Chrysalis, and the Wellcome Trust (Research Training Fellowship WT096002/Z/11/Z). LP received a salary award from the Fonds de recherche du Quebec-Santé (FRQS: 366934).
Tilo Kircher receives funding from the German Research Foundation (DFG) FOR 2107, SFB/TRR 393 (‘Trajectories of Affective Disorders’, project grant no 521379614), the Germany’s Excellence Strategy (EXC 3066/1 ‘The Adaptive Mind’, Project No. 533717223), as well as the DYNAMIC center, funded by the LOEWE Program of the Hessian Ministry of Science and Arts (grant number: LOEWE1/16/519/03/09.001(0009)/98).
Competing interests
LP reports personal fees for serving as chief editor for the Canadian Medical Association Journals, speaker honorarium from Janssen Canada and Otsuka Canada, SPMM Course Limited, UK; book royalties from Oxford University Press; investigator-initiated educational grants from Otsuka Canada outside the submitted work, in the last 5 years. KDS is a member of the scientific advisory board for Draig Therapeutics. The other authors have no competing interests to disclose.
Declaration of generative AI and AI-assisted technologies in the writing process
During the preparation of this work the authors used Anthropic’s Claude Sonnet 4.5 to check R codes, re-assemble python scripts, reduce word count, and organize the written material. After using these tools, the authors reviewed and edited the content as needed and take full responsibility for the content of the published article.




 Open access

