Introduction
Obesity is the condition of increased body weight caused by excessive accumulation of fat (Mansour & Al-Jazairi, Reference Mansour and Al-Jazairi2007). Measuring percentage body fat is an ideal way of diagnosing obesity (Morimoto et al., Reference Morimoto, Nishimura, Kanda, Sano, Matsudaira and Miyashita2007). The use of a gold standard measure of this is not always feasible in a clinical setting. Simple anthropometric measures such as waist circumference (WC), hip circumference (HC), waist-to-hip ratio (WHpR), waist-to-height ratio (WHtR) and triceps skin-fold thickness have therefore been adopted as indicators of abdominal adiposity (Lean et al., Reference Lean, Han and Deurenberg1996; Wang, Reference Wang2003; Sebo et al., Reference Sebo, Beer-Borst, Haller and Bovier2008; Ryan et al., Reference Ryan, Crowley, Hensey, McGahey and Gorml2014). These have been found to be strongly associated with trunk and total body fat (Neovius et al., Reference Neovius, Linne and Rossner2005; Taylor et al., Reference Taylor, Williams, Grant, Ferguson, Taylor and Goulding2008; Oka et al., Reference Oka, Miura, Sakurai, Nakamura, Yagi and Miyamoto2009; Matsushita et al., Reference Matsushita, Nakagawa, Shinohara, Yamamoto, Takahashi and Mizoue2014). According to the World Health Organization, WC along with WHpR provide an approximate indication of intra-abdominal fat mass and total body fat (Rastogi et al., Reference Rastogi, Pinto, Pai and Kanchan2012).
It is important to take into account ethnic differences when associating the amount of body fat with WC or WHpR (Lear et al., Reference Lear, James and Ko2010). Many studies have indicated that WC guidelines should be modified for different ethnic groups (Palaniappan et al., Reference Palaniappan, Carnethon, Wang, Hanley, Fortmann and Haffner2004; Appel, Reference Appel2004). Some validation studies have been done in Middle Eastern countries to determine the accuracy of WC and HC in estimating body fatness, by comparison with more refined measures (Bouguerra et al., Reference Bouguerra, Alberti and Smida2007; Al-Lawati & Jousilahti, Reference Al-Lawati and Jousilahti2008; Delavari et al., Reference Delavari, Forouzanfar and Alikhani2009). However, the commonly used cut-off points for WC and WHpR are based on studies undertaken predominantly in populations of European origin (WHO, 2011). These correlations have been well documented in Western populations, but to the best of the authors’ knowledge very few such studies have been done in Middle Eastern settings (Lear et al., Reference Lear, James and Ko2010).
In view of the present and future health problems associated with excess adipose tissue, underestimation of obesity, particularly in young adults who might otherwise appear to have normal anthropometric indices, could lead to false conclusions about body composition and future health status (Carpenter et al., Reference Carpenter, Yan, Chen, Hong, Arechiga and Kim2013). There are many techniques to measure body composition, and the accuracy and reliability of these are critical (Levenhagen et al., Reference Levenhagen, Borel, Welch, Piasecki, Piasecki, Chen and Flakoll1999). Reference techniques such as the measurement of total body fat by deuterium oxide dilution can be a good option in developing regions that do not have access to gold standard methodology like four-compartment models (Valencia et al., Reference Valencia, Aleman-Mateo, Slazar and Hernandez-Triana2003).
A nationally representative survey of body size and fatness has never been undertaken in the Syrian population. This study therefore aimed to examine the relation between WC, HC, WHpR, WHtR and triceps skin-fold thickness and percentage body fat in young Syrian men aged 18–19 years, and to develop equations that use these anthropometric measures to estimate body fat composition in these subjects.
Methods
Participants
The study was performed during 2010–2011. The participants were 2470 apparently healthy 18- to 19 year-old Syrian men who had recently been recruited to the army after having a medical examination in the medical army centre in Damascus city. Subjects were excluded if they were suffering from an acute illness that could cause abnormalities in body composition. Subjects were asked to abstain completely from consuming food and drink for the 12 hours before data collection. All anthropometry measurements and sampling were completed in a single session. The study protocol was approved by the scientific research and ethical committee of the Atomic Energy Commission of Syria (AECS). Each participant gave their informed consent prior to participation after a detailed explanation of the study protocol. The study was performed in accordance with guidelines prescribed by the Helsinki Declaration of the World Medical Association.
Anthropometry measurements
Subjects’ body weight was measured in light clothing with electronic scales (Seca, Model 7671321004, Germany; D=0.05–0.1 kg). The accuracy of the scales was confirmed using a weight of known mass (20 kg). Height was measured to the nearest 0.5 cm with a wall-mounted stadiometer (Seca, Model 225, 1721009, Germany). Skin-fold thicknesses were measured at the triceps sites with Lange skin-fold calipers (Beta Technology Incorporate, Cambridge, MD, USA). Using non-stretchable standard tapes, waist circumference was measured over the unclothed abdomen at the narrowest point between the costal margin and iliac crest, and hip circumference was measured over light clothing at the level of the widest diameter around the buttocks.
Body composition measurement using the deuterium dilution (DD) reference method
The body composition (fat mass (FM) and fat-free mass (FFM)) of 213 subjects was determined from the total body water (TBW) measurement, which was determined using the deuterium dilution (DD) reference method. This is an isotope dilution technique that uses deuterium oxide according to the plateau method (Coward, Reference Coward1990) and mass spectroscopy (IDECG, 1990). The dose used was equivalent to 0.05 g D2O per kilogram body weight (99.8% atom present excess; Cambridge Isotope (D2O) Laboratories Inc., UK). Saliva samples were taken from each subject after a 6–12 hour fast, before the administration of the deuterium dose, and 3–4 hours afterwards. Absorbent salivates (Sarstedt, Rommelsdorf, Germany) were used to collect the saliva. The samples were analysed using Isoprime Ratio Mass Spectrometry (IRMS, GV Instruments). The enrichment of deuterium values obtained were expressed relative to secondary standards (low-enrichment and high-enrichment standard water were similarly prepared to normalized data against V-SMOW-SLAP-GISP; Vienna Standard Mean Ocean Water/Standard Light Antarctic Precipitation, Greenland Ice Sheet Perception). All samples were prepared and analysed in triplicate.
The TBW was calculated from the ‘deuterium dilution space’ (N), which was calculated using the equation of Halliday and Miler (Reference Halliday and Miler1977):
 $$N{\rm =(}TA/a{\rm )}{\asterisk}((E_{{\rm a}} -E_{{\rm t}} )/(E_{{\rm s}} -E_{{\rm p}} )),$$
where A is the amount of isotope given in grams, a is the portion of the dose in grams retained for mass spectrometer analysis, T is the amount of tap water in which the portion of a is diluted before analysis, and E a, E t, E p and E s are the isotopic enrichments in delta units of the portion of dose, the tap water used, the pre-dose saliva sample and the post-dose saliva sample, respectively. The deuterium dilution space was assumed to overestimate TBW by a factor of 1.04 (Forbes, Reference Forbes1987). The fat-free mass (FFM) was calculated from the TBW, assuming that FFM has a hydration constant of 0.73 (Pace & Rathburn, Reference Pace and Rathburn1945). Subjects’ fat mass (FM) was calculated from their scale weight minus FFM.
Body composition measurements using anthropometric indices
The subjects’ percentage body fat was predicted from ‘WC’ and ‘WC with triceps skin-fold thickness’ measurements using equations that have been previously validated in this population by Lean et al. (Reference Lean, Han and Deurenberg1996):
 $${\rm Body}\,{\rm fat}\,{\rm mass}\,\,\%\,\,({\rm man})\,{\rm =\{ }0.{\rm 567}{\times}{\rm WC (cm)\} {\plus}}\{ 0.{\rm 1}0{\rm 1}{\times}{\rm Age}\,({\rm years}){\minus}{\rm 31}.{\rm 8}\} $$
 $$\eqalignno{{\rm Body} \ {\rm fat} \ {\rm mass}\,\,\ %\,\,({\rm man})\,{\rm =\{ }0.{\rm 353}{\times}{\rm WC (cm)\} }\cr \quad{{\plus}\{ }0.{\rm 756}{\times}{\rm Triceps(mm)\} {\plus}}0.{\rm 235}{\times}{\rm Age (years)}\} -{\rm 26}.{\rm 4}$$
Statistical analysis
The anthropometric data were analysed using SPSS version 17.0.1 (2001, SPSS Inc., Chicago, USA). The variables were computed as means±standard deviations (SD). The approach of Bland and Altman (1996) was used to compare the body fat mass (FM) as measured by the reference method with that estimated from the prediction equations. Multiple regression analysis was performed to assess the relation between the variables, and the coefficients of determination (R 2) for each regression model were calculated. The level of significance was taken as p<0.05.
Results
Body characteristics and composition
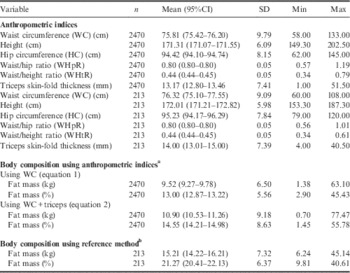
The physical body characteristics and body composition data for the 2470 men are summarized in Table 1. The mean body height and triceps skin-fold thickness of the subjects were 171.31±6.09 cm and 13.17±7.41 mm, respectively. The mean waist and hip circumferences were 75.81±9.79 cm and 94.42±8.15 cm, and the waist-to-hip and waist-to-height ratios were 0.80±0.05 and 0.44±0.05, respectively. The mean percentage body fat values calculated using Lean et al.’s (Reference Lean, Han and Deurenberg1996) equations (1) and (2) were 13.00±5.56% and 14.55±8.63% respectively. For the 213 subjects whose body composition was determined using the DD technique, the mean total percentage body fat was 21.27±6.37% (range 9.81 to 40.61%) (p<0.01) (Table 1).
Anthropometric indices of young Syrian men aged 18–19 years and their percentage body fat (FM) calculated using Lean et al.’s (Reference Lean, Han and Deurenberg1996) equations and the deuterium dilution (DD) reference method

a According to Lean et al.’s (Reference Lean, Han and Deurenberg1996) equations.
b According to the Deuterium Dilution (DD) technique.
Agreement between WC equations
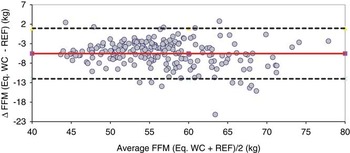
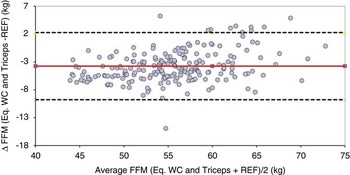
Figures 1 and 2 show the Bland–Altman plots of the differences between the predicted body fat free mass (FFM) values calculated using the two developed predictive Lean et al. (Reference Lean, Han and Deurenberg1996) equations (1) and (2) and those measured using the DD reference method. The limits of agreement for the estimated FFM derived from the Lean et al. (Reference Lean, Han and Deurenberg1996) equation (1) vs the FFM derived from our equation were ±3.06 kg at 2 SD (Fig. 1). The limits of agreement for FFM derived from the Lean et al. (Reference Lean, Han and Deurenberg1996) equation (2) vs the FFM derived from our equation were ±3.08 kg at 2 SD (Fig. 2).
Validity of using WC, HC, WHpR and WHtR to measure percentage body fat
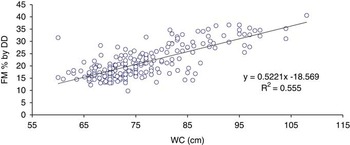
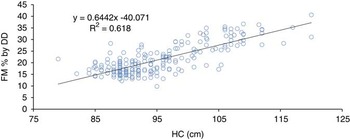
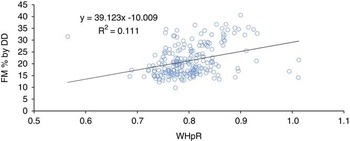
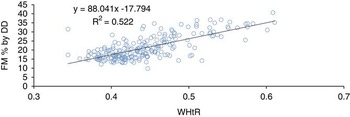
Percentage body fat mass, as measured using the DD reference method, showed a positive correlation with WC (R 2=0.555; standard error of the estimate (SEE) 4.30% p<0.01) (Fig. 3), HC (R 2=0.618; SEE 3.98%; p<0.01) (Fig. 4) and WHtR (R 2=0.522; SEE 4.45%; p<0.01) (Fig. 6). However, WHpR did not show a significant correlation with percentage body fat mass, and the relationship was weak (R 2=0.111; SEE 6.07%; p<0.01) (Fig. 5).
Using a better, multiple linear regression model, the following WC, HC, WHtR and WHtR prediction equations for young adults are proposed:
 $${\rm Body}\,{\rm fat}\,\,\%\,{\rm =}\,0.{\rm 5221}{\times}{\rm WC (cm)-18}.{\rm 569}$$
 $${\rm Body}\,{\rm fat}\,\,\%\,{\rm =}\,0.{\rm 6442}{\times}{\rm HC(cm)-4}0.0{\rm 71}$$
 $${\rm Body}\,{\rm fat}\,\,\%\,{\rm =39}.{\rm 123}{\times}{\rm WHpR}-{\rm 1}0.00{\rm 9}$$
 $${\rm Body}\,{\rm fat}\,\,\%\,{\rm =88}.0{\rm 41}{\times}{\rm WHtR}-{\rm 17}.{\rm 794}$$
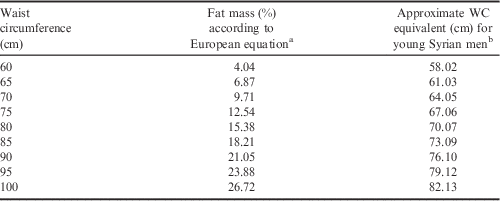
With WC values of 80, 90 and 100 cm, using equation (1) the predicated percentage body fat values were 15.38%, 21.05% and 26.72%, which equate to WCs of 70.07, 76.10 and 82.13 cm in the young Syrian men in this sample (Table 2).
Comparison of WC and corresponding percentage body fat levels in European populations with predicted equivalents for young Syrian men derived from regression equations
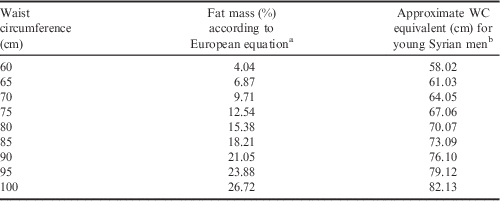
a According to Lean et al.’s (Reference Lean, Han and Deurenberg1996) equation.
b According to this study’s regression.
Discussion
Very few studies of body composition have been conducted in young Middle Eastern Arab adults, and body composition equations using anthropometric dimensions have not previously been published for such populations. The current study was designed to evaluate the relationship between percentage body fat and waist circumference (WC), hip circumference (HC), waist-to-hip ratio (WHpR), waist-to-height (WHtR) and triceps skin-fold thickness in young Syrian men.
Although some techniques are more accurate and precise than others, there is no gold standard for body composition measurements in vivo. All methods involve assumptions that do not hold true in every case, and the best model uses a combination of measurements whereby the importance of such assumptions is minimized. This study determined total body fat using the deuterium dilution technique (DD) (Lohman et al., Reference Lohman, Caballero, Himes, Davis, Stewart and Houtkooper2000) as the reference method to develop reference equations in young Syrian men. This study’s estimates of percentage body fat using Lean et al.’s (Reference Lean, Han and Deurenberg1996) equations were 13.00% and 14.55%, which are low in comparison with that determined using the reference method (21.32%).
There is substantial evidence for ethnic differences in the relation between WC and WHpR and percentage body fat. Several epidemiological studies in Asian populations have shown that Asians have higher amounts of body fat at lower waist circumferences than do Western populations (Lean et al., Reference Lean, Han and Deurenberg1996; Wildman et al., Reference Wildman, Gu, Reynolds, Duan and He2004; Lear et al., Reference Lear, Humphries and Frohlich2007a, Reference Lear, Humphries and Kohlib). African populations and, possibly, Pacific Islanders have less visceral adipose tissue or a lower percentage of body fat at any given waist circumference (Rush et al., Reference Rush, Goedecke and Jennings2007, Reference Rush, Freitas and Plank2009).
The results of this study indicate that there is a significant linear relationship between percentage body fat mass and anthropometric indices. This means it is possible to estimate percentage body fat mass from WC, HC and WHtR, at least among this group of young Syrian men. Therefore, estimation of percentage body fat using anthropometric indexes could be an alternative method for those who do not have body composition data. When studies in Asian populations are taken together, Asians appear to have an increased metabolic risk at lower waist circumference and waist-to-hip ratio than Europeans. This is probably due to their higher levels of body fat and abdominal adipose tissue. In particular, those studies that included a European or Caucasian comparison group indicated a lower waist circumference for Asians, and some also suggested a lower waist-to-hip ratio (Diaz et al., Reference Diaz, Mainous and Baker2007; Huxley et al., Reference Huxley, Barzi and Lee2007, Reference Huxley, James and Barzi2008).
The use of anthropometric indicators such as WC to estimate total body fat is more practical, and provides a better guide than body mass index (BMI). Waist circumference is widely described as being an indicator of ‘abdominal obesity’, and does indicate the intra-abdominal fat mass among people with similar total body fat content. In most studies, variations in total body fat have more influence on WC than do variations in intra-abdominal fat (Lean, Reference Lean2010). According to WHO, WC along with the WHpR is an approximate indicator of intra-abdominal fat mass and total body fat (Park, Reference Park2005; Rastogi et al., Reference Rastogi, Pinto, Pai and Kanchan2012).
In conclusion, this study suggests the possibility of developing ethnic-specific equations relating FFM (from which percentage body fat can be derived), obtained using deuterium dilution measurements of total body water, to WC, HC, WHpR and WHtR. It is important to establish that such ethnic-specific equations require a demonstration of differential predictive validity and not simply a demonstration of different marginal distributions of the predictor. These equations can be used to calculate body fat as a percentage of body weight for each individual.
Difference (bias; solid line) ±2 SD (dashed lines) in the predicted FFM (kg) derived from WC using the Lean et al. (Reference Lean, Han and Deurenberg1996) equation and FFM (kg) measured using the DD method.

Difference (bias; solid line) ±2 SD (dashed lines) in the predicted FFM (kg) derived from WC and triceps skin-fold thickness using the Lean et al. (Reference Lean, Han and Deurenberg1996) equation and FFM (kg) measured using the DD method.

Correlation between percentage FM derived using the DD method and waist circumference (cm) for young Syrian adults.

Correlation between percentage FM derived using the DD method and hip circumference (cm) for young Syrian adults.

Correlation between percentage FM derived using the DD method and waist-to-hip ratio (WHpR) for young Syrian adults.

Correlation between percentage FM derived using the DD method and waist-to-height ratio (WHtR) for young Syrian adults.

Acknowledgments
The authors wish to express their deep appreciation to the Director General of AECS. The support of the International Atomic Energy Agency under the Technical Research Contract No. SYR/6/012 is gratefully acknowledged.