I. INTRODUCTION
Metallic glass (or amorphous alloy) was first obtained in the Au–Si system by liquid melt quenching (LMQ) in 1960Reference Klement, Willens and Duwez1 and since then a large number of experiments and theoretical studies have been carried out to investigate one of the basic issues in the field of metallic glasses, i.e., glass-forming ability (GFA) of a binary metal system.Reference Ruhl, Giessen, Cohen and Grant2, Reference Poon and Carter3 Many approaches have been proposed for evaluating the GFA of metal systems. For instance, EgamiReference Egami4 proposed an empirical rule for favoring bulk metallic glass formation based on the following four conditions: increasing the atomic size ratio of the constituent elements, the number of elements involved, the interaction between the small and large atoms, as well as introducing repulsive interactions between small atoms. In practice, a quantitative measure of the GFA is glass-forming composition range (GFR), within which amorphous alloy can be obtained through some glass-producing techniques. Experimentally, the GFR is generally determined by specific glass-producing techniques. For example, applying the mechanical alloying (MA) technique, Hellstern and SchultzReference Hellstern and Schultz5 obtained the GFR of the Fe–Zr binary system and Eckert et al.Reference Eckert, Schultz, Heilstern and Urban6 obtained that of the Ni–Zr system. In addition, another powerful solid-state technique, ion beam mixing (IBM), has been used to produce amorphous alloys and to determine the GFR of binary metal systems.Reference Zhang, Bai, Qiu, Yang, Tao and Liu7 An effective cooling speed in IBM evaluated by the atomic collision theory could be as high as 1013–1014 K/s,Reference Thompson8 which is much higher than that involved in LMQ; IBM is therefore one of the most powerful means in producing metallic glasses. To a specific system, various glass-producing techniques, because of their various capabilities, could obtain various GFRs, which could be defined as nominal GFRs of the system. However, to the authors’ view, there should be an intrinsic GFR, which reflects the maximum possible composition range energetically favored for metallic glass formation, and the intrinsic GFR should be determined by some internal characteristics/properties of the system. The nominal GFR of a system observed by IBM could be closer to the intrinsic GFR of the system than those obtained by other glass-producing techniques.
In theoretical studies, many models have been proposed for evaluating the GFR.Reference Lu, Tan, Li and Ng9–Reference Schwarz, Nash and Turnbull14 In these models, the main idea of determining the GFR is to consider a competition between terminal solid solutions and amorphous phases. This is based on the summary of a great number of experimental results, which show a common essence for various glass-producing techniques to form metallic glasses being a competition between simple solid solutions and amorphous phases, because the formation of stable crystalline phases with complicated structures observed in phase diagrams is kinetically frustrated during the nonequilibrium processes. A semiempirical approach, i.e., the Miedema’s theory, has been applied to predict the GFRs of binary metal systems by comparing the Gibbs free energies of the competing crystalline solid solution and its amorphous phase counterpart. According to this theory, Basu et al.Reference Basu, Murty and Ranganathan15 calculated the GFR of the Cu–Ti binary system and the calculation results matched with experimental results. Zhang et al.Reference Zhang, Li, Lin, Liu and Ma16 proposed an atomistic method to determine the GFR of a binary metal system directly from the interatomic potential of the system based on solid-solution model through molecular dynamics (MD) simulations. According to this method, Zhang et al.Reference Zhang, Lai and Liu17 determined the maximum solid solubility of the Ni–Mo binary system as the boundaries within which the central composition region was considered to be the GFR of the binary system via interatomic potentials. The GFRs determined by theoretical models can be used to guide metallic glass producing which, in practice, employs various nonequilibrium producing processes, such as LMQ, IBM, or solid-state reaction of multiple metallic multilayers, mechanical alloying (MA), etc. In addition to producing metallic glasses, these nonequilibrium producing processes can also be used to obtain a variety of other metastable materials. For example, oxide dispersion-strengthened ferritic steels processed by MA are proposed as the structure material candidate for nuclear reactors due to their excellent mechanical and anti-irradiation properties at both room and elevated temperatures.Reference Klueh, Shingledecker, Swindeman and Hoelzer18
The method of determining GFR proposed by Zhang et al.Reference Zhang, Li, Lin, Liu and Ma16 has been successfully applied for the binary metallic systems with various combinations of body-centered-cubic (bcc), face-centered-cubic (fcc), and hexagonal-close-packed (hcp) structured metals and varying thermodynamic characteristics ranging from large positive to large negative heats of formation.Reference Liu, Li and Lai19 A question arises naturally whether the method can be applied to determine the GFR of the multicomponent systems, e.g., the ternary systems with different structures of component metals. Because the metallic glasses are metastable phases, production of them can only be achieved by nonequilibrium approaches, which kinetically frustrate the nucleation and growth of the equilibrium phases with complicated structures. During the nonequilibrium process, the crystalline phases with simple bcc, fcc, or hcp structures, namely solid solutions, could be formed and their appearance hinder the formations of metallic glasses. Thus, only the competition between terminal solid solutions and metallic glasses is needed to consider for predicting GFR of the multicomponent systems. Because the MD simulation is a powerful tool to study the relative stability of solid solutions versus metallic glasses (or amorphous phases), this motivates us to extend Liu’s methodReference Zhang, Li, Lin, Liu and Ma16 for determining GFR of the multicomponent systems by MD simulations. In this study, we chose the Cu–Zr–Ti ternary system, because it is a significant bulk-glass former observed in the experiments, which can provide experimental data for comparison with theoretical prediction. The Cu–Zr–Ti ternary system consisting of fcc and hcp structure metals is different with another ternary Ni–Nb–Ta systemReference Dai, Li, Che and Liu20 with fcc-bcc-bcc metal combination reported in the literature. The study of GFR in multicomponent systems with different structured metal combinations will directly verify whether the MD method using solid-solution model can be used as a GFR predicting tool for guiding practice production of metallic glasses. Therefore, we have constructed the Cu–Zr–Ti ternary interatomic potential and then applied the MD method to evaluate the GFR of the Cu–Zr–Ti ternary system.
II. CONSTRUCTION OF INTERATOMIC POTENTIAL
The interactions among Cu, Zr, and Ti atoms are described by the second-moment approximation of the tight-binding (TB-SMA) potential formulism.Reference Cleri and Rosato21 The total potential energy of the system is given by


where A, ξ, p, and q are the four adjustable parameters of the potential. The rij is the distance between the i and the j atoms, and the indices i (j) run over all the atoms. The first term in Eq. (1), namely ϕ(r ij), is a repulsive pairwise interaction of the Born–Mayer type and the second term in Eq. (1) is the n-body term contributed from the neighbor j atom to the i atom. The atomic interactions in Eqs. (2) and (3) are calculated up to a cutoff distance r cut. Accordingly, there are six sets of potential parameters to fit for the Cu–Zr–Ti ternary system, i.e., three potential parameters for pure Cu, Zr, and Ti, and three cross potential parameters for Cu–Zr, Cu–Ti, and Zr–Ti, respectively.
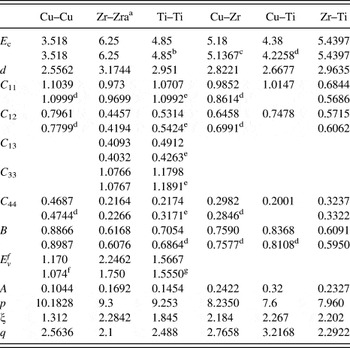
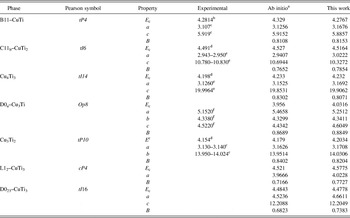
In the fitting procedures, the potential parameters for pure Cu and Ti are determined by fitting their cohesive energy, lattice constants, unrelaxed vacancy formation energy, and elastic constants, and r 0 is taken to be the nearest-neighbor distance of pure Cu and Ti. For the Zr element; we adopted the potential parameters with a short cutoff radius determined by Willaime and Massobrio.Reference Willaime and Massobrio22 For the cross potentials, the corresponding parameters fit the cohesive energy, lattice constants, elastic constants, and bulk modulus of the B2 CuZr, CuTi,Reference Ghosh23 and ZrTi phases at 0 K, and r 0 is taken to be the Cu–Zr, Cu–Ti, and Zr–Ti nearest-neighbor distance in the B2 phases. The cutoff radii r cut for atomistic interactions are also treated as adjustable parameters for an optimized fitting and are determined to be 0.495 nm with the exception of the Zr–Zr interaction being 0.53 nm. Table I lists the obtained potential parameters after optimization and a comparison between the physical quantities reproduced by the potential and those used initially for fitting. It can be seen that the reproduced cohesive energies, lattice constants, elastic constants, and bulk modulus of Cu, Zr, Ti, B2 CuZr, CuTi, and ZrTi are in good agreement with their experimental values or the first-principle calculation results. Furthermore, the validation of the potential for describing some binary and ternary intermetallics of the Cu–Zr–Ti system is also performed in a wide range of compositions, and the results, which are compatible with those from experimental values or the first-principle calculations, are given in the Appendix. Therefore, it is believed that the present potentials can well predict the properties of the ternary compounds and can be considered to be a one suitable for describing the interatomic interactions in the Cu–Zr–Ti system.
Values of cohesive energy E c, nearest-neighbor distance d, elastic constants Cij, bulk modulus B, and vacancy formation energy  , and potential parameters A, p, ξ, and q for Cu–Cu, Zr–Zr, Ti–Ti, Cu–Zr, Cu–Ti, and Zr–Ti.

Note
The properties in the upper rows are from the present potentials and those in the lower rows are from ab initial calculations or experimental results. E c, A, and ξ are expressed in eV/atom, d in Å, Cij, and B in eV/Å3 and E vf in eV.
b Ref. Reference Kittel24.
d Ref. Reference Ghosh23.
e Ref. Reference Simmons and Wang26.
g Ref. Reference Shestopal28.
III. SIMULATION METHODS TO DETERMINE GFR
The MD simulations are performed with the Parrinello–Rahman constant pressure algorithm,Reference Parrinello and Rahman29 at a pressure P = 0 bar, and the equations of motion are integrated using the fourth-order Gear prediction-corrector method with a time step of 5 × 10⁻¹⁵ s. The simulation models consist of 8 × 8 × 8 × 4 = 2048 atoms for the fcc Cu crystalline lattice and 10 × 6 × 6 × 4 = 1440 atoms for the hcp Zr and Ti crystalline lattices, respectively. In these models, the [100] and [001] crystalline directions are parallel to the x and z axes, and the crystalline direction along the y axis are [010] for the fcc Cu and [120] for the hcp Zr and Ti. Periodic boundary conditions are adopted in all three dimensions. The solid solutions are constructed by randomly substituting a certain number of solvent atoms by solute atoms. To avoid forming a cluster of solute atoms, the random substitution is performed in each unit cell of fcc Cu (hcp Zr and Ti) lattice with the same probability, and the initial fcc Cu-rich (hcp Ti- and Zr-rich) solid solution is thus obtained. MD simulations are performed for the solid solutions with various solute concentrations to find the critical compositions, at which crystalline lattices of the solid solutions become unstable and collapse into amorphous states. For the as-set solid solution, the simulation is then run at 300 K for at least 20,000 MD time steps to a relatively equilibrium state, at which all the related dynamic variables show no secular variation. The temperature of the simulated system is maintained by a time-to-time rescaling of the velocities of the atoms to the assigned temperature at every 100 time steps, if an average deviation from the assigned temperature is over 1 K.
The process of structural change in the aforementioned Cu–Zr–Ti models is monitored by the projection of atomic positions and the pair-correlation function g(r). Furthermore, the elastic constants of amorphous phases or solid solutions are calculated to identify the crystalline-to-amorphous (C-A) transition, as an abrupt change of the elastic constants occurs at the C-A transition. Cheng et al.Reference Cheng and Ma30 proposed the method to calculate the elastic constants using many-body potentials. The elastic constants were decomposed into three parts related to fluctuation of stress tensor, kinetic energy, and Born term, respectively. As the Born term is related to structure, it changed abruptly during a structural transition. Therefore, in this study we only calculated Born term to identify any possible transition, such as the C-A transition, and it is calculated by the method presented in Ref. 31. Furthermore, the common-neighbor analysisReference Faken and Jónsson32 (CNA) method is also applied to characterize the vitrification process from crystalline to glass state. CNA is a method for analyzing a structure by decomposition of the radial distribution function according to the local environment of the pairs of atoms. In the analysis, two atoms are said to be neighbors and to form a “bonded” pair if they are within a specified cutoff distance of each other. In our calculations, the cutoff distance is taken to be r c, where the r c is the first minimum position of g(r) between the first and second peaks. If the distance between two atoms is less than r c, they are considered to be a “bonded” pair. The pairs are classified by a set of three indices, jkl, which are calculated in the usual way.Reference Faken and Jónsson32 The first index, j, is the number of neighbors common to both atoms; the second index, k, is the number of bonds between these common neighbors; the third index, l, is the number of bonds in the longest continuous chain formed by the k bonds.
IV. RESULTS AND DISCUSSION
A. Determination of the GFR of the Cu–Zr–Ti system
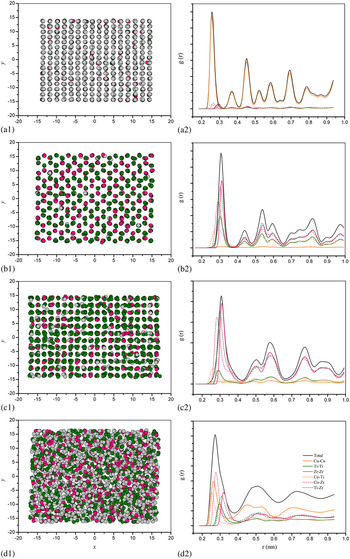
On the basis of Liu’s solid-solution method, to predict the GFR of a binary system is just to determine two critical compositions, beyond which the C-A transitions take place spontaneously. From this viewpoint, the GFR of a ternary system can be predicted by adopting Liu’s method to find the critical composition, beyond which the solid solution collapses to form the amorphous phase. Accordingly, we built up Cu (Zr or Ti)-based solid solutions by the method described in Sec. III and used MD simulations to study their structural stability by changing the solute concentrations. The solute concentrations were changed by the following way. For the Cux(ZryTi)(100–x)/(1+y) alloy, we took a ratio between Zr and Ti atoms, namely n Zr/n Ti as y, and obtained a series of the solid solutions with different compositions by varying values of x and y. A series of values of y, i.e., 7, 5, 4, 3, 2, 3/2, 1, 2/3, 1/2, 1/3, 1/4, 1/5, and 1/7, were selected in our simulations. For example, Cu70Zr20Ti10 (or Cu40Zr40Ti20) is obtained by giving x = 70 (or 40) and maintaining y = 2. Starting from these solid solutions, MD simulations were performed at 300 K for at least 20,000 MD steps to test the stability of the solid solutions and to find the critical compositional points at which the C-A transitions took place. The typical states of the Cux(ZryTi)(100–x)/(1+y) alloys with different compositions are shown in Fig. 1 by the projections of atomic positions on the x-y plane and the corresponding total and partial pair-correlation function g(r). It is seen that four states, i.e., fcc and hcp solid solutions, face-centered orthorhombic (fco) phase, and amorphous phase are obtained in the MD simulations. For the Cu90Zr5Ti5 (or Cu4Zr60Ti36) solid solution the crystalline fcc (or hcp) structure is still kept because the g(r) curves possess the crystalline characteristic peaks of an fcc (or hcp) lattice. It is interesting to see from Fig. 1 that for the Zr-rich Cu10Zr72Ti18 alloy the initial hcp solid solution is unstable and transforms into an fco structure for g(r) shape and peak position which are different from those observed in Fig. 1(b2) for the Zr-rich hcp solid solution. An hcp-to-fco martensitic phase transformation has also been observed in some binary systems with an fcc-hcp combination, such as Ni–Ti and Ni–Hf.Reference Li, Dai, Liang, Tai, Kong and Liu33 The mechanism responsible for the hcp-to-fco martensitic phase transformation and its crystallographic correlation observed in the present Cu–Ti binary system was discussed and reported elsewhere.Reference Qin and Lai34 Again, looking at Fig. 1, it is noticed that for the Cu50Zr30Ti20 alloy the lattice of the initial fcc solid solution collapses to form a completely disordered state, which is characterized by the disappearance of the crystalline g(r) peaks at a long distance.
The projections of the atomic positions on the x-y plane and the total and partial pair-correlation function g(r)s for the Cu–Zr–Ti ternary alloys with different compositions. (a1, a2) the fcc Cu-based solid solution of Cu90Zr5Ti5, (b1, b2) the hcp Zr-based solid solution of Cu4Zr60Ti36, (c1, c2) the face-centered orthorhombic phase of Cu10Zr70Ti20, and (d1, d2) the amorphous state of Cu50Zr30Ti20. The light grey, green, and pink circles stand for Cu, Zr, and Ti atoms, respectively. (color online)

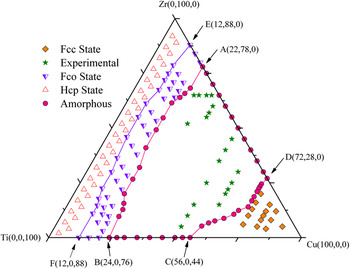
According to the simulation results, we classified the Cux(ZryTi)(100–x)/(1+y) alloys into four type structure states and therefore constructed the C-A transition phase diagram of the Cu–Zr–Ti ternary system in Fig. 2. From Fig. 2, it can be seen that the whole composition triangle is divided into four composition regions by three critical solubility lines, and that from left to right they are corresponding to the hcp solid solution, fco phase, amorphous phase, and fcc solid solution, respectively. Line EF is the hcp-to-fco transition boundary, beyond which the Zr- or Ti-rich solid solutions cannot retain their initial hcp crystalline structure and transform into the fco structure. The region in the Cu-rich side is an fcc solid solution zone. Two red lines AB and CD are the C-A transition boundaries, beyond which the solid solutions are unstable and collapse to form amorphous phases. Therefore, the central region, enclosed by distorted quadrilateral ABCD in Fig. 2, is an amorphous forming region, where the amorphous phase is favored as compared with its solid solution counterpart.
A crystalline to amorphous transition phase diagram of the Cu–Zr–Ti ternary system obtained by MD simulations at 300 K.

The compositions of the four vertexes of the distorted quadrilateral are determined to be Cu22Zr78Ti0, Cu24Zr0Ti76, Cu56Zr0Ti44, and Cu72Zr28Ti0, respectively. It is significant to compare the present simulation results with experimental ones to verify the accuracy of the predicted GFR in the Cu–Zr–Ti ternary system. Concustell et al.Reference Concustell, Zielinska, Révész, Varga, Suriñach and Baró35 have analyzed the thermal characterization of Cu60ZrxTi40–x (x = 15, 20, 22, 25, and 30) metallic glasses, and Cu60ZrxTi40–x ribbons were obtained using a single roller melt-spinning technique in inert atmosphere. Men et al.Reference Men, Pang and Zhang36 obtained the Cu50Zr50–xTix metallic glasses and have studied their GFA and mechanical properties. Chou et al.Reference Chou, Huang, Chang and Nieh37 have studied the structure relaxation and nanoindentation response in Zr–Cu–Ti amorphous thin films. The Zr52Cu29Ti19 thin films were codeposited on silicon substrates using the magnetron cosputtering technique. Furthermore, Zr65Cu35–xTix and Zr65–xCu35Tix ingots of approximately 1 g mass were prepared by arc-melting on a water-cooled copper hearth in a high purity Ar atmosphere.Reference Shen, Xing and Kelton38These amorphous compositions obtained by experimental techniques are denoted by pentalpha and depicted in Fig. 2. It is clearly seen that all experimental results fall into the determined GFR, indicating that the solid-solution models with the present ternary metal potential are competent for evaluating the GFR in the Cu–Zr–Ti ternary system.
It is of interest to discuss whether short time MD simulations (20,000 MD steps) would affect the overall GFR or not. To model a long MD run, we adopted another approach to perform MD simulations. We start to randomly substitute solvent atoms for a given concentration and carry out phonon equilibration for 1 ns. After this, we restart to randomly substitute solvent atoms from the previous simulated atomic configuration, rather than from initial desired composition, with another MD simulation for 1 ns. This approach is then repeated until the system becomes amorphous. We have checked several alloy compositions, and found that the so-determined C-A transition compositions are almost the same as those determined from initial solid solution obtained by randomly substituting solvent atoms with solute atoms at the desired composition. This suggests that the MD simulation time seems hardly to affect overall GFR, as long as simulation reaches a relatively equilibrium state with the dynamic variables showing no secular variation. This might ascribe to the fact that GFR is determined by relative stability of solid solutions and amorphous phases, which is governed by interatomic potentials.
B. Effect of alloy components on the GFA
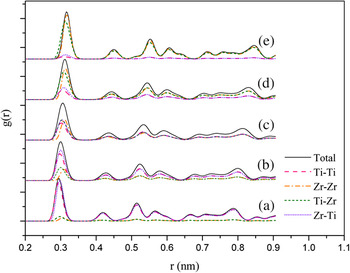
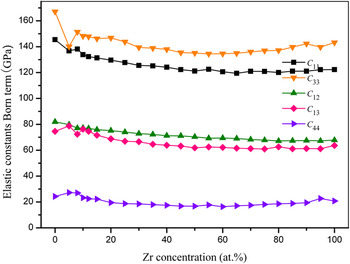
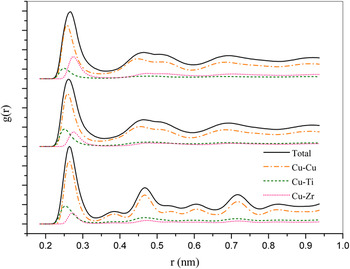
In the Cu–Zr–Ti ternary system, Cu possesses an fcc structure while Zr and Ti both have the same hcp structure. The atomic radii of Cu, Zr, and Ti are 1.27, 1.58, and 1.47 Å,Reference Egami and Waseda39 therefore the atomic size ratio is 1.244 for Zr/Cu, 1.07 for Zr/Ti, and 1.157 for Ti/Cu, respectively. Because Zr and Ti possess the same structure with a small atomic size ratio, they will form an extensive substitutional solid solution according to Hume–Rothery’s rule. Indeed, a continuously substitutional solid solution is observed in the whole composition region from the Zr–Ti binary phase diagram. The present potential reproduces this fact that the Zr–Ti solid solutions retain hcp crystalline structure in the whole composition region. Figure 3 shows the total and partial pair-correlation function calculated for the ZrxTi100–x alloys consisting of Zr atoms up to 10, 30, 50, 70, and 90 at.%, respectively. From the figure, it is seen that all solid solutions still retain the initial hcp crystalline structure, indicating the formation of the continuously substitutional solid solution in the Zr–Ti binary system. To obtain firm evidence for the formation of the continuously substitutional solid solution, the structure-related elastic constants of the system, namely Born terms, were calculated as a function of alloy composition and are shown in Fig. 4. According to the structure symmetry, hcp structure has five independent elastic constants, C 11, C 12, C 13, C 33, and C 44, respectively. From Fig. 4, one sees that all the elastic constants change smoothly with the variation of the Zr concentrations, especially in the Zr-rich side, which suggests that all the solid solutions calculated in Fig. 4 still retain the initial hcp crystalline structure. On the basis of the results shown in Figs. 3 and 4, it is concluded that the Zr–Ti binary system is a non-glass-forming system because of the formation of continuous solid solutions hindering the glass formation.
Total and partial pair-correlation functions for the ZrxTi100–x solid solutions obtained by MD simulations at 300 K for at least 20,000 MD steps. The compositions are at (a) 10 at.%, (b) 30 at.%, (c) 50 at.%, (d) 70 at.%, and (e) 90 at.%, respectively. The full curve is for the total g(r); the dashed curve is for Ti–Ti g(r); the dot-dashed curve is for Zr–Zr g(r); the short dashed curve is for Ti–Zr g(r); the dotted curve is for Zr–Ti g(r).

Variation of the calculated Born term of elastic constants with the change of Zr concentrations for the Zr–Ti binary alloys.

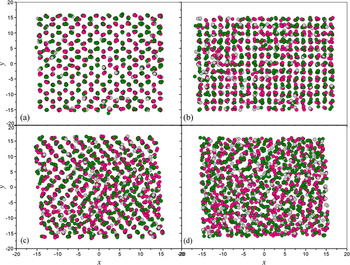
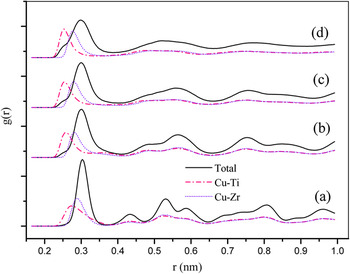
The effect of Cu addition on the GFA of the Zr–Ti binary alloy is inspected. As mentioned previously, the Zr and Ti are completely miscible and form hcp continuous solid solution in their entire compositional range, indicating that the amorphous phase is hard to obtain in the Zr–Ti system. However, it can be seen from Fig. 2 that addition of Cu into the Zr–Ti alloy will change them into the glass-forming system. Here, Cu is added into Zr50Ti50 alloy to observe the structural evolution with the increment of Cu concentration. Figure 5 displays four projections of the atomic positions after MD simulations for four composition points. From the figure, it can be seen that the Cu6Zr47Ti47 alloy apparently kept the initial hcp crystalline structure. With increasing the Cu concentration up to 10 at.%, the aforementioned hcp-to-fco phase transition takes place. Further increasing the Cu content, the disturbance of the atoms in the CuxZr50–x/2Ti50–x/2 alloys is visible, which is corresponding to a disordering process, and finally the solid solution collapses to the amorphous phase as shown in Fig. 5(d). It is observed that, when the concentration of the solute Cu is up to 14 at.% for the CuxZr50–x/2Ti50–x/2 alloys, the initial hcp and the following fco crystalline structures are not stable and the amorphous phase is favorably formed. Furthermore, Fig. 6 displays the total and partial pair-correlation function calculated for the CuxZr50–x/2Ti50–x/2 alloys consisting of Cu atoms up to 6, 10, 12, and 18 at.%, respectively. From the figure, one sees that the main characteristics of Figs. 6(a) and 6(b) are identical to those of g(r)s for Cu4Zr60Ti36 and Cu10Zr70Ti20 displayed in Fig. 1, which correspond to the hcp and fco crystalline structure. With increasing the Cu concentration, the crystalline g(r) peaks are gradually disappearing at a longer distance, indicating that the disordering process happens.
Projections of the atomic positions on the x-y plane of CuxZr50–x/2Ti50–x/2 alloys at various compositions. (a) Cu6Zr47Ti47, (b) Cu10Zr45Ti45, (c) Cu12Zr44Ti44, and (d) Cu18Zr41Ti41. The light grey, green, and pink circles stand for Cu, Zr, and Ti atoms, respectively.

Total and partial pair-correlation functions for the CuxZr50–x/2Ti50–x/2 alloys obtained by MD simulations at 300 K for at least 20,000 MD steps. The compositions are at (a) 6 at.%, (b) 10 at.%, (c) 12 at.%, and (d) 18 at.% of Cu, respectively. The full curve is for the total g(r); the dot-dashed curve is for Cu–Ti g(r); the dotted curve is for Cu–Zr g(r).

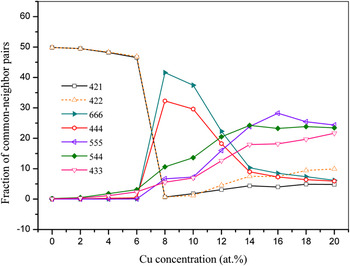
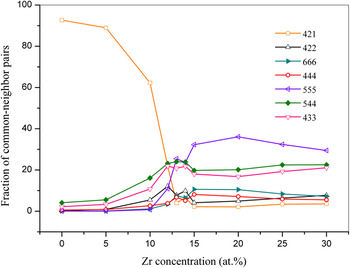
Next, we turn to the CNA method to inspect the atomic local configurations evolution of the CuxZr50–x/2Ti50–x/2 alloys with increasing Cu content. Figure 7 gives the variation in the CNA pairs after MD simulations with increased Cu concentration. It is noticed that, when the Cu content is lower than 6 at.%, the solid solutions retain the hcp structure because of the CNA results having almost 50% of both indices 421 and 422 (representing the close-packing structure, i.e., fcc structure with only 421, while hcp structure with half 421 and half 422). With further increasing the Cu concentration up to 8 at.%, it can be seen that the fraction of indices 421 and 422 decrease sharply and that the fraction of indices 666 and 444 (mostly found in the crystalline bcc structure) increase markedly, which indicate the hcp-to-fco transition because of the fco structure possessing a bcc-like structure.Reference Qin and Lai34 However, when the Cu content of the CuxZr50–x/2Ti50–x/2 alloys is greater than 10 at.%, one sees that the fraction of indices 421 and 422 decrease drastically, and the fraction of indices 555, 544, and 433 (representing an icosahedron or distorted icosahedron often found in the undercooled liquids or glasses) gradually increase. This process correlates with the disordering and the formation of the amorphous phase. At the same time, the fraction of indices 421 and 422 just increase slightly. The CNA results are in accordance with the projection of the atomic positions and pair-correlation studies. On the basis of the previous results, it can be concluded that the addition of Cu content can evidently improve the GFA of the Zr–Ti alloy. Because Cu has a different structure and a small atomic radius, compared with Zr and Ti, addition of Cu to the Zr–Ti solid solutions will introduce a strain into an hcp lattice, but the hcp structure can still be retained through lattice adjustment to release the strain. Further increasing the Cu concentration will trigger the hcp-to-fco phase transformation, because the hcp solid solutions can no longer release the large strain by lattice adjustment. Increasing the Cu concentration up to line EF in Fig. 2, the strain induced by Cu is large enough to be accommodated by the fco structure, and thus the fco to amorphous transition takes place.
Evolution of the common-neighbor pairs as a function of Cu concentration for the CuxZr50–x/2Ti50–x/2 alloys.

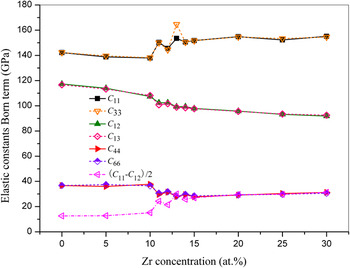
It is seen from Fig. 2 that in the Cu-rich region the maximum solid solubility of Zr in the Cu-rich solid solutions is lower than that of Ti (compare 28 at.% Zr with 44 at.% Ti), indicating that the Zr is more advantageous than Ti to form amorphous alloy in the ternary Cu–Zr–Ti system. Here, the effect of Zr addition on the GFA of the Cu70ZrxTi30–x alloys is examined. Figure 8 shows the total and partial pair-correlation function g(r) calculated for the Cu-rich fcc Cu70ZrxTi30–x alloy consisting of Zr solute atoms up to 10, 13, and 20 at.%, respectively. From the figure, it can be seen that the solid solutions with 10 at.% of Zr atoms still retain an fcc crystalline structure. However, for the solid solutions with Zr concentration up to 13 at.%, a C-A transition obviously takes place, as evidenced by the shape of the g(r) curves in Figs. 8(b) and 8(c) commonly observed for the amorphous alloys. To obtain a firm evidence for the C-A transition as increasing Zr content in the Cu70ZrxTi30–x alloy, the Born term of elastic constants were calculated as a function of Zr composition and are shown in Fig. 9. According to the structure symmetry, fcc structure has three independent elastic constants, C 11 = C 33, C 12 = C 13 and C 44, respectively, while isotropy materials, such as the polycrystalline and amorphous materials, have two independent elastic constants C 11 and C 12, for C 44 is equal to (C 11–C 12)/2. From the figure, one sees that when the concentration of solute Zr is lower than 11 at.%, all the elastic constants change smoothly with increasing Zr contents and at the same time the relationship of C 11 = C 33, C 12 = C 13, and C 44 = C 66 remains, suggesting that the solid solutions retain an fcc lattice structure. At x Zr = 11 and 12 at.%, the C 11 and C 33 sharply increase, while C 12, C 13, C 44, and C 66 abruptly decrease, indicating that a disordering process is taking place. It is noticed from Fig. 8 that when solute Zr concentration is greater than 13 at.%, the elastic constants indeed satisfy the relationship of C 11 = C 33, C 12 = C 13, and C 44 = (C 11–C 12)/2, indicating the formation of the amorphous phase. Furthermore, the CNA approach was applied to inspect the atomic local configurations evolution of the Cu70ZrxTi30-x alloys with gradually increasing Zr content.
Total and partial pair-correlation functions for the Cu70ZrxTi30–x alloys obtained by MD simulations at 300 K for at least 20,000 MD steps. The compositions are at (a) 10 at.%, (b) 13 at.%, and (c) 18 at.% of Cu, respectively. The full curve is for the total g(r); the dot-dashed curve is for Cu–Cu g(r); the dashed curve is for Cu–Zr g(r); the dotted curve is for Cu–Zr g(r).

Variation of the calculated Born term of elastic constants with the change of Zr concentrations for the Cu70ZrxTi30–x alloys.

Figure 10 gives the variation in the CNA pairs after MD simulations with increasing Zr concentration. It is noticed that by increasing the Zr concentration up to 13 at.% the fraction of indices 421 decreases sharply and that the fraction of indices 555, 544, and 433 increase markedly, indicating that vitrification occurs. At the same time, the fractions of indices 666 and 444 just increase slightly. The CNA results are in accordance with the elastic constants analysis. Comparing Fig. 9 with Fig. 10, it is obvious that the abrupt change of the elastic constants corresponds with the sharp decrease of 421 pair and the drastic increment of 555, 544, and 433 pairs. The aforementioned results suggest that the addition of Zr can effectively improve the GFA of Cu–Ti alloy in the Cu-rich composition region. This arises because the Zr atoms of large size introduce larger strain in the Cu-rich solid solutions than Ti atoms of relatively small size. Thus, the GFA in the Cu-rich composition region is more enhanced by adding a Zr element as compared with adding a Ti element.
Evolution of the common-neighbor pairs as a function of Zr concentration for the Cu70ZrxTi30–x alloys.

It is of interest to compare the present glass-forming predictive model with other empirical models. EgamiReference Egami4 proposed an empirical rule for finding the glass-forming systems. This suggested that the formation of metallic glass is more favored by increasing the atomic size ratio of the constituent elements, the number of elements involved, and the interaction between the small and large atoms as well as by introducing repulsive interactions between small atoms into a system. The currently studied Cu–Zr–Ti ternary system is the one that agreed with Egam’s rule, because the atomic radius of Cu is smaller than that of Zr and Ti, while the interaction between the small and large atoms is strong, as indicated by the heat of formation being 24.4 KJ/mol for the Cu–Zr pair,Reference Ansara, Pasturel and Buschow25 and 11.12 KJ/mol for the Cu–Ti pairReference Cleri and Rosato21 and 0 KJ/mol for the Zr–Ti pair. The MD results from Fig. 2 show that when the composition of Cu atoms in the Cu-rich region are fixed, e.g., Cu70ZrxTi30–x alloys (Figs. 8, 9, and 10), increasing the Zr concentration results in the increase of both the size difference among constituent atoms and the interaction between constituent atoms, which facilitates the formation of amorphous alloy in the Cu–Zr–Ti system. Similarly, for CuxZr50–x/2Ti50–x/2 alloys (Figs. 5, 6, and 7), the addition of small size Cu atoms will induce the large size difference and strong interactions in the Cu–Zr–Ti system, and obviously improves the GFA of the binary Zr–Ti alloys. Thus, it can be seen that the present prediction through MD simulations matches well with Egam’s empirical rule. Moreover, based on IBM experiments, Liu et al.Reference Liu, Johnson, Nicolet and Lau40 proposed a structure difference rule, suggesting that an amorphous alloy was more easily formed in a binary system with the two constituent metals having different crystalline structure. Looking back to Fig. 2, the present MD results predict that the Zr–Ti binary system is a non-glass-forming system (Figs. 3 and 4), because, on the one hand, both Zr and Ti have the same hcp crystalline structure; on the other hand, there is little size difference between Zr and Ti (only 7.48%, far apart from the critical value 15% for the formation of continuous solid solution), as well as a nil heat of formation. As a result, the formation of hcp continuous solid solution in the whole composition region hinders the metallic glass formation in the Zr–Ti binary system. Qi et al.Reference Qi, Çagin, Kimura and Goddard41 have studied the glass formation and crystallization by MD simulation in binary liquid metals Cu–Ag and Cu–Ni. Simulation results showed that it is hard to obtain the amorphous phase in the binary Cu–Ni system, for both elements Cu and Ni have the same fcc crystalline structure and the size difference is small. Thus, according to Liu’s structure difference rule, the way to change the GFA of the Zr–Ti system is to add another element, such as Cu, with different structure. Indeed, the present results from Fig. 2 show that in the Zr–Ti-rich region increasing the composition of Cu (e.g., CuxZr50–x/2Ti50–x/2 alloys), i.e., the increase of the difference in structure and the number of hcp-fcc pairs of Zr–Cu and Ti–Cu, is helpful for metallic glass formation in the Cu–Zr–Ti ternary system. Therefore, our present prediction also agrees with Liu’s structure difference empirical rule. It should be pointed out that although Egam’s and Liu’s empirical rules can be qualitatively used to guide experiments for finding glass-forming systems, they cannot provide a quantitative guidance in producing metallic glasses. Nevertheless, the present solid-solution model through MD simulations can provide a quantitative guidance because it can predict the GFR in the ternary systems.
V. CONCLUSIONS
We have derived an n-body Cu–Zr–Ti potential, which is capable of reproducing some physical properties of some Cu–Zr, Cu–Ti, Zr–Ti, and Cu–Zr–Ti alloy phases. Employing the potential, MD simulations were performed to construct the C-A transition phase diagram of this ternary system, and the GFR of the system was determined to be within an approximate distorted quadrilateral region. The present results are in accordance with Egami’s and Liu’s empirical rules for predicting GFA. In addition, the determined GFR from the C-A transition phase diagram are in good agreement with the experimental observations.
ACKNOWLEDGMENTS
This work is supported by the National Natural Science Foundation (Grant No. 50871057) and National Hi-tech (R&D) Project of China (Grant No. 2009AA034001). We thank Mr. Ning Gao for providing us with the common neighbor analysis code.
APPENDIX
Validation of the Cu–Zr–Ti ternary TB-SAM potentials
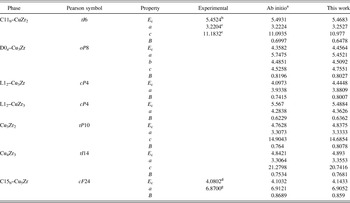
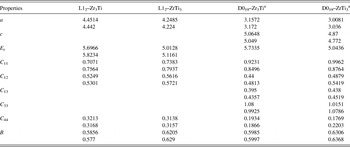
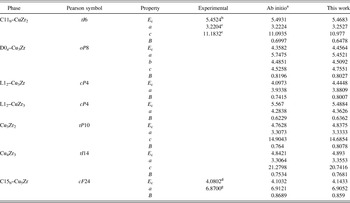
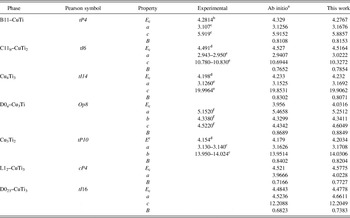
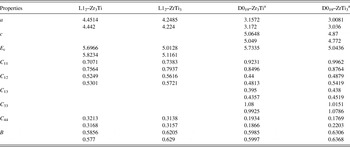
To test and validate the reliability of the fitted Cu–Zr–Ti potential capable of describing alloy’s properties in a wide range of compositions, the cohesive energies, lattice constants, elastic constants, and the bulk modulus of some stable, metastable and virtual crystalline phases in three binary systems (i.e., the Cu–Zr, Cu–Ti, and Zr–Ti systems) are reproduced by the constructed potentials (shown in Table I) and are listed in Table AI Table AII, and Table AIII, respectively, together with a comparison between the reproduced results and those from either the first-principle calculations or experimental investigations. It is seen that the properties of the phases reproduced by the potentials are compatible with those obtained from the first-principle calculations or from experiments. Moreover, to further verify the reliability of the constructed potentials in the ternary system, the properties of some ternary compounds are also reproduced and compared with the first-principle calculations. The lattice constants, cohesive energy, and the bulk modulus of D03 CuZr2Ti, D03 ZrCu2Ti, D03 CuTi2Zr, C1 CuZrTi, C1 ZrCuTi, and C1 CuTiZr derived by the potential and the first-principle calculations are presented in Table AIV. It can be seen that the reproduced results are compatible with those from the first-principle calculations for the six ternary compounds. Because the tested phases span a large number of compositions, it is believed that the present potentials can well predict the properties of the ternary compounds and can be considered to be one suitable for describing the interatomic interactions in the Cu–Zr–Ti system.
A comparison of the physical properties derived from the constructed potential with those from ab initio calculations and experiments for some Cu–Zr stable, metastable, and virtue crystalline alloy phases.
Note
The cohesive energy E c is expressed in eV/atom, lattice constants a, b, c in Å, and bulk modulus B in eV/Å3.
a Ref. Reference Ghosh23.
b Ref. Reference Kleppa and Watanabe42.
c Ref. Reference Nevitt and Downey43.
A comparison of the physical properties derived from the constructed potential with those from ab initio calculations and experiments for some Cu–Ti stable, metastable, and virtue crystalline alloy phases.
Note
The cohesive energy E c is expressed in eV/atom, lattice constants a, b, c in Å, and bulk modulus B in eV/Å3.
a Ref. Reference Ghosh23.
b Ref. Reference Kleppa and Watanabe42.
A comparison of some properties derived from the constructed potential with those from the first-principle calculations for the L12–Zr3Ti, L12–ZrTi3 and D019–Zr3Ti, D019–ZrTi3 compounds.
Note
The properties in the upper rows are from the present potentials and those in the lower rows are from the first-principle calculations. Lattice constants a and c in Å, the cohesive energy E c in eV, the elastic constants Cij and bulk modulus B in eV/Å3.
A comparison of some properties derived from the constructed potential with those from the first-principle calculations for the ternary D03 CuZr2Ti, ZrCu2Ti, and CuTi2Zr as well as C1 CuZrTi, ZrCuTi, and CuTiZr compounds.

Note
The properties in the upper rows are from the present potentials and those in the lower rows are from the first-principle calculations. Lattice constant a in Å, the cohesive energy E c in eV, and the bulk modulus B in eV/Å−3.