




No CrossRef data available.
Article contents
Natural variation in the response of Caenorhabditis elegans towards Bacillus thuringiensis
Published online by Cambridge University Press: 16 April 2004
Abstract
Almost nothing is known about the natural ecology of the nematode Caenorhabditis elegans, including its interactions with parasites. To help rectify this discrepancy, we assessed natural variation in the response of C. elegans towards a potential parasite, the soil bacterium Bacillus thuringiensis. Our results show that 10 isolates from across the world differ significantly in survival rate and infection level when confronted with a parasitic strain of B. thuringiensis. Furthermore, behavioural responses are identified as an important component of C. elegans defence, including evasion and possibly reduced ingestion of parasites. Again, the natural isolates show significant differences in these traits. In conclusion, worm defence is indicated to be complex and variable across space, implying that parasites play an important role in the ecology of this species. Based on these results, we expect C. elegans to be a promising model host for future analysis of the evolutionary dynamics of parasite–host interactions.
Keywords
Information
- Type
- Research Article
- Information
- Copyright
- © 2004 Cambridge University Press
INTRODUCTION
The nematode Caenorhabditis elegans is one of the main model species in biological research. It gained particular importance in neurobiology, developmental biology, and studies of ageing (Wood, 1988; Riddle et al. 1997; Patridge & Gems, 2002). Recently, different research groups also began to address the relationship of C. elegans with pathogens, including a bacterium isolated from a laboratory culture of C. elegans (Microbacterium nematophilum), various human pathogens (e.g., Pseudomonas aeruginosa, Serratia marcescens, Salmonella enterica serovar Typhimurium, Burkholderia pseudomallei), and other commercially important microorganisms (e.g., Bacillus thuringiensis). These studies are particularly concerned with the molecular genetic basis of host defence vs. pathogen virulence. They already provided new insights into C. elegans defence, for which a physical barrier (e.g., the cuticle or the pharynx grinder), molecular compatibility between pathogens and hosts, and an induced humoral immune response seem to be important (Ewbank, 2002; Kurz & Ewbank, 2003).
Caenorhabditis elegans should also prove useful as a model host for an evolutionary analysis of parasite–host interactions. The factors, which are likely to play a role in parasite–host dynamics, have been well characterized using theoretical approaches. For instance, the reproductive system of the host was shown to be important for the ability of the host to respond to co-evolving parasites (Hamilton, Axelrod & Tanese, 1990; Agrawal & Lively, 2001), or parasite transmission patterns are one of the key determinants of parasite virulence (Frank, 1996). However, experimental analyses of such hypotheses are scarce, mainly due to the paucity of suitable model systems. In this context, C. elegans bears many advantages. In particular, it can be easily manipulated under laboratory conditions, it facilitates set-up of experimental evolution studies because of its short generation time (approximately 3 days), and it is transparent such that phenotypes can be easily scored using simple microscopy (e.g. Hope, 1999). Moreover, it also permits efficient molecular genetic analysis of observed phenotypic traits due to the availability of the complete genome sequence and a huge array of molecular techniques (e.g. Hope, 1999). This should enhance understanding of the link between phenotypic and molecular evolutionary change.
The suitability of C. elegans as a model host for comprehensive evolutionary studies depends on the presence of genetic variation in its response towards parasites. We therefore decided to compare host defences among different natural isolates. To date, approximately 30 strains have been isolated from soil samples world-wide. These isolates show variation in life-history traits, including reproductive rate, longevity, the formation of copulatory plugs, social behaviour, or chemosensation (Hodgkin & Doniach, 1997; de Bono & Bargmann, 1998; Jovelin, Ajie & Phillips, 2003). To date, variation in host defence has not been examined.
For our study, we chose the Gram-positive bacterium Bacillus thuringiensis as a counterpart. Natural parasites are as yet unknown from C. elegans. However, B. thuringiensis is currently one of the most convincing candidates. It is a common soil inhabitant (e.g. Borgonie et al. 1995, 1996) and thus likely to co-exist with C. elegans in nature. Most importantly, some strains produce toxins with high specificity towards soil nematodes, including C. elegans (Borgonie et al. 1996; Wei et al. 2003), and these are also able to generate a persistent infection in C. elegans under laboratory conditions (Borgonie et al. 1995, 1996). The latter two suggest that some B. thuringiensis strains evolved specific adaptations towards soil nematodes, most likely including C. elegans. Successful infection comprises the following steps. Bacterial spores enter the host via the mouth and pass into the gut, where they destroy intestinal cells with the help of a specific toxin (Bt toxin). Spores subsequently germinate, followed by multiplication of the bacterium in host tissue. Infection usually leads to nematode death (Borgonie et al. 1995, 1996). Susceptibility of C. elegans seems to be mediated by different factors, one of them a transmembrane protein on the gut surface, which serves as a receptor for the Bt toxin (Marroquin et al. 2000; Griffiths et al. 2001). Here, we show that different natural C. elegans strains indeed vary in their response towards B. thuringiensis.
MATERIALS AND METHODS
Nematode and bacterial strains
Ten different natural world-wide isolates of C. elegans were obtained from the Caenorhabditis Genetics Center (CGC; Minnesota, USA): N2 (Bristol, UK), CB4851 (Bergerac, France), KR314 (Vancouver, Canada), CB4555 and CB4858 (both Pasadena, USA), CB3191 (Altadena, USA), DH424 (El Prieto, USA), CB4856 (Hawaii, USA), AB1 and AB2 (both Adelaide, Australia) (Hodgkin & Doniach, 1997). After strains arrived from the CGC, they were grown on large nematode growth medium- (NGM-) plates with the standard food organism, E. coli OP50, then frozen in aliquots with 15% glycerol, and stored at −80 °C (Stiernagle, 1999). About 7 days before each individual test, worms were thawed and grown for at least 2 generations. Hence, worms should no longer be affected by the consequences of freezing. Moreover, specimens used in different tests should all derive from more or less the same generation (±3). For all experiments, hermaphroditic fourth instar larvae or young adults were used.
Two different strains of B. thuringiensis were used in the experiments. NRRL B-18247, a strain with high nematicidal activity (Leyns et al. 1995), provided by the Agricultural Research Service Patent Culture Collection (United States Department of Agriculture, Peoria, Illinois, USA), and the non-pathogenic DSM-350, obtained from the German Collection of Microorganisms and Cell Cultures (Deutsche Sammlung von Mikroorganismen und Zellkulturen GmbH, DSMZ, Braunschweig, Germany). Spores and vegetative cells of B. thuringiensis strains were harvested as described previously (Borgonie et al. 1996). Briefly, they were grown in 400 ml of culturing bacillus isolates- (CBI-) medium at 30 °C for 7 days. Bacteria were concentrated in 50 ml Falcon tubes via centrifugation and subsequently resuspended in phosphate-buffered saline (PBS). Concentration of bacterial particles (including both vegetative cells and spores) was determined microscopically using counting chambers. The concentration was adjusted to approximately 2×10⁹ particles/ml by adding appropriate volumes of PBS. The B. thuringiensis-concentrate was aliquotted (500 μl volumes) and stored at −20 °C until further usage. Toxicity is not affected by single freezing (Leyns et al. 1995). Aliquots were thawed directly before each individual experiment. Bacterial suspensions of identical quality and origin could thus be used throughout the whole investigation.
Survival assay
The survival assay served to evaluate whether the C. elegans strains differ in their ability to cope with parasitic B. thuringiensis. For this, worms were assayed in 2 different liquid media: S-medium and PBS (Stiernagle, 1999), in which worms and bacteria can or cannot grow, respectively. Parasitic B. thuringiensis were added to a final concentration of about 1×10⁸ particles/ml. This concentration was found to be suitable for the study of variation among nematode strains in a pilot study. In the control, the pathogenic B. thuringiensis strain was replaced by the non-pathogenic strain (final concentration: 1×10⁸ particles/ml). With the exception of tests in low-nutrition PBS medium, fresh cultures of E. coli OP50 were added to the culture medium, in order to ascertain that worms have sufficient food (final concentration: 1×10¹⁰ cells/ml). The test media were distributed in 100 μl volumes to the wells of a 96-well culture plate (1 medium per plate). Animals were tested individually to exclude density effects on survival rates. Worms were transferred from NGM-plates to the test medium with the help of a worm picker. Transfer of worms to a particular plate was completed within less than 20 min. The different strains were always assessed in parallel and position of strains across culture plates was randomized. The tests were performed in the dark at either 20 °C (S-medium and PBS) or 25 °C (S-medium only). Survival rate was recorded after 24 h. Worms were scored as being dead if they did not respond to light touch.
Infection process
We assessed differences among nematode strains in the extent of infection. Worms were confronted with the pathogenic strain NRRL B-18247 in 100 μl of PBS at 20 °C, as above. Three different treatments were employed. Worms were confronted with pathogens for 4 h. Thereafter, half of them were directly studied microscopically (4 h treatment). The other half was transferred to 100 μl of PBS (without pathogens) for another 20 h before being analysed (4+20 h treatment). Note that B. thuringiensis does not grow in PBS. The third treatment consisted of continuous contact with pathogens for 24 h (24 h treatment). Before microscopy and before transfer to PBS, worms were pipetted onto large MM agar plates and subsequently picked with the help of a worm picker to reduce co-transfer of bacteria. At the end of each experiment (prior to microscopy), worm survival was recorded as above. For microscopy, the animals were transferred individually into a drop (~0·2 μl) of 4′,6-diamidino-2-phenyl-indol-dihydrochloride (DAPI; 5 mg/ml) in Vectashield-mounting medium (Molecular Probes Europe BV, Leiden, The Netherlands). Samples were immediately frozen to stop pathogens from replicating. After thawing, they were analysed with the help of differential interference contrast (DIC) and fluorescence microscopy, using an Axioskop2 microscope (Zeiss, Jena, Germany), equipped with a UV-lamp and the appropriate filters for DIC and visualization of DAPI stains. The extent of internal infection was assessed using 5 categories: (1) [les ]30 bacterial particles, exclusively spores, all in front part of digestive tract, anteriormost intestinal cells all intact, (2) 30<particles[les ]100, exclusively spores, mainly but not exclusively in front part of digestive tract, anteriormost intestinal cells intact or with weak damage, (3) >100 particles, exclusively spores, throughout the whole digestive tract, usually highly concentrated in anterior segments, anteriormost intestinal cells severely damaged or destroyed, (4) as in category 3, but with vegetative cells in first third of the body, (5) as in category 3, but with vegetative cells throughout more than first third of the body, animals often packed with vegetative cells and spores.
Assessment of ingestion rates
Differences in ingestion rates among strains were studied to examine whether these are responsible for the observed differences in survival rate. Pumping activity could not be analysed in liquid culture media, because of fast whole-body movements of the worms. Instead, it was determined on MM agar-filled wells of 24-well culture plates, completely covered with bacterial suspensions. Two bacterial suspensions were used, including either the pathogenic B. thuringiensis NRRL B-18247 (final concentration: 1×10⁸ particles/ml) and E. coli OP50 (1×10⁹ cells/ml) or, alternatively, E. coli OP50 only (1×10⁹ cells/ml). Twenty μl of these suspensions were applied to each well approximately 6 h before the start of the experiments. Worms were assessed individually 3–4 h after transfer to the test plates, after a sufficiently long period of acclimatization and before first occurrence of dead animals. The number of pumps, as observable from grinder movements, was counted within an interval of 20 sec. This short interval permitted parallel assessment of a large number of animals. Note that the results of a pilot study indicated that measurements over longer periods (1 min) or repeated measurements (twice for 20 sec) produced similar results as to the order of the animals' pumping activity across culture plates. Worms were only examined if they were not on the edge or outside of the bacterial suspension. The different strains were studied in parallel, and the position of worms from the different strains was randomized across culture plates. Experiments were performed at 20 °C and constant light.
Behaviour test
The behaviour test was used to determine whether C. elegans strains differ as to the evasion of pathogenic bacteria. These tests were performed in 24-well culture plates, filled with 2·5 ml of minimal medium agar (MM agar; 3·5% Agar in H2O). Each well contained 2 bacterial ‘spots’ on opposite sides, one with the pathogenic and the other with the non-pathogenic B. thuringiensis (final concentration of 6·67×108 particles/ml). Both spots also always contained E. coli OP50 (final concentration: 3×10¹⁰ cells/ml) to exclude the possibility that spots were avoided due to the absence of food. Each spot consisted of a volume of 3 μl, which was pipetted onto plates no more than 3 h prior to the start of the experiments. Worms were tested individually to prevent artefacts due to social interactions, which are known for this species during feeding (de Bono & Bargmann, 1998; de Bono et al. 2002). Experiments were performed at 20 °C and constant light. Animals were transferred from NGM-plates to the middle of the test wells, using a worm picker. Transfer of worms to a particular plate was completed within less than 20 min. The behaviour of different C. elegans strains was always assessed in parallel. Across each culture plate, we randomized the position of the different nematode strains and also the position of the test vs. control bacterial suspensions. In the course of a pilot study, worms were observed to move between spots during the first couple of hours, suggesting that choice of bacterial spot is not as yet completed. Such movements were no longer recorded after 24 h. Worm behaviour was thus assessed after 24 h by recording whether nematodes were present on the side with or without pathogenic bacteria.
Statistical analysis
All statistical analysis was performed with the program SPSS, version 10.0.5 (SPSS Inc., Chicago, Illinois, USA). The likelihood ratio test of independence was employed for the analysis of frequencies (survival assay, behaviour test, infection process), whereby significance levels were calculated with the Monte Carlo approach, based on 10000 permutations. Pumping rates were assessed with the Mann–Whitney U test for the comparison between treatments and the Kruskal–Wallis test for the comparison of strains within each treatment. Possible correlations of survival with avoidance rate and pumping activity were analysed using Spearmann's rank-order correlation test. For this purpose, strain-specific values were used for each variable, namely overall proportion of survival, overall proportion of pathogen evasion, and median of pumping activity. Multiple testing was accounted for by applying the Dunn-Sidak adjustment of significance levels (Sokal & Rohlf, 1995; Quinn & Keough, 2002).
RESULTS
Survival rate
For each treatment, 90 specimens were assayed per strain, resulting in a total of 7200 worms for the whole experiment. Survival in the control treatment was 100% or slightly less, showing little variation among strains, regardless of the culture medium and the temperature used (maximum range: 97·8–100%). These differences were not significant (Table 1). Therefore, the worm strains did not appear to be differently affected by the culture conditions used.

Survival in the presence of pathogenic B. thuringiensis is, in general, significantly lower than in the respective controls, irrespective of the experimental conditions (Table 1). In addition, survival differs significantly among the C. elegans strains in each of the 3 treatments (Table 1; Fig. 1). Survival percentages ranged from 27·8 to 80·0% in PBS at 20 °C, from 37·8 to 83·3% in S-medium at 20 °C, and from 22·2 to 77·8% in S-medium at 25 °C. Survival was thus further reduced under more extreme conditions, such as low nutrition medium (PBS) or high temperature (25 °C). In all cases, it was highest for strain CB4851 (77·8–83·3%), followed by CB4856 (35·6–76·7%), and in different treatments AB1 (48·9–62·2%) and AB2 (28·9–72·2%). It was lowest for CB4555 (22·2–40·0%), CB3191 (25·6–41·1%), DH424 (26·7–55·6%), and CB4858 (23·3–50·0%).

Fig. 1. Variation in survival towards the parasitic Bacillus thuringiensis strain NRRL B-18247. The survival assays were performed in (A) S-medium at 20 °C; (B) PBS at 20 °C; and (C) S-medium at 25 °C. Variation among Caenorhabditis elegans strains is in all cases significant (Likelihood ratio tests; in all three cases χ2[ges ]83.78, D.F.=9, and P<0.001). Vertical lines show standard errors.
Infection process
To assess possible reasons for differences in survival rate, we studied variation in the process of infection. Each of the 3 treatments included 45 animals per strain (total number of worms used: 1350). A few specimens were lost during transfer between different culture media or between culture medium and microscopic slides. The final sample size per strain and treatment thus ranged between 39 and 45. All animals were still alive after 4 h. However, a strong increase in mortality was observed after subsequent 20 h in PBS (4+20 h treatment) or after 24 contact with pathogens (24 h treatment). The differences in survival between these treatments are clearly significant (Table 1; Fig. 2A). In addition, the survival rate varied significantly among worm strains in both the 4+20 h treatment and the 24 h treatment (Table 1). Furthermore, they showed a significant positive correlation with the results obtained from the previous survival assay in PBS at 20 °C and can thus be considered to be typical for this specific experimental set-up (Table 2).

Fig. 2. General outcome of the assessment of infection levels, showing differences in (A) overall survival across treatments; (B) infection levels across treatments for surviving animals; and (C) infection levels across treatments for dead animals, 4 h, 4+20 h, and 24 h refer to the 3 different treatments (see text for details). The five different infection categories are indicated by different shades of grey and filling patterns, ranging from 1, low infection level, up to 5, very high infection level (see methods for further details). Overall differences across treatments are significant for the survival rate (Likelihood ratio test, χ2=297·60, D.F.=2, P<0·001) and the infection level (Likelihood ratio test, χ2=646·95, D.F.=8, P<0·001).

The overall infection level similarly increases across treatments. Again, differences across treatments were significant (Table 1; Fig. 2B, C). When dead and surviving worms are considered separately, then two main additional observations can be made. First, infection levels are always highest after continuous contact with the pathogens (24 h treatment). This is interesting because the 24 h treatment produces surviving animals with comparatively high pathogen load, whereas the 4+20 h treatment results in dead worms with comparatively low infection levels. Second, the absolute number of surviving worms with lowest infection levels is higher in the 4+20 h treatment than in the 4 h treatment. Nevertheless, the overall association between infection level and survival rate is significant (Table 1). This is also the case when the 4+20 h treatment, and the 24 h treatment are analysed separately (Table 1; see also Fig. 3B–E).
Within each of the 3 treatments, C. elegans strains varied significantly in infection levels (Table 1; Fig. 3). The strain CB4851 generally produced the lowest infection levels. This strain was never recorded for infection category 5 (animals full of bacterial spores and vegetative cells), even if specimens were dead. This is in clear contrast to all other strains. The highest infection levels were generally observed for strains CB4555 and KR314.

Fig. 3. Variation in infection levels between Caenorhabditis elegans strains for (A) the 4 h treatment; (B, C) the 4+20 h treatment; and (D, E) the 24 h treatment. Results are shown for surviving (B, D) and dead worms (C, E) separately. The different shades of grey and filling patterns denote the five different infection categories as indicated. For a definition of infection categories and details about the 3 treatments, see the Materials and Methods section. The differences between strains are significant for the 4 h treatment (Likelihood ratio test, χ2=128·57, D.F.=27, P<0·001), the 4+20 h treatment (Likelihood ratio test, χ2=142·0, D.F.=36, P<0·001), and the 24 h treatment (Likelihood ratio test, χ2=161·17, D.F.=36, P<0·001).
Feeding behaviour
Pumping activity was recorded to assess whether survival rates are associated with differences in feeding behaviour. For this purpose, 40 worms per lineage were observed in the presence of the standard food source only (E. coli OP50) or a mixture of E. coli OP50 and pathogenic B. thuringiensis (total number of worms assayed: 800). Results could not be obtained for all worms, for example, if they constantly stayed on the outer surface of the MM agar. These cases were excluded, resulting in 26–38 worms per lineage for the control and 29–36 worms per lineage for the test treatment. Pumping activity was, in general, significantly lower in the test treatment than in the control (Table 1). Variation among strains was clearly insignificant in the control, whereas the test treatment produced very strong differences among strains (Table 1). In the latter case, there was also considerable variation within strains (see Fig. 4). Interestingly, some strains with high survival rates showed a strongly reduced ingestion rate (e.g. CB4856, AB2), whereas there is almost no reduction in some of the strains with low survival rates (e.g. DH424). However, the opposite pattern could also be observed: strains with high survival rate and almost no reduction in pumping activity (e.g. AB1) and strains with low survival and strongly reduced pumping rates (e.g. CB3191, CB4555). All in all, there was no significant correlation between survival and pumping activity in either the control or the test treatment (Table 2).

Fig. 4. Variation in the pumping rate of different Caenorhabditis elegans strains on NGM-plates with E. coli OP50 only (white boxes), or alternatively E. coli OP50 and the pathogenic Bacillus thuringiensis NRRL B-18247 (grey boxes). Significant differences are found between treatments (Mann–Whitney U test, U=11801·5, N=320–322 per treatment, P<0·001), among strains for the test treatment (Kruskal–Wallis test, χ2=15·47, D.F.=9, P=0·035), but not among strains for the control treatment (Kruskal–Wallis test, χ2=18·04, D.F.=9, P=0·079). Results are given as box-plots such that the horizontal line represents the median, the box the first quartile, the vertical lines the range, and the circles and stars the outliers.
Pathogen evasion behaviour
For the behaviour test, a total of 80 animals was examined per strain (total of 800 for the whole experiment). However, the final position of some worms was ambiguous, e.g. in cases where animals remained in the middle or moved to the outer edge of the agar. These worms were excluded from the data set. Statistical analysis was thus based on 58–69 specimens per strain. In general, the nematodes avoided pathogenic B. thuringiensis. At the same time, different strains showed significant variation in their response (Table 1; Fig. 5). The percentage of pathogen evasion was highest for AB1 (71·2%), followed by CB4851 (67·2%), CB4856 (65·2%), and AB2 (65·0%). It was lowest for CB4555 (41·3%), CB3191 (49·3%), and DH424 (50·0%). Interestingly, strains with a high rate of evasion also showed a high rate of survival. This correlation was significant when evasion behaviour was compared to survival in PBS at 20 °C (Spearman rank test, rS=0·894, N=10, P<0·001; Fig. 6), and to survival in S-medium at 25 °C (Spearman rank test, rS=0·875, N=10, P=0·001). After application of the Dunn-Sidak adjustment of significance levels, the correlation between evasion and survival in S-medium at 20 °C was insignificant, but it still indicates a strong trend (Spearman rank test, rS=0·644, N=10, P=0·044).

Fig. 5. Variation in evasion behaviour towards the pathogenic Bacillus thuringiensis NRRL B-18247. Continuous line represents an evasion rate of 0·5 (= random choice). Evasion differs significantly among strains (Likelihood ratio test, χ2=20·63, D.F.=9, P<0·015). Standard errors are given by the vertical lines.

Fig. 6. Correlation between survival rate and evasion rate. Survival rate was established in PBS at 20 °C. Each dot refers to a specific Caenorhabditis elegans strain. The correlation is significant (Spearman's rank order correlation test, rS=0·894, N=10, P<0·001).
DISCUSSION
Our study provides the first evidence of variation in the response of different natural isolates of C. elegans towards a potential parasite, B. thuringiensis. Such variation was inferred for the survival rate, infection levels, the reduction of ingestion rates, and evasion behaviour. In this context, it is important to consider that each of the different C. elegans strains is likely to be genetically uniform (i.e. all individuals of a specific strain have identical genotypes). These strains were each maintained in the laboratory for several generations before cryo-preservation. Thus, they have been subject to selection to laboratory conditions in combination with inbreeding (Hodgkin & Doniach, 1997). The assumption is also supported by the absence of within-strain variation in polymorphic microsatellite loci (Sivasundar & Hey, 2003; Markus Haber & Hinrich Schulenburg, unpublished data) and single nucleotide polymorphisms (SNPs; Koch et al. 2000). Therefore, the observed differences in anti-parasite defence between strains are likely to result from genetic differences, rather than variation among strains in genotype composition and diversity (i.e. a specific strain comprises several genotypes, and different strains vary in the number and abundance of genotypes). In turn, this suggests that the strains have differentially adapted to parasite threats, implying that parasites play an important role in the natural ecology of this species. This conclusion clearly renders C. elegans more valuable as a model host because worm defence is, in this case, expected to be complex and variable over time. Considering the advantages of C. elegans as an experimental system, future phenotypic and molecular genetic analysis of such traits in different host lineages should provide valuable insights into the general characteristics and dynamics of parasite–host interactions.
Interestingly, our current data already suggest that worm defence is complex. First, worm behaviour is identified as an important component of anti-parasite defence. These behavioural defences include parasite evasion and possibly the reduction of ingestion rates. In the latter case, it cannot as yet be excluded that reduced pumping is simply caused by the toxic effects of the parasite (i.e. inhibition of neurons and/or muscles by toxins reduces pumping rates) and thus does not represent a true defence behaviour (see also Darby et al. 1999; O'Quinn, Wiegand & Jeddeloh, 2001).
Second, the inferred positive correlation between evasion behaviour and survival suggests that both have a common cause. Note that pathogen evasion cannot be directly responsible for increased survival, because survival was assessed in a liquid culture medium, where worms were forced into direct contact with pathogens, thereby preventing complete pathogen evasion. A likely candidate for such a common cause is the ability to perceive pathogens, which is essential for evasion behaviour. It may also enhance survival under liquid culture conditions if survival is mediated by reduced pathogen ingestion, selective uptake of non-pathogenic microorganisms or an inducible immune response, which all require an efficient pathogen perception system.
Third, if it is assumed that pumping activity, which could only be measured on NGM-plates, is similar in the liquid culture media used for the survival assays, then the observed reduction in ingestion rates – may it be an active or a passive process – seems insufficient to explain survival rate differences in all but three cases (AB2, CB4856, DH424). In all other cases, alternative defence strategies should be more important.
Fourth, analysis of infection levels generally demonstrates that the number of highly infected worms increases over time, even if animals are no longer in contact with the pathogens. This confirms the parasitic nature of B. thuringiensis, in consistency with previous studies (Borgonie et al. 1995, 1996). Interestingly, the results also show that the absolute number of weakly infected animals increases after pathogens are removed from culture medium (4+20 h treatment). This suggests that some worms were able to purge themselves of pathogens. Such ability is most likely mediated by parasite–host incompatibility, the general expression of antibacterial or detoxifying factors, and/or an inducible immune response. In this case, the defence is not entirely efficient because purging of pathogens does not seem to occur when hosts remain in contact with pathogens (24 h treatment).
Fifth, the overall survival rate is significantly associated with infection load. At the same time, our data indicate that this relationship shows some variation between strains and treatments. For instance, some surviving animals seem to tolerate higher infection levels than others. Similarly, some dead worms only bear very few or no parasites. These observations suggest that individual worm death is caused by additional factors such as the Bt toxin characterized from B. thuringiensis. In turn, worm survival should then be affected by the ability to cope with such toxins, e.g. by toxin degradation or by preventing toxin-binding to host factors (toxin–host incompatibility). In fact, it cannot as yet be excluded that the Bt toxin is the main cause of nematode death and not parasite burden. In this case, the significant overall association between survival and infection level is an artefact due to co-variation of infection level with toxin abundance and/or efficiency.
The exact importance of the different defence strategies against B. thuringiensis clearly warrants further investigation. It is worth noting that some of them have already been implicated in worm defence. With respect to behavioural responses, it was shown that C. elegans is able to evade a pathogenic strain of S. marcescens, that it reduces ingestion rates in the presence of pathogens (e.g., B. pseudomallei, P. aeruginosa), and that it is generally able to perceive and respond to chemical cues, such as food sources and noxious chemicals (Andrew & Nicholas, 1976; Bargmann & Mori, 1997; O'Quinn et al. 2001; Pujol et al. 2001; de Bono et al. 2002; Smith et al. 2002; Jovelin et al. 2003). In addition, a carbohydrate-modifying enzyme on the gut surface was found responsible for susceptibility to the Bt toxin, produced by the same B. thuringiensis strain used here (Griffiths et al. 2001). Moreover, increased expression of detoxifying factors was shown to improve resistance towards human pathogens, e.g. P. aeruginosa (Mahajan-Miklos et al. 1999). Kato et al. (2002) reported that various antibacterial factors are expressed in the gut, e.g. ABF-1, ABF-2. Furthermore, different studies showed that infection with human pathogens results in an induced immune response, including elevated expression of lysozymes, C-type lectins, and other factors, or induction of programmed cell death, and possibly activation of the TGFβ- or the p38 MAP kinase signalling pathway (Aballay & Ausubel, 2001; Kim et al. 2002; Mallo et al. 2002; Kurz & Ewbank, 2003).
Our results also provide valuable information about the characteristics of some C. elegans strains. Almost all research in C. elegans is based on the strain N2. Our study demonstrates that this strain is not the norm, but rather a case among many. Therefore, results obtained from analysis of N2 may not always be representative for the whole species. In addition, the strain CB4851 clearly bears one of the most efficient defence systems towards B. thuringiensis. Intriguingly, its reproductive rate on standard NGM-plates with E. coli OP50 is extremely low in comparison to other natural isolates, suggesting that it possesses low fitness (Hodgkin & Doniach, 1997). However, if its defences are similarly efficient towards other pathogens, then it should clearly be at an advantage over other strains in parasite-rich habitats, which may then compensate for the apparently low reproductive rate. Finally, our study includes two strains with identical transposon Tc1 pattern, snip-SNPs, and microsatellite genotypes, which have previously been used for characterization of C. elegans strains (Hodgkin & Doniach, 1997; Koch et al. 2000; Sivasundar & Hey, 2003; Markus Haber Hinrich Schulenburg, unpublished results). These two strains, N2 and CB3191, clearly differ in their response to B. thuringiensis. Therefore, it may be worth in the future to evaluate alternative additional markers for strain genotyping, e.g. by extending the range of SNP and microsatellite loci.
We are most grateful to Barbara Hasert for technical assistance, to Nico Michiels, Joris Koene, Lukas Schärer, Manuela Schüngel, Markus Haber, Michael Habig, Jens Rolff, Joachim Kurtz, Dieter Ebert, Dita Vizoso, Jonathan Hodgkin, Maria Gravato-Nobre, Delia O'Rourke, Jacopo Novelli, Hannah Nicholas, Jonathan Ewbank, John Dennehy for valuable advice on this project, to Theresa Stiernagle from the Caenorhabditis Genetics Centre for providing worm samples, and to the German Science Foundation for financial support (Deutsche Forschungsgemeinschaft grant number SCHU 1415/1-1).
References
REFERENCES
ABALLAY, A. &
AUSUBEL, F. M.
(2001).
Programmed cell death mediated by ced-3 and ced-4 protects Caenorhabditis elegans from Salmonella typhimurium-mediated killing.
Proceedings of the National Academy of Sciences, USA
98, 2735–2739.CrossRefGoogle Scholar
AGRAWAL, A. F. &
LIVELY, C. M.
(2001).
Parasites and the evolution of self-fertilization.
Evolution
55, 869–879.CrossRefGoogle Scholar
ANDREW, P. A. &
NICHOLAS, W. L.
(1976).
Effect of bacteria on dispersal of Caenorhabditis elegans (Rhabditidae).
Nematologica
22, 451–461.CrossRefGoogle Scholar
BARGMANN, C. I. &
MORI, I. (1997).
Chemotaxis and thermotaxis. In
C. elegans II
(ed. Riddle, D. L.,
Blumenthal, T.,
Meyer, B. J. &
Priess, J. R.
), pp. 717–737.
Cold Spring Harbor Laboratory Press,
Cold Spring Harbor.
BORGONIE, G.,
CLAEYS, M.,
LEYNS, F.,
ARNAUT, G.,
DE WAELE, D. &
COOMANS, A.
(1996).
Effect of nematicidal Bacillus thuringiensis strains on free-living nematodes. 1. Light microscopic observations, species and biological stage specificity and identification of resistant mutants of Caenorhabditis elegans.
Fundamental and Applied Nematology
19, 391–398.Google Scholar
BORGONIE, G.,
VAN DRIESSCHE, R.,
LEYNS, F.,
ARNAUT, G.,
DE WAELE, D. &
COOMANS, A.
(1995).
Germination of Bacillus thuringiensis spores in bacteriophagous nematodes (Nematoda: Rhabditida).
Journal of Invertebrate Pathology
65, 61–67.CrossRefGoogle Scholar
DARBY, C.,
COSMA, C. L.,
THOMAS, J. H. &
MANOIL, C.
(1999).
Lethal paralysis of Caenorhabditis elegans by Pseudomonas aeruginosa.
Proceedings of the National Academy of Sciences, USA
96, 15202–15207.CrossRefGoogle Scholar
DE BONO, M. &
BARGMANN, C. I.
(1998).
Natural variation in a neuropeptide Y receptor homolog modifies social behavior and food response in C. elegans.
Cell
94, 679–689.CrossRefGoogle Scholar
DE BONO, M.,
TOBIN, D. M.,
DAVIS, M. W.,
AVERY, L. &
BARGMANN, C. I.
(2002).
Social feeding in Caenorhabditis elegans is induced by neurons that detect averse stimuli.
Nature, London
419, 899–903.CrossRefGoogle Scholar
EWBANK, J. J.
(2002).
Tackling both sides of the host–pathogen equation with Caenorhabditis elegans.
Microbes and Infection
4, 247–256.CrossRefGoogle Scholar
FRANK, S. A.
(1996).
Models of parasite virulence.
Quarterly Review of Biology
71, 37–78.CrossRefGoogle Scholar
GRIFFITHS, J. S.,
WHITACRE, J. L.,
STEVENS, D. E. &
AROIAN, R. V.
(2001).
Bt toxin resistance from loss of a putative carbohydrate-modifying enzyme.
Science
293, 860–864.CrossRefGoogle Scholar
HAMILTON, W. D.,
AXELROD, R. &
TANESE, R.
(1990).
Sexual reproduction as an adaptation to resist parasites: a review.
Proceedings of the National Academy of Sciences, USA
87, 3566–3573.CrossRefGoogle Scholar
HODGKIN, J. &
DONIACH, T.
(1997).
Natural variation and copulatory plug formation in Caenorhabditis elegans.
Genetics
146, 149–164.Google Scholar
HOPE, I. A.
(1999).
C. elegans: a Practical Approach.
Oxford University Press,
Oxford.
JOVELIN, R.,
AJIE, B. C. &
PHILLIPS, P. C.
(2003).
Molecular evolution and quantitative variation for chemosensory behaviour in the nematode genus Caenorhabditis.
Molecular Ecology
12, 1325–1337.CrossRefGoogle Scholar
KATO, Y.,
AIZAWA, T.,
HOSHINO, H.,
KAWANO, K.,
NITTA, K. &
ZHANG, H.
(2002).
abf-1 and abf-2, ASABF-type antimicrobial peptide genes in Caenorhabditis elegans.
Biochemical Journal
361, 221–230.CrossRefGoogle Scholar
KIM, D. H.,
FEINBAUM, R.,
ALLOING, G.,
EMERSON, F. E.,
GARSIN, D. A.,
INOUE, H.,
TANAKA-HINO, M.,
HISAMOTO, N.,
MATSUMOTO, K.,
TAN, M. W. &
AUSUBEL, F. M.
(2002).
A conserved p38 MAP kinase pathway in Caenorhabditis elegans innate immunity.
Science
297, 623–626.CrossRefGoogle Scholar
KOCH, R.,
VAN LUENEN, H. G.,
VAN DER HORST, M.,
THIJSSEN, K. L. &
PLASTERK, R. H.
(2000).
Single nucleotide polymorphisms in wild isolates of Caenorhabditis elegans.
Genome Research
10, 1690–1696.CrossRefGoogle Scholar
KURZ, C. L. &
EWBANK, J. J.
(2003).
Caenorhabditis elegans: an emerging genetic model for the study of innate immunity.
Nature Reviews Genetics
4, 380–390.CrossRefGoogle Scholar
LEYNS, F.,
BORGONIE, G.,
ARNAUT, G. &
DE WAELE, D.
(1995).
Nematicidal activity of Bacillus thuringiensis isolates.
Fundamental and Applied Nematology
18, 211–218.Google Scholar
MAHAJAN-MIKLOS, S.,
TAN, M. W.,
RAHME, L. G. &
AUSUBEL, F. M.
(1999).
Molecular mechanisms of bacterial virulence elucidated using a Pseudomonas aeruginosa-Caenorhabditis elegans pathogenesis model.
Cell
96, 47–56.CrossRefGoogle Scholar
MALLO, G.,
KURZ, C.,
COUILLAULT, C.,
PUJOL, N.,
GRANJEAUD, S.,
KOHARA, Y. &
EWBANK, J. J.
(2002).
Inducible antibacterial defense system in C. elegans.
Current Biology
12, 1209–1214.CrossRefGoogle Scholar
MARROQUIN, L. D.,
ELYASSNIA, D.,
GRIFFITTS, J. S.,
FEITELSON, J. S. &
AROIAN, R. V.
(2000).
Bacillus thuringiensis (Bt) toxin susceptibility and isolation of resistance mutants in the nematode Caenorhabditis elegans.
Genetics
155, 1693–1699.Google Scholar
O'QUINN, A. L.,
WIEGAND, E. M. &
JEDDELOH, J. A.
(2001).
Burkholderia pseudomallei kills the nematode Caenorhabditis elegans using an endotoxin-mediated paralysis.
Cell Microbiology
3, 381–393.CrossRefGoogle Scholar
PARTRIDGE, L. &
GEMS, D.
(2002).
Mechanisms of ageing: public or private?
Nature Reviews Genetics
3, 165–175.Google Scholar
PUJOL, N.,
LINK, E. M.,
LIU, L. X.,
KURZ, C. L.,
ALLOING, G.,
TAN, M. W.,
RAY, K. P.,
SOLARI, R.,
JOHNSON, C. D. &
EWBANK, J. J.
(2001).
A reverse genetic analysis of components of the Toll signaling pathway in Caenorhabditis elegans.
Current Biology
11, 809–821.CrossRefGoogle Scholar
QUINN, G. P. &
KEOUGH, M. J.
(2002).
Experimental Design and Data Analysis for Biologists.
Cambridge University Press,
Cambridge.CrossRef
RIDDLE, D. L.,
BLUMENTHAL, T.,
MEYER, B. J. &
PRIESS, J. R.
(1997).
C. elegans II.
Cold Spring Harbor Laboratory Press,
Cold Spring Harbor.
SIVASUNDAR, A. &
HEY, J.
(2003).
Population genetics of Caenorhabditis elegans: the paradox of low polymorphism in a widespread species.
Genetics
163, 147–157.Google Scholar
SMITH, M. P.,
LAWS, T. R.,
ATKINS, T. P.,
OYSTON, P. C.,
DE POMERAI, D. I. &
TITBALL, R. W.
(2002).
A liquid-based method for the assessment of bacterial pathogenicity using the nematode Caenorhabditis elegans.
FEMS Microbiology Letters
210, 181–185.CrossRefGoogle Scholar
SOKAL, R. R. &
ROHLF, F. J.
(1995).
Biometry,
3 Edn.
W.H. Freeman and Co.,
New York,
USA.
STIERNAGLE, T.
(1999).
Maintenance of C. elegans. In
C. elegans: a Practical Approach
(ed. Hope, I. A.
), pp. 51–67.
Oxford University Press,
Oxford.
WEI, J. Z.,
HALE, K.,
CARTA, L.,
PLATZER, E.,
WONG, C.,
FANG, S. C. &
AROIAN, R. V.
(2003).
Bacillus thuringiensis crystal proteins that target nematodes.
Proceedings of the National Academy of Sciences, USA
100, 2760–2765.CrossRefGoogle Scholar
WOOD, W. B.
(1988).
The Nematode Caenorhabditis elegans.
Cold Springer Harbor Laboratory Press,
Cold Spring Harbor.
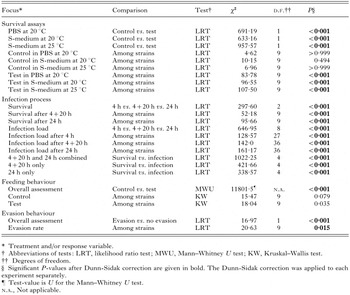
Table 1. Statistical analysis of the differences in survival rate, infection load, feeding behaviour, and evasion behaviour
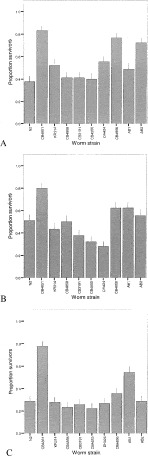
Fig. 1. Variation in survival towards the parasitic Bacillus thuringiensis strain NRRL B-18247. The survival assays were performed in (A) S-medium at 20 °C; (B) PBS at 20 °C; and (C) S-medium at 25 °C. Variation among Caenorhabditis elegans strains is in all cases significant (Likelihood ratio tests; in all three cases χ2[ges ]83.78, D.F.=9, and P<0.001). Vertical lines show standard errors.

Fig. 2. General outcome of the assessment of infection levels, showing differences in (A) overall survival across treatments; (B) infection levels across treatments for surviving animals; and (C) infection levels across treatments for dead animals, 4 h, 4+20 h, and 24 h refer to the 3 different treatments (see text for details). The five different infection categories are indicated by different shades of grey and filling patterns, ranging from 1, low infection level, up to 5, very high infection level (see methods for further details). Overall differences across treatments are significant for the survival rate (Likelihood ratio test, χ2=297·60, D.F.=2, P<0·001) and the infection level (Likelihood ratio test, χ2=646·95, D.F.=8, P<0·001).
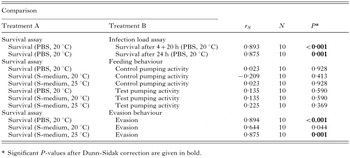
Table 2. Spearman rank test on the correlation between the survival rate and other traits
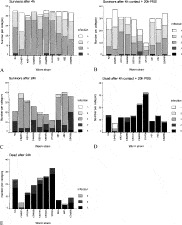
Fig. 3. Variation in infection levels between Caenorhabditis elegans strains for (A) the 4 h treatment; (B, C) the 4+20 h treatment; and (D, E) the 24 h treatment. Results are shown for surviving (B, D) and dead worms (C, E) separately. The different shades of grey and filling patterns denote the five different infection categories as indicated. For a definition of infection categories and details about the 3 treatments, see the Materials and Methods section. The differences between strains are significant for the 4 h treatment (Likelihood ratio test, χ2=128·57, D.F.=27, P<0·001), the 4+20 h treatment (Likelihood ratio test, χ2=142·0, D.F.=36, P<0·001), and the 24 h treatment (Likelihood ratio test, χ2=161·17, D.F.=36, P<0·001).

Fig. 4. Variation in the pumping rate of different Caenorhabditis elegans strains on NGM-plates with E. coli OP50 only (white boxes), or alternatively E. coli OP50 and the pathogenic Bacillus thuringiensis NRRL B-18247 (grey boxes). Significant differences are found between treatments (Mann–Whitney U test, U=11801·5, N=320–322 per treatment, P<0·001), among strains for the test treatment (Kruskal–Wallis test, χ2=15·47, D.F.=9, P=0·035), but not among strains for the control treatment (Kruskal–Wallis test, χ2=18·04, D.F.=9, P=0·079). Results are given as box-plots such that the horizontal line represents the median, the box the first quartile, the vertical lines the range, and the circles and stars the outliers.

Fig. 5. Variation in evasion behaviour towards the pathogenic Bacillus thuringiensis NRRL B-18247. Continuous line represents an evasion rate of 0·5 (= random choice). Evasion differs significantly among strains (Likelihood ratio test, χ2=20·63, D.F.=9, P<0·015). Standard errors are given by the vertical lines.

Fig. 6. Correlation between survival rate and evasion rate. Survival rate was established in PBS at 20 °C. Each dot refers to a specific Caenorhabditis elegans strain. The correlation is significant (Spearman's rank order correlation test, rS=0·894, N=10, P<0·001).
 You have
Access
- 95
- Cited by