1. Introduction
1.1 In Part 4 of this series (Wilkie & Şahin, Reference Wilkie and Şahin2018), we modelled share Earnings, “Cover” (the ratio of earnings over dividends) and Price/Earnings (P/E) ratios as additions to the Wilkie model. We used data from 1962, based both on the old “FT 500” index (now the FTSE Non-financials index) and (from 1992) the FTSE All Share index, together forming what we called a “composite index”. We used data up to June 2016. We observed in that paper that the Earnings Index had dropped greatly over the year from June 2015 to June 2016, by a little over 50%, or in log terms, a reduction of 0.72. Yet over the same period, share dividends had risen and share prices had declined but by very little. Cover, normally in the range 1.5 to 3 or so, had dropped below unity, to 0.89 and the P/E ratio had risen to more than 30. Following our model, we would have expected share dividends and share prices to follow earnings in halving over the next few years. However, this had not happened yet. We postulated that “the market” fully expected earnings to recover, and suggested a way of allowing for this, by including an artificial non-zero mean value for the earnings residual (EE) for 2017, of about 0.7. This gave forecasts for future earnings, dividends and share prices similar to those forecast as at June 2015.
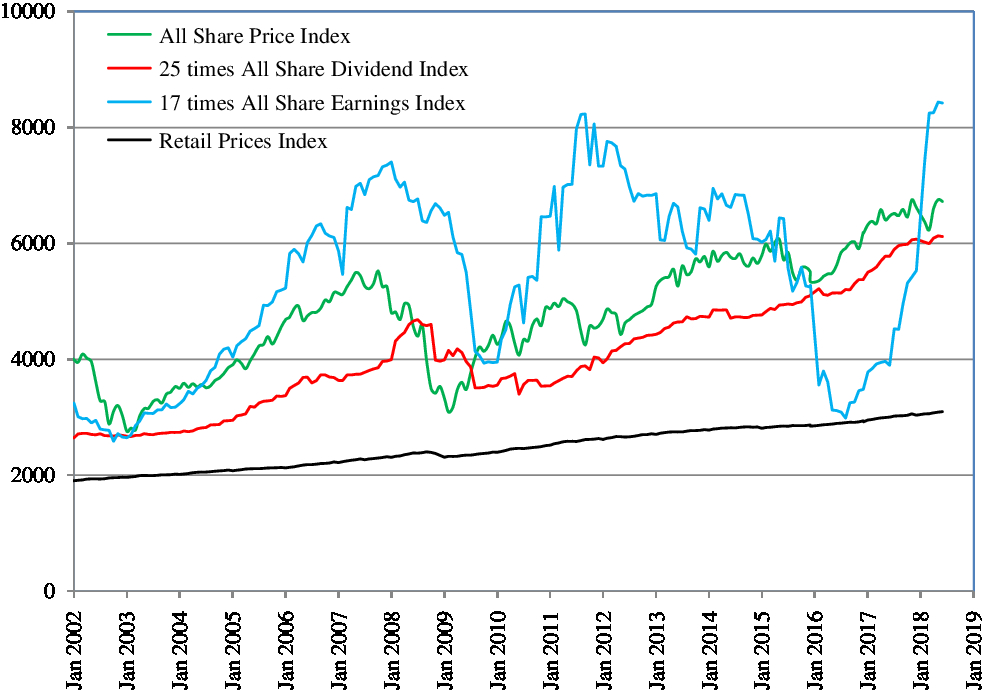
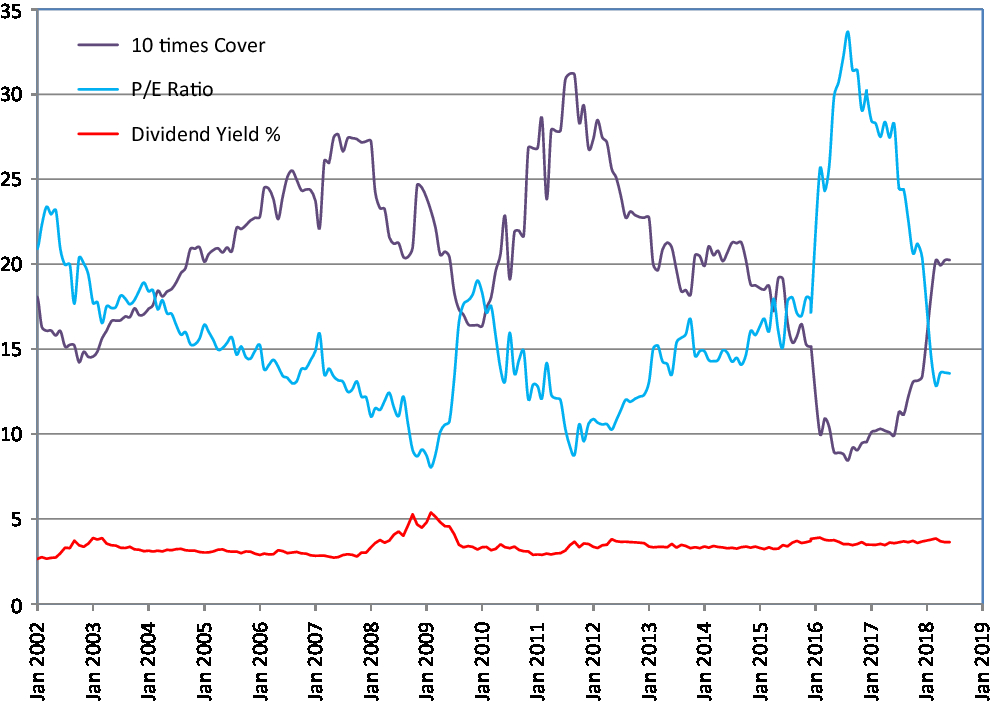
1.2 We now have data for two more years, up to June 2018. Earnings have recovered enormously, rising by over 27% in 2016-17 and more than doubling in 2017-18, so that by June 2018 our Earnings Index, was higher than ever before, higher even than the previous peak in September 2011. Cover is back to more than 2, and the P/E ratio back to a normal middle level of 13.57. In Figure 1 we show graphs of the Retail Prices Index, All Share Price Index, 25 times the Dividend Index and 17 times the Earnings Index, all from 2002 (so beyond the period of our composite index). In Figure 2 we show the corresponding Dividend Yield, 10 times Cover, and the P/E Ratio. These two Figures continue Figures 1 and 3 of the Part 4 paper.
Retail Prices Index and All Share Price Index, 25 times Dividend Index and 17 times Earnings Index. January 2002 to June 2018.

Dividend Yield, 10 times Cover and P/E Ratio, for All Share Index. January 2002 to June 2018.

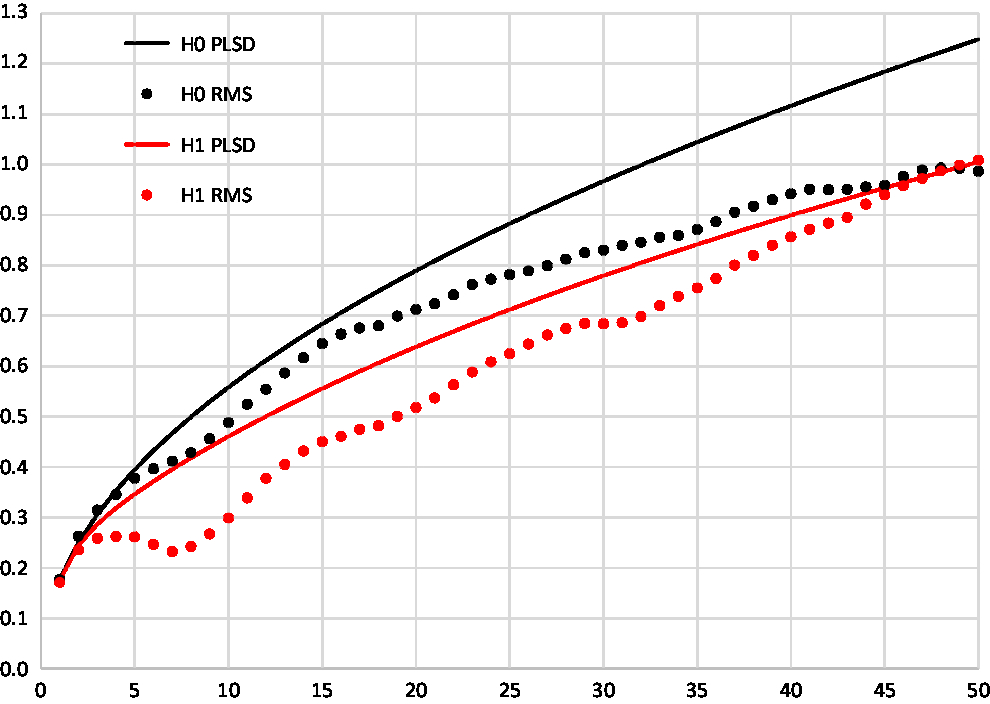
Values of PLSD(k) and RMS(k), for  ${k} =1 \text{to} 50$, 1923 to 2108, models H0 and H1.

1.3 The large changes in the last two years suggest that we should revisit our model, and in this Supplement we do so, fitting the models for Earnings, Cover and P/E Ratio. It may be questioned why a model that is intended for long-term simulations, and should therefore be a stable one, should be investigated again so quickly. Although one would normally like to keep the model unchanged, it seems to us appropriate to update the parameter values as frequently as one wishes, as new observations emerge. However, the very large changes in Earnings over the most recent years suggest that fuller investigation is needed in this case.
2. Models for 1923 to 2018
2.1 We first, quickly, fit updated models for 1923 to 2018 for Retail Prices, Share Dividend Yields and Share Dividends, because we wish to compare the models for this longer period with those for 1963 to 2018, which is our primary interest. For share data we use the FTSE All-Share index throughout, so our data is slightly different from the composite data we use for 1963 to 2018. For all these series we use the same models as we have used previously. However, we slightly simplify our notation, so that, for example, the mean QMU is renamed QM and the standard deviation QSD is renamed QS, and likewise for the other variables.
2.2 For Retail Prices we have: Q(t) is the index in June of year t;  ${QL}({t}) = \ln({Q}({t}))$, and
 ${I}({t}) = {QL}({t}) - {QL}({t}-1)$. Then we put:
 \begin{equation}I(t) = \textit{QM} + QA.(I(t-1) - QM) + QS.QZ(t)
\end{equation}
Fitting from 1923 to 2018 we get values of the parameters changed very little from those found in 2016:
 \begin{equation*}
QA = 0.571383;\ QM = 0.042408;\ QS = 0.038154.
\end{equation*}
2.3 For Dividend Yields we use what we called in Part 4 the “Unadjusted series”. Y(t) is the yield (as a fraction, not a percentage) in June of year t;  ${YL}({t}) = \ln({Y}({t}))$;
 ${YML} = \ln({YM})$. Then:
 \begin{align} YN(t) & = YA.YN(t-1) + YS.YZ(t)\\ YL(t) & = YW.I(t) + YML + YN(t)\end{align}
Fitting from 1923 to 2018 we get parameter values also little changed:
 \begin{equation*} YW= 1.418031;\ YA = 0.652530;\ YM = 0.036258;\ YS = 0.157234. \end{equation*}
2.4 For the Dividend Index, D(t);  ${DL}({t}) = \ln({D}({t}))$;
 ${K}(t) = {DL}({t})-{DL}({t}-1)$. Then we use a moving average of past inflation:
 \begin{align*} DM(t) & = DD.I(t) + (1 - DD).DM(t-1)\\ K(t) & = DW.DM(t) + DX.I(t) + DM + DY.YE(t-1) + DB.DE(t-1) + DS.DZ(t)\\ &\quad \textrm{with}\ DX\ \textrm{fixed as}\ 1 - DW\\
DL(t) & = DL(t-1) + K(t) \end{align*}
Fitting from 1923 to 2018 we get parameter values again little changed:
 \begin{align*} DW = & 0.419145;\ DD = 0.161770;\ DM = 0.011908;\ DY = -0.199313;\ DB = 0.475977;\\ &\quad DS =0.071772 \end{align*}
3. Models for 1963 to 2018
3.1 First we refit the first three series using only the data for 1963 to 2018. In general we prefer to use parameter values based on the longer series, but in order to compare models, as we do below, we wish to fit them over the same periods. We then use the fitted values for these series in the subsequent calculations; this affects only the values of YE, which are used in the formulae for L and V.
3.2 There are two considerations here about log likelihoods. When one is comparing various models in which the residuals are all assumed to be Normally distributed, the constant term in each log likelihood,  ${-}\ln(2.\pi)/2$, can be omitted, and we have often done this in the past. However, when comparing models with differing assumptions about the distribution of residuals, this term cannot be omitted, so. in anticipation of future requirements, we have changed our practice so as to always include it. It is only the difference in log likelihoods that matters; the absolute values are not important.
3.3 Secondly, when we are comparing sequential, or “cascade” models in which the model for each variable may depend on the values of the residuals for earlier variables in the sequence, it is desirable to be clear about what exactly one is comparing. So in the following comments, we first calculate the log likelihoods for all variables, using the values of the parameters found for the periods ending in 2016 but applied to the data ending in 2018, and then optimise the values for all variables, based on the data ending in 2018. All comparisons are on this basis.
3.4 For the first two series discussed in Section 2, we now get parameter values which are not very close to those for 1923 to 2018, but not too far away:
 \begin{align*} QA & = 0.692132;\ QM = 0.053292;\ QS = 0.033431\\ YW & = 1.488622;\ YA = 0.696261;\ YM = 0.036742;\ YS = 0.163887 \end{align*}
3.5 For the Dividend series in 2016 we got parameter values with DW negative and rather large, which seemed unsatisfactory, so we tried alternatives, such as putting DB = 0, and found a reasonable model. However, the large value of DD that we got meant that mostly current inflation was used, and rather little of past inflation, so the answers were not unreasonable. However, if we put  ${DW} = 0$ so that
 ${DX }= 1$, we would use only current inflation and ignore the past moving average and the value of DD would not matter. This would have been a much better solution previously. Using this model we now get:
 \begin{equation*}DW = 0, DX = 1, DM = 0.0097801;\ DY = -0.180357;\ DB = 0.389381;\ DS =0.065517\end{equation*}
This is much more satisfactory and so we shall use this new model in what follows.
3.6 We can fit the Earnings index only using the data from 1963. We have the index, E(t);  ${EL}({t}) = \ln({E}({t}))$; and
 ${L}(t) = {EL}({t}) - {EL}({t}-1)$. The model we chose in Part 4 was:
 \begin{equation*}L(t) = EQ.I(t) + (1 - EQ).I(t-1) + EY.YE(t-1) + EM + ES.EZ(t)\end{equation*}
Fitting from 1963 to 2018 we get a log likelihood of 17.42, with parameter values:
 \begin{equation*}EQ = 2.906977;\ EY = -0.411423;\ EM = 0.012336;\ ES = 0.177276.\end{equation*}
These are not very different from the values we found in Part 4, using data up to 2016, which were:
 \begin{equation*}EQ = 2.8494;\ EY = -0.3887;\ EM = -0.0041;\ ES = 0.1516.\end{equation*}
The standard deviation of the residuals, ES, is rather higher than before, not surprisingly because of the large deviations in the last two years. Applying the 2016 parameters to all the data up to 2018 gives a log likelihood of 15.55, so the improvement of 1.87 is not very large, and one might consider the revisions not justifiable. However, when we inspect the autocorrelations of the residuals, EE(t), in the more recent series, we see a first autocorrelation of 0.0906, not very high, and a second of −0.2954, with a partial autocorrelation coefficient of −0.3061; assuming normality this is significant at 5% but not very much so ( ${z} = {-}2.1926$). But almost all of the contribution to this large second coefficient comes from the residual in 2018 (a large positive value) versus that in 2016 (a large negative). We note that the residuals are by no means normal; the skewness is −0.2913 not exceptional, but the kurtosis is 10.30, a very large value. We are reluctant to build into the model an autocorrelation, adding a term
 ${EB2}.{EE}({t}{-}2)$, on the basis of only two year’s extreme values. But it is worth investigating.
First we add two autocorrelation terms for the residuals and put:
 \begin{align*}L(t) & = EQ.I(t) + (1 - EQ).I(t-1) + EY.YE(t-1) + EB1.EE(t-1) + EB2.EE(t-2)\\& \quad + EM + ES.EZ(t)\end{align*}
Fitting again from 1963 to 2018 we get a log likelihood of 22.55. a useful improvement of 5.13, with parameters:
 \begin{align*}EQ & = 2.100436;\ EY = -0.353314;\ EB1 = -0.007177;\ EB2 = -0.508116;\ EM = 0.008169;\\&\quad ES = 0.161750.\end{align*}
However, the value of EB1 is very small and quite insignificant (S.E. = 0.1535), so in our next trial we omit it and get a new log likelihood of 22.55, the same as before; the new parameter values are quite similar to those above:
 \begin{equation*}EQ = 2.108208;\ EY = -0.357198;\ EB2 = -0.504656;\ EM = 0.008149;\ ES = 0.161753.\end{equation*}
The improvement in log likelihood is 5.13 for one parameter, which is good, and the value of EB2 is very significant ( $\text{S.E.} = 0.1300$) so it is worth keeping this model for the time being. We call the model for Earnings without EB2 “E1” and the model with EB2 “E2”. But we remind ourselves that significance in all this fitting depends on the normality of the residuals, and we calculate the log likelihood on the basis of normality. We might get different answers if we assumed a fatter-tailed distribution, but that is beyond the scope of this paper. We are aware of this serious problem in the whole of our model, where many variables have fatter-tailed residuals; we are actively investigating this and intend to present our findings in future papers in this series.
3.7 Cover is defined as the ratio of the Earnings Index to the Dividend Index, V(t),  ${VL}({t}) = \ln({V}({t}))$,
 ${VML}= \ln({VM})$. Our model from Part 4 is:
 \begin{align*}VN({t}) & = {VA}.{VN}({t}-1) + {VE}1.{EE}(t) + {VE}2.{EE}({t}-1) + {VY}1.{YE}({t}) + {VY}2.{YE}({t}-1) + {VS}.{VZ}({t})\\{VL}({t}) & = {VML} + {VW}.{I}({t}) + {VN}({t})
\end{align*}
This elaborate model includes EE(t) and  ${EE}({t}{-}1)$, and the values of these are different in the two Earnings models, and we call the resulting models for Cover, “V1” and “V2”.
We start with V1, in which we use the residuals from E1. Fitting from 1963 to 2018 we get a log likelihood of 75.2, with parameter values:
 \begin{align*}VA ={} & 0.920230;\ VE1 = 0.876203;\ VE2 = -0.072063;\ VY1 = -0.123775;\ VY2 = -0.234595;\\ & VW = 1.702445;\ VM = 1.655723;\ VS = 0.061479.\end{align*}
These are different from those found in 2016, but not hugely so. However, the log likelihood is 9.14 bigger, a very significant improvement.
With V2, using the residuals from E2 we get a log likelihood of 56.11, with parameter values:
 \begin{align*}VA ={} & 0.723960;\ VE1 = 0.807971;\ VE2 = 0.078191;\ VY1 = -0.139468;\ VY2= -0.181683;\\ & VW = 1.153817;\ VM = 1.695593;\ VS = 0.088548.\end{align*}
This has a much worse log likelihood (20.62 worse), rather different parameters and a bigger value of VS. So for Cover the model V1 is better, and in combination with the Earnings model, the total log likelihood is much worse. This inclines us strongly towards E1 and V1.
3.8 We can derive the P/E Ratio from Dividend Yield and Cover (the product of the three is unity), but we can instead model it directly without reference to either Y(t) or V(t). We denote it as M(t), for “multiple”, and have  ${ML}({t}) = \ln({M}({t}))$,
 ${MML}= \ln({MM})$, and a model
 \begin{align*}MN(t) & = MA.MN(t-1) + ME1.EE(t) + ME2.EE(t-1) + MS.MZ(t)\\ ML(t) & = MML + MW.I(t) + MN(t)\end{align*}
This is a simpler model than for Cover, V, but it also includes EE(t) and  ${EE}({t}{-}1)$, so again we need two models, which we call “M1” and “M2”.
We start with M1, optimising up to 2018, and we get log likelihood of 20.35, with parameter values:
 \begin{align*}MW & = -2.839668;\ ME1 = -0.871112;\ ME2 = 0.065955;\ MA = 0.720612;\ MM = 16.334475;\\ &\quad MS = 0.168232.\end{align*}
These are different from those for 2016, but also not hugely so. But the log likelihood using the 2016 parameters is 16.48, so the new parameters improve it by 3.87.
With M2 we get a log likelihood of 20.78, 0.43 better. with parameter values:
 \begin{align*}MW & = -2.462687;\ ME1 = -0.943416;\ ME2 = -0.058085;\ MA = 0.63586;\ MM = 15.892657;\\ &\quad MS = 0.166911.\end{align*}
This has a very slightly better log likelihood, with fairly similar parameters to those in M1. Modelling M directly avoids needing a model for V, so we can ignore the large deterioration in log likelihood for V. Allowing for the improvement in log likelihood for E, and the very modest improvement for M, the model with E2 and M2 is rather better. Note that the value of ME2 in both cases is small, much less than the standard error, so could be omitted. This was not the case in 2016.
4. Comparisons between the models
4.1 We have now a multiplicity of models. Our primary interest is in the Dividend Index, D, and the Share Price Index, P. All the other items are additional information, not ends in themselves. We can calculate forecast or simulated values of D and P in three different ways, but we shall first postulate a null hypothesis, H0, where the Share Price Index, P, is modelled as a simple random walk.
4.2 We put  ${PL}(t) = \ln({P}({t}))$, and
 ${PLD}({t}) = {PL}({t}) - {PL}({t}{-}1)$. We then put:
 \begin{equation*} {PLD}({t}) = {PM} + {PS}.{PZ}({t})
\end{equation*}
For the period from 1923 to 2018 we get  ${PM} = 0.054884$,
 ${PS} = 0.176511$, and for the period from 1963 to 2018 we get
 ${PM} = 0.070038$,
 ${PS} = 0.167866$, If we start at
 ${t} = 0$, with P(0) known, we get: E[
 ${PL}({t})]={PL}(0)= {t}$.PM and Var[
 ${PL}({t})] = {t}.{PS}{}^{2}$. This does not give us D(t), unless we model also Y(t), but we do not go down this road here.
4.3 Our three methods of getting P(t) and D(t) are described below. In each case we assume that we include Q(t) and Y(t) first.
(H1) Model D(t) directly, as with the original model, and then
 ${P}({t}) = {D}({t}) / {Y}({t})$, or ${PL}({t})={DL}({t}) - {YL}({t})$
(H2) Model E(t) and V(t) with any of our models, and put
${D}({t}) ={E}({t}) / {V}(t)$ or ${DL}({t}) = {EL}({t}) - {VL}(t)$, then ${PL}({t}) = {DL}({t}) - {YL}({t})$(H3) Model E(t) and M(t) directly with any of our models and put
${P}({t}) = {E}({t}).{M}({t})$ or ${PL}({t}) = {EL}({t}) + {ML}({t})$ and ${DL}({t}) ={PL}({t}) + {YL}({t})$


With Model H0 we use only share prices and ignore dividends and earnings. With Model H1 we use dividends but not earnings, and with Model H3 we use earnings, but not dividends. With Model H2, we use both dividends and earnings. One could argue that with Model H2 we use more information, so it is bound to be better. However, we can see from Figure 1 that the Earnings Index is much more unstable than Dividends and rather more so than Prices. The numbers back this up. So possibly an unstable Earnings model detracts from accurate forecasting rather than adding to it. However, with all our modelling we are not only interested in getting good future mean forecasts, but also good future estimates of variability.
4.4 We investigate this in two ways. First, we calculate the expected values and variances of the different variables for k years ahead ( ${k}= 1 \text{to} {K}$), using the fitted models, with Initial Conditions as at June 2018. Secondly, we go through the past data, taking each year in turn, and forecasting the expected value, using the fitted models, but with Initial Conditions as at each past June date and going k years ahead (
 ${k} = 1 \text{to} {K}$). We then compare the forecast value with the future actual value, as far as there are years of data available. We calculate the differences between forecast and actual values, and for each value of k we calculate the “root mean square” (RMS), the square root of the average squared difference. This is “in-sample” testing , not revising the parameters at each stage.
4.5 We restrict our results to the share price index, P(t), or rather to its logarithm, PL(t), since, assuming that all the innovations are normally distributed, so also is PL(t). We calculate, using the laborious formulae in Part 2 (Wilkie and Şahin, Reference Wilkie and Şahin2016) , Appendix A, and in Part 4 (Wilkie & Şahin, Reference Wilkie and Şahin2018), Appendix A, the expected value, variance and standard deviation of PL( $2018 + {k}$) conditional on
 $\mathcal{F}_{2018}$, all that is known as at June 2018, and we denote them PLE(k), PLV(k) and PLSD(k). Then for each year t between 1923 (or 1963, depending on the model used) and 2017, we calculate the expected value of PL(t, k) conditional on
 $\mathcal{F}_{t}$, all that is known in June of year t. We call this PLH(t, k) (H for “hat” or expected value). Then for each year where we have data, we calculate EPL(t,
 ${k}) = {PL}({t} + {k}) -{PLH}({t}$, k), i.e. the error between the actual outcome in year
 ${t} + {k}$ and the expected value as at year t. We square the values of EPL(t, k) and for each value of k we sum the squares, divide by the number of available observations,
 ${n{}_{k}}$, and take the square root, giving the “root mean square” of the errors,. We call this RMS(k). Thus
 \begin{equation*} RMS(k) = \surd \{\Sigma({PL}(t + k) - PLH(t, k))^{2} / {n_{k}}\} \end{equation*}
4.6 For the data starting in 1923, we have 96 years of observations to 2018. But if we go ahead k years from each starting year, we have only  ${n{}_{k}} = 96 - {k}$ available end years. For this data we let k go up to
 ${K} = 50$, thus a little more than half. For the data starting in 1963, we have 56 years of data, so we let k go up to 30, also a little over half. But it will be observed that our values of EPL(t, k) are by no means independent. For
 ${k} = 1$, the one step ahead forecast, we do have independent observations, but for
 ${k} = 2$, each observation shares a year with its neighbours on each side, and as k increases there are more overlaps. When we reach
 ${k} = 50$ (or 30), we have half a dozen years in the middle that appear in every value of EPL(t, k). If we wished to use only independent observations, with no overlap, we would have fewer and fewer available. We do not claim that our calculations provide strong evidence, but they do give some slight evidence, and are the best we can do.
4.7 We treat our periods separately, 1923 to 2018 and 1963 to 2018, using the fitted models for each throughout. We have two versions for 1963 to 2018, using Earnings Model E1 and Earnings Model E2. We have four ways of modelling PL for the later period, but only two of these (H0 and H1) are available for the earlier period. We compare PLSD(k) and RMS(k) for each model within each period and version.
4.8 In Figure 3 we show results for 1923 to 2018, with H0 and H1. The standard deviations PLSD(k) are shown with solid lines. That for H0 is in black, for H1 in red. The values of RMS(k) are shown with dots, of the same colours. The black line for H0, the random walk model, increases as the square root of k. The red line is quite a bit lower, showing that the model with dividends and dividend yield should give much lower variation of the values of PL in the future. They are almost the same for  ${k} = 1$, showing that there is nearly no difference over the first year.
4.9 The black dots for RMS(k) are lower than the black line, and the red dots generally lower than the red line, and for large k the values shown by the dots are about the same. We have already explained the serious lack of independence in the calculations of RMS(k), and we do not lay much significance in these ‘in sample’ results. But they are of the same order of size as the theoretical standard deviations.
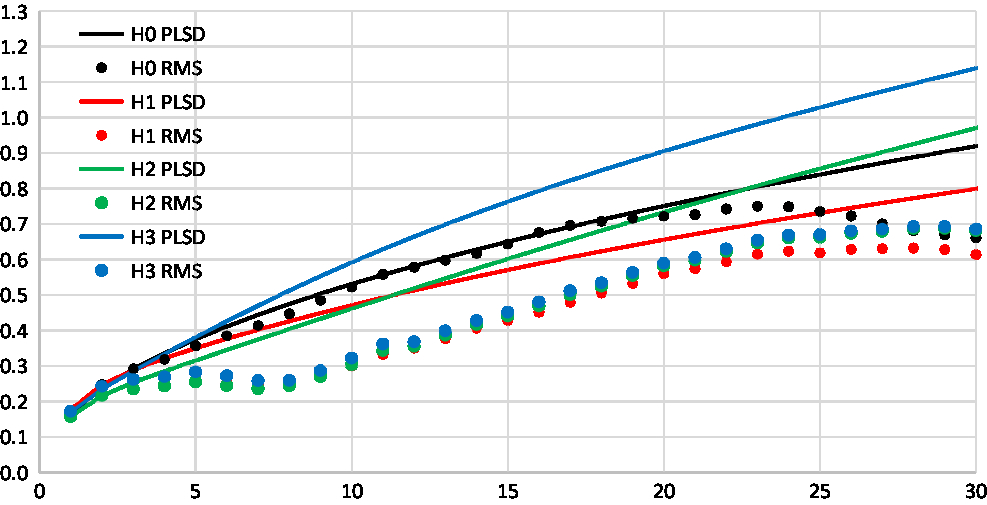
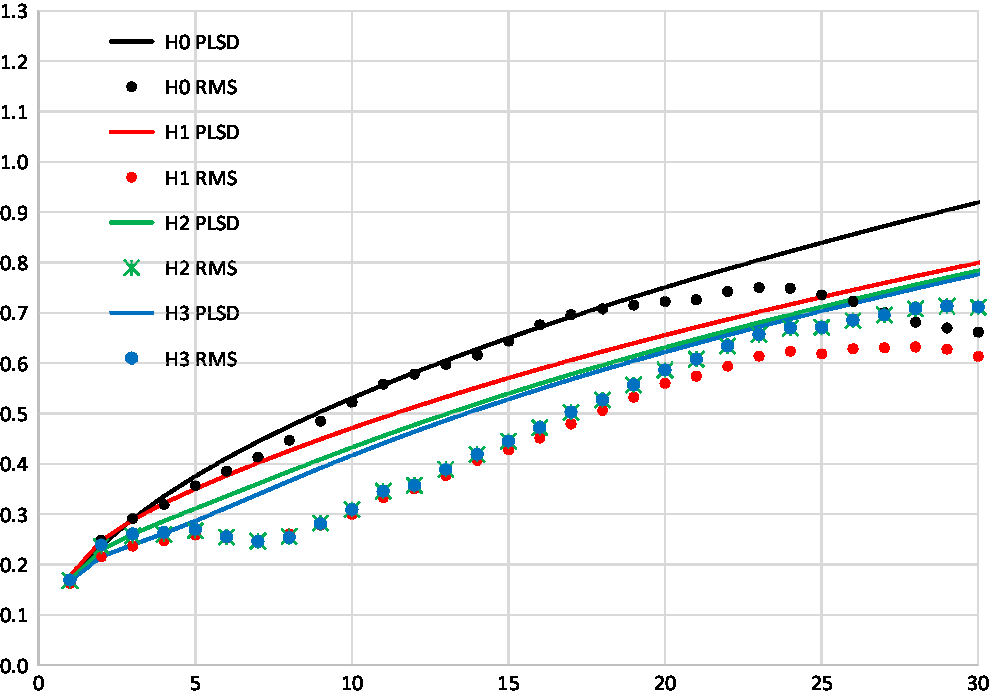
4.10 In Figure 4 we show results for 1963 to 2018, with all four hypotheses, using Models E1,V1 and M1. We use black and red again for H0 and H1, then green for H2 and blue for H3. The black and red lines and dots are fairly close in value to those in Figure 1, but they look rather different because the horizontal axis is restricted to  ${k} = 30$ years.
4.11 The blue line for H3 is much the highest, which suggests that using Earnings and P/E ratios is a poor way of forecasting share prices. But for short terms the green line for H2 is a little below the red one, suggesting that modelling Earnings as well as Dividends does add some value. However, beyond  ${k} = 12$, the green line rises, even going above the black one, so perhaps Earnings are sufficiently unstable to detract in the long run. The dots, showing the in sample test values, are all lower than their corresponding lines, and the red, green and blue dots are in almost the same places.
Values of PLSD(k) and RMS(k), for  ${k} =1 \text{to} 30$, 1963 to 2108, Earnings model E1, models H0 to H3.

4.12 In Figure 5 we show the same results as in Figure 4, but using Models E2, V2 and M2. The results are very different. Now the blue line for H3 is the lowest all the way along, with the green one a little above it. Investigation shows that this is caused by the EB2 term in the earnings model. An innovation, EE, that enters the formula for L(t) passes through to EL(t). Two years later half of it is reversed, since our estimate of the value of EB2 is close to −0.5. This damps the longer term variance of E considerably. The values for the coloured dots are very close together, as before, and the green and blue values so close that we show the green points by a star, rather than a circle.
Values of PLSD(k) and RMS(k), for  ${k} =1 \text{to} 30$, 1963 to 2108, Earnings model E2, models H0 to H3.

4.13 This is not a nice result. Had we completed our investigations in 2015 we would have omitted the big reduction in earnings in 2016 and the recovery in 2017 and 2018, and we would have had no significant autocorrelation in the residuals of the Earnings model. We do not like such an extreme model based on really only one event. Further, the drop in earnings affected only a small number of very large companies, mainly in the oil and mining sectors. These companies are indeed greatly affected by fluctuations in the oil price and in the prices of other commodities, and a downturn in such prices might well precede a downturn in the whole world economy. But what we seem to have had is an almost artificial reduction in earnings, rapidly reversed. The fact that few companies cut dividends at that time (though some did) suggests that the directors of those companies were confident of a recovery. We would not like to base a whole model in such a single event.
5. Central Forecasts
5.1 We also consider the central forecasts, by which we mean the values obtained by putting all future innovations to zero. These are the mean values when we have a linear, normally distributed, model, but when we take exponentials, as in going from  ${DL}({t}) = \ln({D}({t})) \text{to} {D}({t})=\text{exp}({DL}({t}))$, the resulting distribution is lognormal, and the central forecast is not the mean. Starting as at June 2018 our different methods now give us different forecasts in the shorter term.
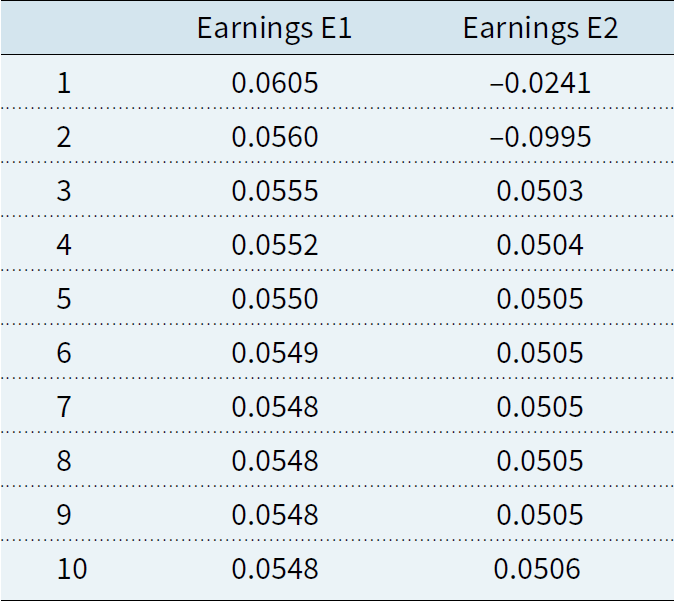
5.2 We start by showing in Table 1 the expected values of L(t), the annual change in Earnings, for the next 10 years from June 2018 on the basis of the alternative models for Earnings described in Section 3.3. We use all the parameters fitted above, including the estimate of QM of 0.042408, or an inflation rate of about  $4\nicefrac{1}{4}\%$. This seems high in present circumstances, and one might prefer a value of 0.025, or
 $2\nicefrac{1}{2}\%$, about
 $1\nicefrac{3}{4}\%$ lower. Using this value reduces all the forecast rates by about
 $1\nicefrac{3}{4}\%$ and one can keep this in mind. Using the simpler model, E1, there is a slightly above average rise in Earnings in 2019, of 0.0605, falling quickly to the long-term mean of about
 $5\nicefrac{1}{2}\%$.
5.3 Using E2 the one-year forecast falls to −0.0241. This is because there was a large residual of about 0.24 in 2017, and this is multiplied by the EB2 factor of about −0.5, reducing the expected value of L for 2019. The larger residual of about 0.75 in 2018 then affects the expected value for 2020 negatively too. It seems uncomfortable to us to build in such auto-regression, mainly on the basis of a single event, and this result confirms this view.
5.4 One must remember that the model knows nothing about current political and economic events, such as Brexit and President Trump’s economic policies, which might well cause a reduction in company earnings; but these have nothing to do with the auto-regression. One must remember also that the standard deviation, ES, is about 0.16, so there is a 95% range of about  $\pm30\%$, and the outturn might well be a long way away from the forecast mean.
Central forecast values of L(t), increase in E(t), using different models for Earnings

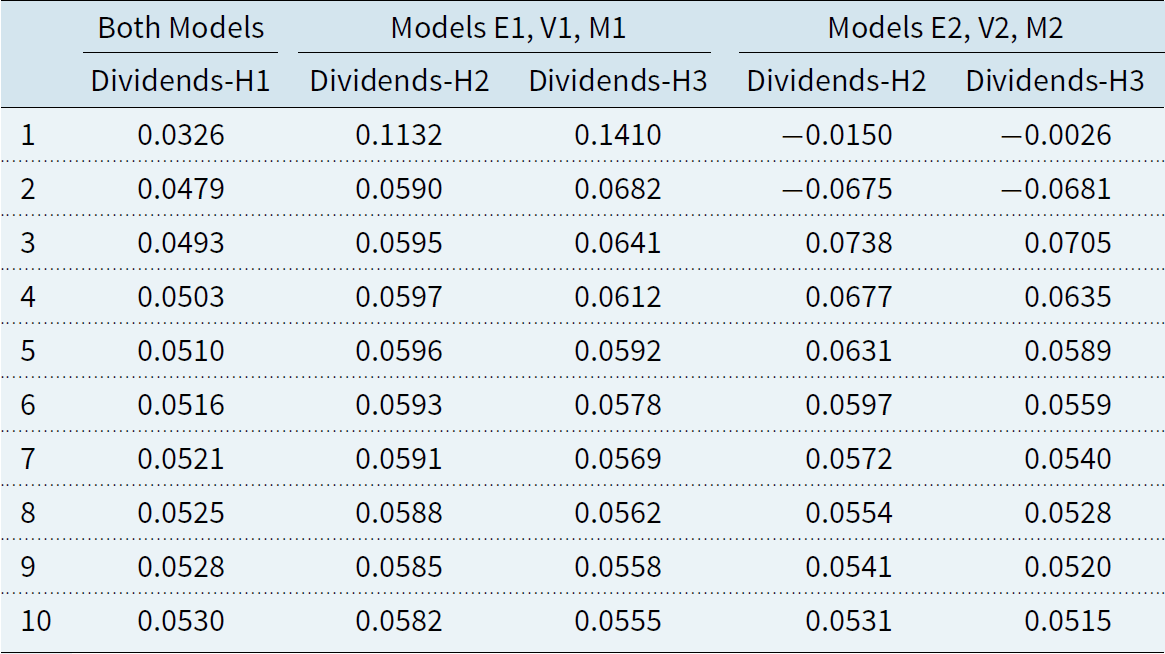
5.5 In Table 2 we show forecasts values for K(t), the annual increase in the Dividend Index, D(t), first using models E1 and V1 for Earnings and Cover and then models E2 and V2. In each case we use the three versions for calculating D(t) described in section 4.3. Method H1 models Dividends without reference to Earnings, so it is the same in each version for E. It can be seen that there is a noticeable difference in the models. Method H1 shows a modest increase of 0.0326, creeping up towards a longer term value of 0.0530. Method H2, using E1 and V1 for Earnings and Cover, gives a much larger increase, of 0.1132; the rationale for this is that the high value of Earnings in June 2018, with an above-average value for Cover, of 2.02, allows a possible increase in Dividends in 2019. Method H3 using Earnings and P/E ratios to get Prices than backing out Dividends through the Dividend Yield, Y(t), gives a yet higher value of 0.1410; in June 2018 the P/E ratio was 13.57, lower than the average, so there is some opportunity for the Multiple to rise and thus give an increase in Prices.
Central forecast values of K(t), increase in D(t), using different models for Earnings, and different models for calculating Dividends and Prices

5.6 Using V2 for Earnings gives negative forecast values for K(t) in the first two years, consequentially on the negative values for L(t) shown in Table 1, but the variations here are smaller. Remember again that the standard deviation of K(t) on any model is around 0.06 or 0.07, less than for L(t), but still large enough for the actual outturn to be quite a bit away from these central values.
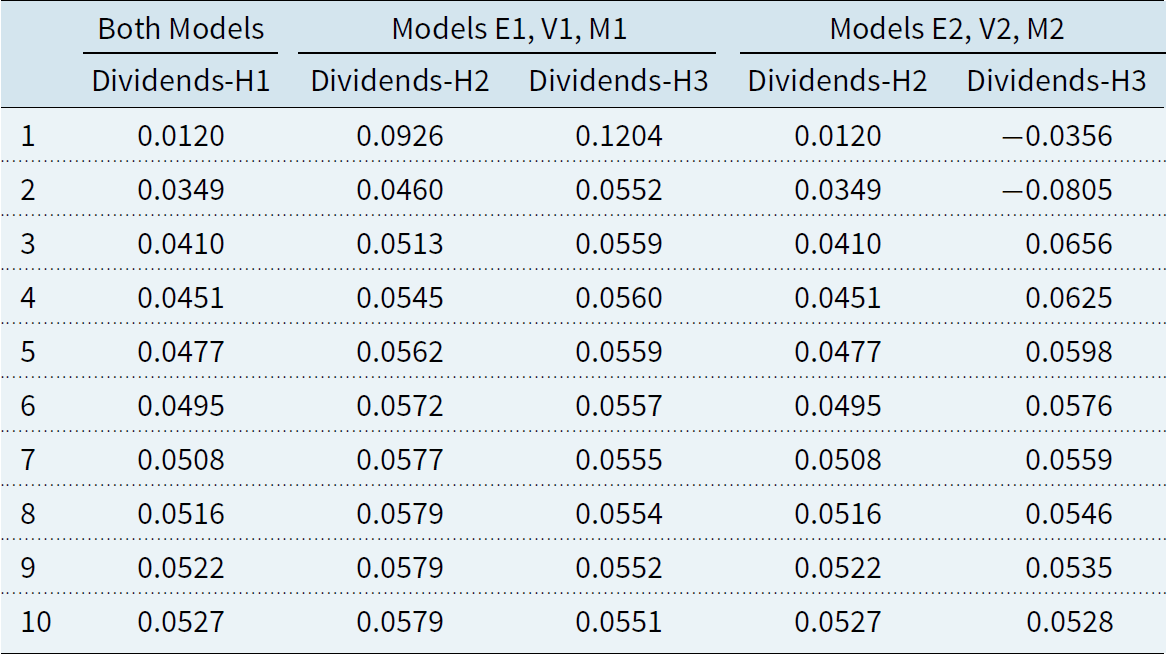
5.7 In Table 3 we show comparable values for the increase in P(t), the share prices in the next 10 years. Since the Prices index is related to the Dividend Index through the Yield, Y(t), which has the same model throughout, the values here follow the pattern of those in Table 2 in the same way in each column. The value of Y(t) in 2018 was slightly below the average level, so the forecast is for a small rise in Yield, so that prices rise a little more slowly than Dividends.
Central forecast values of increase in P(t), using different models for Earnings, and different models for calculating Dividends and Prices

5.8 These results suggest that it is reasonable to prefer the method that uses more information, so method H2, using information about both Earnings and Dividends may be felt best. As we show in section 4 it is also the method that gives the lower standard errors of the forecasts in the first few years.
6. Conclusions
6.1 Because of the very large changes in Earnings over the years 2015 to 2018, we have investigated new models for Earnings, Cover and P/E Ratios. We get rather different values for the parameters of our earlier models, and also introduce a possible new model for Earnings with an autoregressive term in the residual. We also investigate different models for forecasting Dividends and Prices. Share Earnings do not enter the cash flows of investors, whereas Dividends and Prices do, so it is not necessary to use Earnings unless they improve the forecasts for the other items. We have shown that knowledge of Earnings does help a little, not a lot. We prefer the simpler model for Earnings, without autoregression, since that is based on only one event. Investigation of the very fat-tailed distribution of Earnings is postponed to a later paper in this series. We rather prefer the model for forecasting that derives Dividends from Earnings and Cover, but others may reasonably prefer one of the other methods we describe.
6.2 However, this investigation raises deeper questions. The recent very large changes in Earnings made a further investigation worth while. But if just one event occurs which is outside the usual pattern of a variable, it is not easy to decide whether one should:
(i) change the parameter values,
(ii) change the structure of the model,
(iii) change the distribution of the residuals (which we intend to consider in a future paper), (iv) introduce an ad hoc intervention variable (as we did with the model for Base Rate, B(t), after the big drop in 2009),
or even (v) consider that a new regime has started which would require a quite different model (as happened with exchange rates when the post-World-War II Bretton-Woods system was replaced in the early 1970s with floating exchange rates).
6.3 If supervisors are expecting companies or their actuaries to allow for an estimate of a 1-in-200 event, and there is only one series involved (so no spreading of risk), can anyone estimate that plausibly without perhaps 400 years of data from a constant regime (on the ad hoc statistical rule that to forecast n years ahead, one should have 2n years of past data); this is an almost impossible requirement with any economic series.