INTRODUCTION
The sustainability of multispecies coral reef fisheries is a key conservation concern given their economic and ecological importance, the significant dependence of subsistence and artisanal fishers on reef fisheries for their livelihoods, and the considerable and growing threats to coral reef habitats (i.e. coral bleaching and disease, pollution and climate change). Sustainability refers to the ability of an exploited stock to produce goods and services, including yields at suitable levels in the short term, while maintaining sufficient stock reproductive capacity to continue providing these goods and services into the indefinite future (Walters & Martell Reference Walters and Martell2004). Intensive exploitation and overfishing is perhaps the major threat to these ecosystems (Russ Reference Russ and Sale1991; Haedrich & Barnes Reference Haedrich and Barnes1997; Ault et al. Reference Ault, Bohnsack and Meester1998, Reference Ault, Bohnsack, Smith and Luo2005a). However, insufficient and poor quality data and lack of an appropriate modelling framework have prevented sophisticated evaluations of the sustainability of reef fisheries. Generally lacking are the data needed to conduct modern stock assessments, including demographic rates and historical time-series of age-size structured catches by species, and the associated fishing effort by gear and sector (Quinn & Deriso Reference Quinn and Deriso1999; Haddon Reference Haddon2001; Quinn Reference Quinn2003).
The coral reef fisheries of the Puerto Rico archipelago are a case in point. The reef ecosystem, inhabited by hundreds of reef fishes and macroinvertebrates, supports multimillion-dollar fishing and tourism industries (NOAA [National Oceanic and Atmospheric Administration] 2006). The reef fishery focuses on the ‘snapper-grouper’ complex consisting of > 50 species of mostly groupers (Serranidae) and snappers (Lutjanidae), but also grunts (Haemulidae), wrasses (Labridae), jacks (Carangidae), porgies (Sparidae), parrotfishes (Scaridae) and triggerfishes (Balistidae), which use a range of inshore to offshore habitats and oceanographic features over their life spans (Appeldoorn et al. Reference Appeldoorn, Recksiek, Hill, Pagan and Dennis1997, Reference Appeldoorn, Friedlander, Sladek Nowlis, Ussegilo and Mitchell-Chui2003; Ault et al. Reference Ault, Bohnsack, Smith and Luo2005a; Monaco et al. Reference Monaco, Kendall, Higgins, Alexander, Tartt, Wright and Scholz2005; Pittman et al. Reference Pittman, Christensen, Caldow, Menza and Monaco2007). The latest fishery census reported 1163 commercial fishers, 200 000 resident and 40 000 non-resident recreational fishers, and a total of 60 000 registered boats (Matos-Caraballo Reference Matos-Caraballo2004). Between 2001 and 2003, reef-associated fisheries accounted for > 91% of the total commercial landings in Puerto Rico, capturing an average of 1393 t of reef fish and shellfish per year (Garcia-Sais et al. Reference Garcia-Sais, Appeldoorn, Bruckner, Caldow, Christensen, Lilyestrom, Monaco, Sabater, Williams and Diaz2005). Between 2000 and 2002, total recreational catches ranged from 1089 to 2087 t (Lilystrom & Hoffmaster Reference Lilystrom and Hoffmaster2002). While the quality and scope of reef fishery catch-effort data have generally improved over the past two decades for the commercial fleet, comparable data from the recreational fleet are not available prior to 2000. Also important are the exports of > 100 species of reef fishes and > 110 species of invertebrates for the aquarium trade that began in the early 1970s, but these are poorly quantified. A concern is that substantial reductions in commercial reef fish catches over the past several decades have been observed (Appeldoorn et al. Reference Appeldoorn, Beets, Bohnsack, Bolden, Matos, Meyers, Rosario, Sadovy and Tobias1992; Matos-Caraballo Reference Matos-Caraballo2004; Garcia-Sais et al. Reference Garcia-Sais, Appeldoorn, Bruckner, Caldow, Christensen, Lilyestrom, Monaco, Sabater, Williams and Diaz2005; see also Caribbean Fishery Management Council URL http://www.caribbeanfmc.com) that have resulted in harvest moratoria on several species (for example Nassau grouper, Epinephelus striatus, and goliath grouper, Epinephelus itajara), but the status of sustainability for these important multispecies fisheries is unclear.
The most recent assessment for any reef species in Puerto Rico (Acosta & Appeldoorn Reference Acosta and Appeldoorn1992) attempted to maximize proximal fishery yields without clear consideration of risks to stock reproductive potential or longer-term sustainability, an approach common to that era. However, over the past decade, requirements for fishery assessment and management in the USA have moved towards a more precautionary approach that strives to ‘prevent overfishing while achieving, on a continuing basis, the optimal yield from each fishery for the United States fishing industry’ (MSFCMA [Magnuson-Stevens Fishery Conservation and Management Act], Restrepo et al. Reference Restrepo, Thompson, Mace, Gabriel, Low, MacCall, Methot, Powers, Taylor, Wade and Witzig1998). Under this legal framework, determination of the sustainability of a fishery must also consider relevant socioeconomic and ecological factors, particularly whether fishing could deleteriously impact the reproductive capacity of the resource. This new process involves regulation of fishing mortality rate, over which management has some direct control, and how it should change depending upon stock reproductive potential and associated fishery yields (Restrepo & Powers Reference Restrepo and Powers1999; Fenichel et al. Reference Fenichel, Tsao, Jones and Hickling2008). The data limited situations confronting most coral reef fisheries, including those of Puerto Rico, have hampered application of modern stock assessment techniques that meet the legal mandate of the MSFCMA.
In this paper we employ length-based assessment methods developed for Florida reef fishes (Ault et al. Reference Ault, Bohnsack and Meester1998, Reference Ault, Bohnsack, Smith and Luo2005a, Reference Ault, Smith and Bohnsackb) to quantify the reef-fish community response to exploitation in Puerto Rico. This approach is novel in that it has relatively simple data requirements and provides a community-level perspective on exploitation effects, yet also enables evaluation of stock-specific sustainability that conforms to the legal requirements of the MSFCMA. The principal data used in the assessment were abundance at size for 25 species from the exploited snapper-grouper complex sampled by both fishery-independent and fishery-dependent surveys. The objectives of these analyses were to: (1) estimate stock mortality rates from the length composition data; (2) use the estimated mortality rates and other population-dynamic parameters in a length-structured population model to compute sustainability reference points (benchmarks) for the exploited reef fish community in Puerto Rico; and (3) as a first step in the fishery management process, evaluate the species-specific benchmarks with respect to resource sustainability standards in an exploited fish community context.
METHODS
Study area
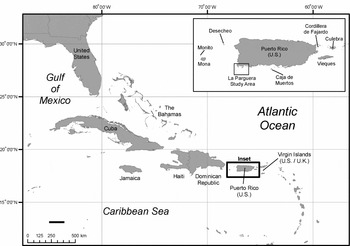
The island archipelago of Puerto Rico (18° N, 67.0° W), located in the Greater Antilles chain of islands in the northern Caribbean Sea, has an area of 8.93 × 10⁶ km2, including the main island, and Mona, Monito, Desecheo, Caja de Muertos, Vieques and Culebra Islands, and a series of cays known as Cordillera de Fajardo (Fig. 1).
Map of the northern Caribbean Sea, with inset showing the island archipelago of Puerto Rico and the La Parguera region.

Mortality estimation
Indicators are needed to assess reef fisheries and to support the implementation of an ecosystem approach to fisheries (Jennings Reference Jennings2005; Cury & Christensen Reference Cury and Christensen2005). The principal stock assessment indicator variable we used to quantify population status for the community of Puerto Rican reef fishes was average length (L) of the exploited part of the population, which is a metabolic-based indicator that is highly correlated with population size (Beverton & Holt Reference Beverton and Holt1957; Ricker Reference Ricker1963; Pauly & Morgan Reference Pauly and Morgan1987; Ehrhardt & Ault Reference Ehrhardt and Ault1992; Kerr & Dickie Reference Kerr and Dickie2001; Jennings et al. Reference Jennings, De Oliveira and Warr2007). For exploited species, L directly reflects the rate of fishing mortality through alterations of the population size structure (Beverton & Holt Reference Beverton and Holt1957; Quinn & Deriso Reference Quinn and Deriso1999). Theoretically, L at time t is expressed as

where ac is the minimum age at first capture, a λ the oldest age in the stock, N(a, t) the abundance for age class a, L(a, t) the length at age a and F(t) is the instantaneous fishing mortality rate at time t. In practice, L is usually estimated from lengths in the range of length at first capture Lc (or recruitment to the exploited phase of the stock) to the maximum observed length L λ, the length of a fish at a λ. F(t) could also be the viewing power of divers in fishery-independent visual surveys of reef fish populations (Ault et al. Reference Ault, Bohnsack and Meester1998).
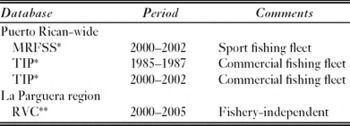
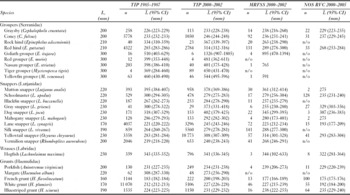
Fishery-dependent length composition data were obtained from Puerto Rico-wide sampling of commercial and recreational catches, whereas fishery-independent data were from visual surveys conducted in the La Parguera region (Fig. 1). Length composition data (Table 1) for the species considered were used to estimate mean lengths and corresponding variances between lower Lc and upper L λ bounds, applying standard statistical procedures and lower bound estimates of Lc (Table 2). The commercial gears included hook-and-line, fish traps, beach seines, gill nets, trammel nets, cast nets and lobster pots. Recreational fishers principally used hook-and-line and SCUBA gears (Garcia-Sais et al. Reference Garcia-Sais, Appeldoorn, Bruckner, Caldow, Christensen, Lilyestrom, Monaco, Sabater, Williams and Diaz2005). We set Lc to correspond to the lower bound of full exploitation for the range of gears used. Non-normality of length observations was corrected by log-transformation to facilitate estimation of L.
Sources of fishery-dependent and fishery-independent length composition data used to estimate mean average length in the exploited phase for Puerto Rican reef fishes (MRFSS = Marine Recreational Fisheries Statistics Survey; TIP = Trip Interview Programme; RVC = National Ocean Service (NOS) Biogeography, Reef-fish Visual Census). Sources: *NOAA Fisheries (URL http://www.sefsc.noaa.gov/), MRFSS (URL http://www.nmfs.noaa.gov/sfa/PartnershipsCommunications/recfish/recfishing.htm), TIP (URL http://www.sefsc.noaa.gov/tip.jsp), NOAA Fisheries of the United States (URL http://www.st.nmfs.noaa.gov/st1/fus/fus06/index.html); **NOAA NOS Biogeography Branch reef fish database (URL http://ccma.nos.noaa.gov/about/biogeography/).

Average size, L, and 95% confidence interval (CI) estimates for 25 exploited reef fishes in Puerto Rico. Data sources are identified in Table 1. Lc is the minimum size of first capture (full selection) observed in the fishery-dependent data. The sample size n for each L calculation is given. n/o = species not observed in a sampling survey.

Using estimates of L in time t, total instantaneous mortality rate Ž(t) was estimated using the method of Ehrhardt and Ault (Reference Ehrhardt and Ault1992)

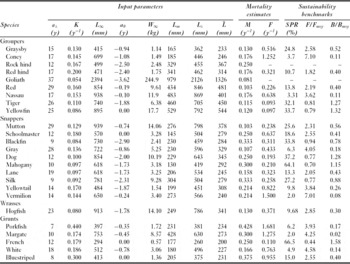
where K and L ∞ are parameters of the von Bertalanffy growth equation. Estimates of Z were computed using an iterative numerical algorithm (computer program LBAR; Ault et al. Reference Ault, McGarvey, Rothschild, Chavarria, Gallucci, Saila, Gustafson and Rothschild1996; FAO [Food and Agriculture Organization of the United Nations] Reference Gayanilo, Sparre and Pauly2003). Life history parameters for maximum age, growth and maturity for the reef fish species considered (Table 3) were obtained from the literature syntheses of Ault et al. (Reference Ault, Bohnsack and Meester1998, Reference Ault, Bohnsack, Smith and Luo2005b) and Claro et al. (Reference Claro, Lindeman and Parenti2001).
Life-history trait input parameters from literature syntheses of Ault et al. (Reference Ault, Bohnsack and Meester1998, Reference Ault, Bohnsack, Smith and Luo2005b) and Claro et al. (Reference Claro, Lindeman and Parenti2001), and resulting population mortality and sustainability benchmarks estimated from numerical models for exploited Puerto Rican reef fishes (see text for description of parameter estimation methods and symbols used).

Numerical population model
We used a stochastic length-based numerical population model (Ault & Olson Reference Ault and Olson1996; Ault et al. Reference Ault, Bohnsack and Meester1998) to calculate ensemble numbers at given lengths Ñ γ over time for a given cohort γ, generalized as

where R γ(τ − a) is cohort recruitment lagged back to birth date, S(a) is survivorship to age a, θ(a) is a logistic model of sex ratio at age to account for hermaphroditic life histories common to tropical reef fishes, and P(L/a) is the probability of being length L given the fish is age a. This population model simulates the time-transition of recruits to mature adults to maximum size-age using a number of dynamic functions to regulate population birth, growth, and survivorship processes, including fishery harvests (details in Ault et al. Reference Ault, Bohnsack and Meester1998).
We calibrated the numerical model (Eq. 3) through a consistency check between model estimates of L, using Ž from Eq. (2) as the input, and the  estimated from data. Additionally, we evaluated the two major components of Z, namely fishing mortality rate F and natural mortality rate M. In this process, we estimated M from lifespan applying the procedure of Alagaraja (Reference Alagaraja1984; sensu Hoenig Reference Hoenig1983) assuming that 5% of a cohort survives to the maximum age/size, and F was estimated by subtracting M from Z (Ault et al. Reference Ault, Bohnsack and Meester1998). We used the calibrated model to compute management benchmarks of stock status to evaluate sustainability in the following analytical process.
Sustainability analyses
Sustainability analyses involved comparison of various population metrics at current levels of fishing mortality against standard fishery management sustainability benchmarks. We configured the simulation model to assess several reference points to address several sustainability risks, including fishery yields, spawning potential ratio (SPR; Clark Reference Clark1991) and precautionary control rules (for example Restrepo & Powers Reference Restrepo and Powers1999). Since population biomass B(a, t) is the product of numbers-at-age times weight-at-age W(a, t), yield in weight Yw from a species during an instant t was calculated as

We obtained an important measure of stock reproductive potential, spawning stock biomass (SSB) at a given level of fishing mortality, by integrating over individuals in the population between the size of sexual maturity (Lm; 50% maturity, assumed knife-edged) and the maximum size (L λ)

Maximum spawning biomass is obtained under conditions of no fishing mortality. Spawning potential ratio (SPR) is a management benchmark that measures a stock's potential to produce yields on a sustainable basis, and is computed as the ratio of current SSB(t) relative to that of an unexploited stock.

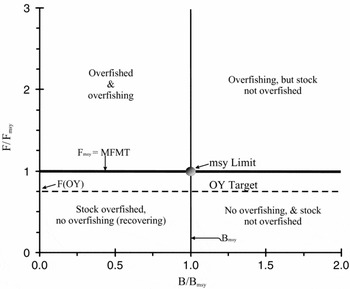
Estimated SPRs were compared to USA Federal standards which define 30% SPR as the threshold below which a stock is no longer sustainable at current exploitation levels (see Gabriel et al. Reference Gabriel, Sissenwine and Overholtz1989; Restrepo et al. Reference Restrepo, Thompson, Mace, Gabriel, Low, MacCall, Methot, Powers, Taylor, Wade and Witzig1998). Evaluation of control rules involved determination of Fmsy (F generating maximum sustainable yield, MSY) and Bmsy (population biomass at MSY) (Fig. 2). We defined F = M as a proxy for Fmsy (Quinn & Deriso Reference Quinn and Deriso1999; Restrepo & Powers Reference Restrepo and Powers1999).
Conceptual diagram showing limit and target control rules. Target control rules specify desirable levels of fishing for sustainable stocks (for example F(OY) that produces optimal yield OY). Limit control rules define sustainability benchmarks or a cut-off above which there is an unacceptable risk of serious or irreversible harm to the resource and requires strong management intervention. If the maximum fishing mortality threshold (MFMT, equivalent to the F(MSY) limit in our analysis) is exceeded, then management actions in the form of reductions in F (or rebuilding plans) must be implemented to reverse the situation and move the stock to the lower right quadrant (B/Bmsy > 1 and F/Fmsy < 1). A more precautionary control rule, as suggested by Restrepo and Powers (Reference Restrepo and Powers1999), is to set the threshold MFMT ‘safely below’ the MSY limit (for example F(OY) = MFMT = 0.75 × F(MSY)).

RESULTS
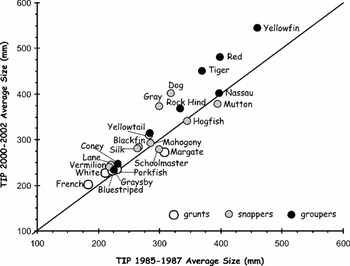
We estimated average size L (and 95% CI) in the exploitable phase by data source for 25 reef fish species (nine groupers, 10 snappers, one wrasse, and five grunts) (Table 2, Fig. 3). Estimates of L were generally similar among survey methods (fishery-dependent and fishery-independent) for the period 2000–2005. The exceptions occurred where sample sizes were relatively small or where sampling was restricted in geographic range. Many species showed a significant difference in L between years (1985–1987 and 2000–2002) using the trip interview programme (TIP) data (t-test, p < 0.05). Most species indicated increased mean length in recent years, suggesting that fishing mortality rates were probably higher in the 1980s. TIP data from 2000–2002 for the commercial fleet had the largest sample sizes and covered the greatest areal extent of the fishery; thus, these recent estimates of L were those principally used in the assessment analyses.
Comparison of L estimates between years 1985–1987 and 2000–2002 for NOAA Trip Interview Programme (TIP) commercial fishery data. The solid 45° line indicates no change between time periods.

For some species (i.e. rock hind, Epinephelus adscensionis, goliath grouper, red grouper, Epinephelus morio), it was difficult to obtain reliable mortality estimates due to relatively low sample sizes (Table 3). Estimates of F ranged from 0.093 (annual mortality rate, A = 18.8%) to 1.681 (A = 87.9%).
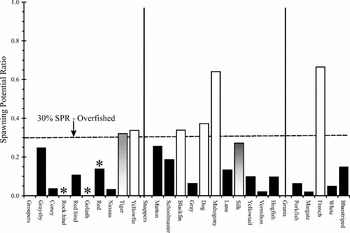
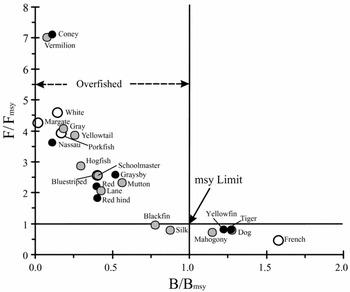
We used life history parameters and mortality rate estimates in the numerical population model to calculate sustainability benchmarks (Table 3). We estimated SPR for 25 species of Puerto Rican reef fishes (Fig. 4); many were below the 30% standard for sustainability. Values of the F/Fmsy ratio, B/Bmsy ratio, and SPR in recent years suggest that many (> 70%) of the species of the snapper–grouper complex in Puerto Rico are experiencing unsustainable rates of exploitation (F-ratio >1, B-ratio <1, SPR < 30%) (Fig. 5). Notable exceptions are the yellowfin grouper (Mycteroperca venenosa), several snapper species (dog, Lutjanus jocu, mahogany, Lutjanus mahogoni and blackfin, Lutjanus buccanella) and a small grunt (French, Haemulon flavolineatum).
Comparative spawning potential ratio (SPR) analysis for 25 exploited reef fish species from the Puerto Rican coral reef ecosystem for the period 2000–2002. Dark bars indicate overfished stocks, open bars indicate stocks that are above the 30% SPR standard, and shaded bars indicate that stocks are within ±3% of the SPR standard. Asterisks denote species with unreliable estimated rates of fishing mortality.

F/Fmsy ratio versus B/Bmsy ratio for the 25 species (groupers = dark circles, snappers = shaded circles and grunts = open circles) analysed for the years 2000–2002.

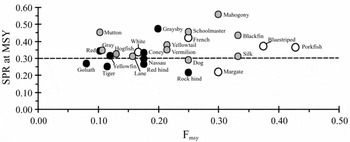
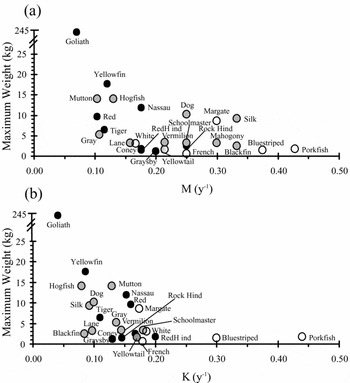
The plot of SPR at MSY dependent on Fmsy (Fig. 6) suggests that fishing the stocks at MSY results in a substantial reduction in spawning stock biomass, in some cases below the level considered appropriate for stock sustainability (i.e. 30% SPR). The MSY target appears to be especially problematic for fishes with relatively low M values (i.e. longer-lived species). In general, maximum size is inversely correlated with natural mortality (maximum age) and growth (Fig. 7). Fishes that are long-lived (low M) and relatively slow-growing (low K, Brody growth coefficient) would be expected to be most sensitive to exploitation rates and have the longest recovery times, a key consideration of management options to rebuild overfished stocks.
Estimated spawning potential ratio (SPR) at maximum sustainable yield (MSY) dependent on Fmsy for 25 exploited species (groupers = dark circles, snappers = shaded circles and grunts = open circles) from Puerto Rico. The horizontal dashed line is the 30% SPR USA federal standard for sustainability.

Relationships between maximum weight (kg) and (a) natural mortality rate M (y−1), and (b) Brody growth coefficient K (y−1) for 25 species (groupers = dark circles, snappers = shaded circles and grunts = open circles) of Puerto Rican coral reef fish.

DISCUSSION
The use of empirical data and models to assess Caribbean reef fisheries is relatively novel, and our analysis represents a first attempt to apply these assessment methods across the exploited reef fish community in Puerto Rico. We applied the average size method for estimating total mortality because it has relatively simple data requirements and has been shown to have relatively robust properties for assessing exploitation impacts on coral reef fishes (see Ehrhardt & Ault Reference Ehrhardt and Ault1992; Ault et al. Reference Ault, Bohnsack and Meester1998, Reference Ault, Bohnsack, Smith and Luo2005a, Reference Ault, Smith and Bohnsackb). Unique owing to its zero-bias properties at equilibrium (Ehrhardt & Ault Reference Ehrhardt and Ault1992; Quinn & Deriso Reference Quinn and Deriso1999), the method is also relatively insensitive to trends in recruitment and exhibits desirable properties for detecting statistical differences between sustainable and non-sustainable rates (Ault et al. Reference Ault, Smith and Bohnsack2005b). Despite the increase in mean length since the mid-1980s for many species, the estimated current levels of exploitation still exceed sustainable limits for many species in the Puerto Rican snapper-grouper reef fish complex (Fig. 5).
The validity of these results depends upon two principal assumptions. The first is that the length composition data used in the assessment are representative of the population abundance-at-size of the exploited phase of the species analysed. Although sample sizes were low in some cases, the general agreement in estimates of average size among three different data sources suggests that this assumption was met. One potential area for future study is cross-validation of these findings with other stock assessment approaches (such as Methot Reference Methot1990; Prager Reference Prager1994; Quinn & Deriso Reference Quinn and Deriso1999; Haddon Reference Haddon2001, Quinn Reference Quinn2003), but this will first require precise time-series of catch-and-effort data for all fleets. Data collection systems for fleet-wide catch-effort information have been in place since about 2000; thus sufficient time-series should be available for cross-validation studies in the near future. The second assumption is that the population dynamics data describing demographic rate processes for the various species are accurate. This assumption also applies to all age-structured assessment approaches. Part of the uncertainty in both length- and age-based assessments may thus be reconciled with better understanding of population lifetime growth, expected lifespans and reproductive maturity schedules.
There has been a burgeoning literature on the use of relatively simple methods and data to evaluate coral reef fisheries status. These approaches range from using life history heuristics as a guide to the vulnerability of different species to exploitation (Jennings et al. Reference Jennings, Reynolds and Mills1998, Reference Jennings, Reynolds and Polunin1999; Denney et al. Reference Denney, Jennings and Reynolds2002; Goodwin et al. Reference Goodwin, Grant, Perry, Dulvy and Reynolds2006), to more holistic evaluations of ecosystem effects of fishing on coral reef fish assemblages using, for example, abundance-biomass comparisons or analysis of size-spectra (Warren-Rhodes et al. Reference Warren-Rhodes, Sadovy and Cesar2003; Graham et al. Reference Graham, Dulvy, Jennings and Polunin2005; Yemane et al. Reference Yemane, Field and Leslie2005; Newton et al. Reference Newton, Cote, Pilling, Jennings and Dulvy2007). A key advantage of these simple population and aggregate community-based indicators is that they promote understanding of the ecological effects of exploitation and environmental disturbances on reef fish communities. However, the principal limitation of these methods is that they do not produce the specific metrics that satisfy the legal requirements for determining sustainability of fisheries under USA jurisdiction.
From a management perspective, another line of future research will be to explore viable regulatory options for reducing fishing mortality rates and rebuilding spawning stocks to sustainable levels. Our results provide some insights to guide these investigations. A characteristic of coral reef fisheries is that nominal fishing effort simultaneously targets multiple species because the principal gears (for example traps, hook-and-line and spears) are relatively non-selective and the species co-occur in similar habitats. As a result, capture probability for most species on any trip at any given location is greater than zero. Nominal fishing effort thus affects the snapper-grouper complex as a whole, but impacts individual species differently depending on their behaviour and life history characteristics (Fig. 5; Ault et al. Reference Ault, Bohnsack and Meester1998, Reference Ault, Bohnsack, Smith and Luo2005a, Reference Ault, Smith and Bohnsackb; Jennings et al. Reference Jennings, Reynolds and Polunin1999; Coleman et al. Reference Coleman, Koenig, Huntsman, Musick, Eklund, McGovern, Chapman, Sedberry and Grimes2000; Musick et al. Reference Musick, Harbin, Berkeley, Burgess, Eklund, Findley, Gilmore, Golden, Ha, Huntsman, McGovern, Parker, Poss, Sala, Schmidt, Sedberry, Weeks and Wright2000). Generally, large-bodied slow-growing late-maturing fishes are the most sensitive to exploitation (see Beverton & Holt Reference Beverton and Holt1957; Jennings et al. Reference Jennings, Reynolds and Mills1998; Goodwin et al. Reference Goodwin, Grant, Perry, Dulvy and Reynolds2006). The life history response to exploitation also depends on the particular size-age at which fishing mortality is applied. For many of the species we analysed, the minimum length subject to full exploitation (Lc, Table 2) was well below the length at which 50% of the stock reached sexual maturity (Lm, Table 3), irrespective of maximum age or length. This may explain in part why our results indicated that most of the longer-lived groupers and snappers, as well as many of the shorter-lived species, may be experiencing non-sustainable rates of fishing mortality. Future investigation should explore management options that lead to increases in Lc. Currently, only one species (yellowtail snapper) has a minimum size regulation in Puerto Rico.
Spatial distributions of the resource and the way in which the fleets interact with the resource may also play a role in the observed levels of exploitation. Some deepwater species with a wide range of lifespans, namely blackfin snapper (Lutjanus buccanella), silk snapper (Lutjanus vivanus), yellowfin grouper (Mycteroperca venenosa), and tiger grouper (Mycteroperca tigris), appear to be close to or above sustainability thresholds, and this may be owing to the buffering of effort provided by that refugia. Deepwater areas are typically more costly to exploit due to the greater distances from port and the need for larger vessels and specialized gears. Examinations of management options to build sustainable fisheries should consider a spatial context for controlling fishing effort.
Future studies on appropriate remedial measures to ensure long-term sustainability of the fishery ecosystem need to account for the expected transition times to meet these goals. According to theory, it may take close to a generation for the full effects of a change in exploitation rate to be manifested in a population (Beverton & Holt Reference Beverton and Holt1957; Quinn & Deriso Reference Quinn and Deriso1999). The MSFCMA requires that overfished stocks be rebuilt to sustainable levels in a short time, generally less than 10 years. Based on the range of life histories, population-dynamic strategies and expected transition times in the Puerto Rican reef fish community, potential recovery of spawning stock biomass to levels that are considered sustainable for many populations may take at least a decade to accomplish.
Another aspect of the life history response to exploitation concerns the limits of F and SSB that are considered acceptable according to USA standards. Our results showed that fishing a stock at the Fmsy limit may lead to spawning biomass levels below the limit of 30% SPR for many species (Fig. 6). Perhaps some fundamental research needs to be undertaken to identify precautionary limits other than Fmsy that produce optimal yields and prevent recruitment overfishing.
We conclude from our analyses that sustainable management of an exploited reef fish community may be better accomplished by setting precautionary target levels of fishing mortality less than Fmsy that ensure sustainability of those species most sensitive to exploitation effects (Russ & Alcala Reference Russ and Alcala1996; Jennings et al. Reference Jennings, Reynolds and Polunin1999; Denney et al. Reference Denney, Jennings and Reynolds2002; Goodwin et al. Reference Goodwin, Grant, Perry, Dulvy and Reynolds2006). For example, if reference points were established for the most sensitive individual components (for example species) of the ecosystem, the probability of overfishing other populations in the reef fish community would be minimized, and thus de facto serve the same purpose as establishing community- or ecosystem-level reference points (ICES [International Council for Exploration of the Seas] 2001, Hall & Mainprize Reference Hall and Mainprize2004; Cury & Christensen Reference Cury and Christensen2005; Garcia & Cochrane Reference Garcia and Cochrane2005).
ACKNOWLEDGEMENTS
We thank D.E. Harper of NOAA Fisheries Southeast Fisheries Science Center for assistance in obtaining fishery-dependent databases. This research was supported by the NOAA Caribbean Reef Ecosystem Study (CRES) Grant NA17OP2919, NOAA NOS Biogeography Cooperative Program Grant NA17RJ1226, the NOAA Fisheries Coral Reef Conservation Program Grant No. NA17RJ1226 and the Lenfest Ocean Program. This study was in part made possible by fishery-independent data collected by NOAA's Biogeography Branch in cooperation with the University of Puerto Rico under the NOAA CRES Program. Finally, we thank three anonymous reviewers whose insightful comments greatly improved this manuscript.