

1. Introduction
French inherited two low vowels from Latin: anterior /a/ and posterior /ɑ/Footnote 1. This vowel pair is generally still included in pronunciation manuals of French, but the distinction has been gradually disappearing in France since the 1950s (Martinet and Walter Reference Martinet and Walter1973: 32, Walter Reference Walter1988: 256). The back vowel tends to merge with its front counterpart, which leads to neutralisation in minimal pairs such as patte-pâte (‘paw’-‘dough/pastry’) or mat-mât (‘mat’-‘mast’) (Léon Reference Léon1966: 64, Reference Léon1992: 87; Walter Reference Walter1977: 41–42; Tranel Reference Tranel1987: 62–65; Hansen and Juillard Reference Hansen and Juillard2011; Hansen Reference Hansen, Durand, Kristoffersen, Laks and Peuvergne2014). Corpus research (Berns Reference Berns2015) has shown that sometimes a clear distinction is maintained in vowel quality (timbre) and/or quantity (length), but the difference is often partially or fully neutralised: /ɑ/ loses its length and becomes a central or front vowel. This phenomenon can be found throughout France: the contrast is most systematically neutralised in the South, but also in other regions clear patterns of neutralisation emerge. The older generations are more likely to maintain a difference (in frontness/backness and/or length) than the younger generations, but a considerable amount of variation exists among speakers of each generation. It is beyond all doubt, however, that the back vowel is strongly involved in a process of centralisation/fronting across the various speech communities of France. Interestingly, compared with the “Metropolitan French” varieties, the low vowel contrast in the Belgian and Swiss varieties of French seems to be of a different nature.
French spoken in Belgium and Switzerland differs from the reference variety in several respects, although the three varieties are in principle mutually intelligible (e.g., Walter Reference Walter1988; Miller and Grosjean Reference Miller and Grosjean1997; Francard Reference Francard1999, Reference Francard2008; Grosjean et al. Reference Grosjean, Carrard, Godio, Grosjean and Dommergues2007; Miller et al. Reference Miller, Mondini, Grosjean and Dommergues2011). An important number of differences can be found at the lexical level, but salient particularities also exist in the pronunciation. It is hard, if not impossible, to provide a characterisation of “the” BelgianFootnote 2 or “the” Swiss variety because of geographical variation in WalloniaFootnote 3 and the French-speaking part of Switzerland (Métral Reference Métral1977: 146, Walter Reference Walter1988, Francard Reference Francard1999, Hambye and Francard Reference Hambye and Francard2004), but one of the characteristic features of each of these accents is the role length plays in the vocalic system. Both Walloon and Swiss French systematically produce length distinctions for qualitatively (i.e., spectrally) identical vowels, for instance in minimal pairs like aimé/aimée, tu/tue, bout/boue. In standard French, the vowels in each of these pairs are completely homophonous. Another Swiss and Walloon characteristic concerns the way the contrast between the low vowels /a/ and /ɑ/ is realised: for both varieties, length is claimed to be an important cue, with /ɑ/ being longer than /a/. For Belgium, it is commonly reported that a length difference between the vowels is maintained, whereas the qualitative distinction has been neutralised. This is most apparent in the Centre and East of Wallonia, and less in the Western part (i.e., the area with a Picard substratum) (Pohl Reference Pohl1985, Walter Reference Walter1988, Francard Reference Francard2008). For Switzerland, length is also said to be involved, but the presence of a qualitative parameter is less clear. According to Métral (Reference Métral1977: 152) the contrast primarily involves length, rather than vowel quality, whereas Miller and Grosjean (Reference Miller and Grosjean1997: 278) and Andreassen et al. (Reference Andreassen, Maître, Racine, Detey, Durand, Laks and Lyche2010: 222) state that both durational and spectral differences are involved.
The existing literature thus does not yet provide a clear and comprehensive picture of the low-vowel contrast in the Belgian and Swiss varieties of French. By analysing spoken language data, this study aims to provide a precise characterisation of the parameters of variation involved: to what extent are qualitative and quantitative contrasts produced across the Swiss and Walloon territories? The nature of the low vowel contrast in these two varieties will also be discussed in light of the developments in Metropolitan France, where the contrast is gradually disappearing and affects both the vocalic quantity and quality.
The article is organised as follows. Section 2 presents the corpus material used in this study and describes the methodology adopted. Section 3 discusses the results, focusing on the degree of vowel fronting and length differences, and is followed by a general discussion and conclusion in section 4.
2. Methodology
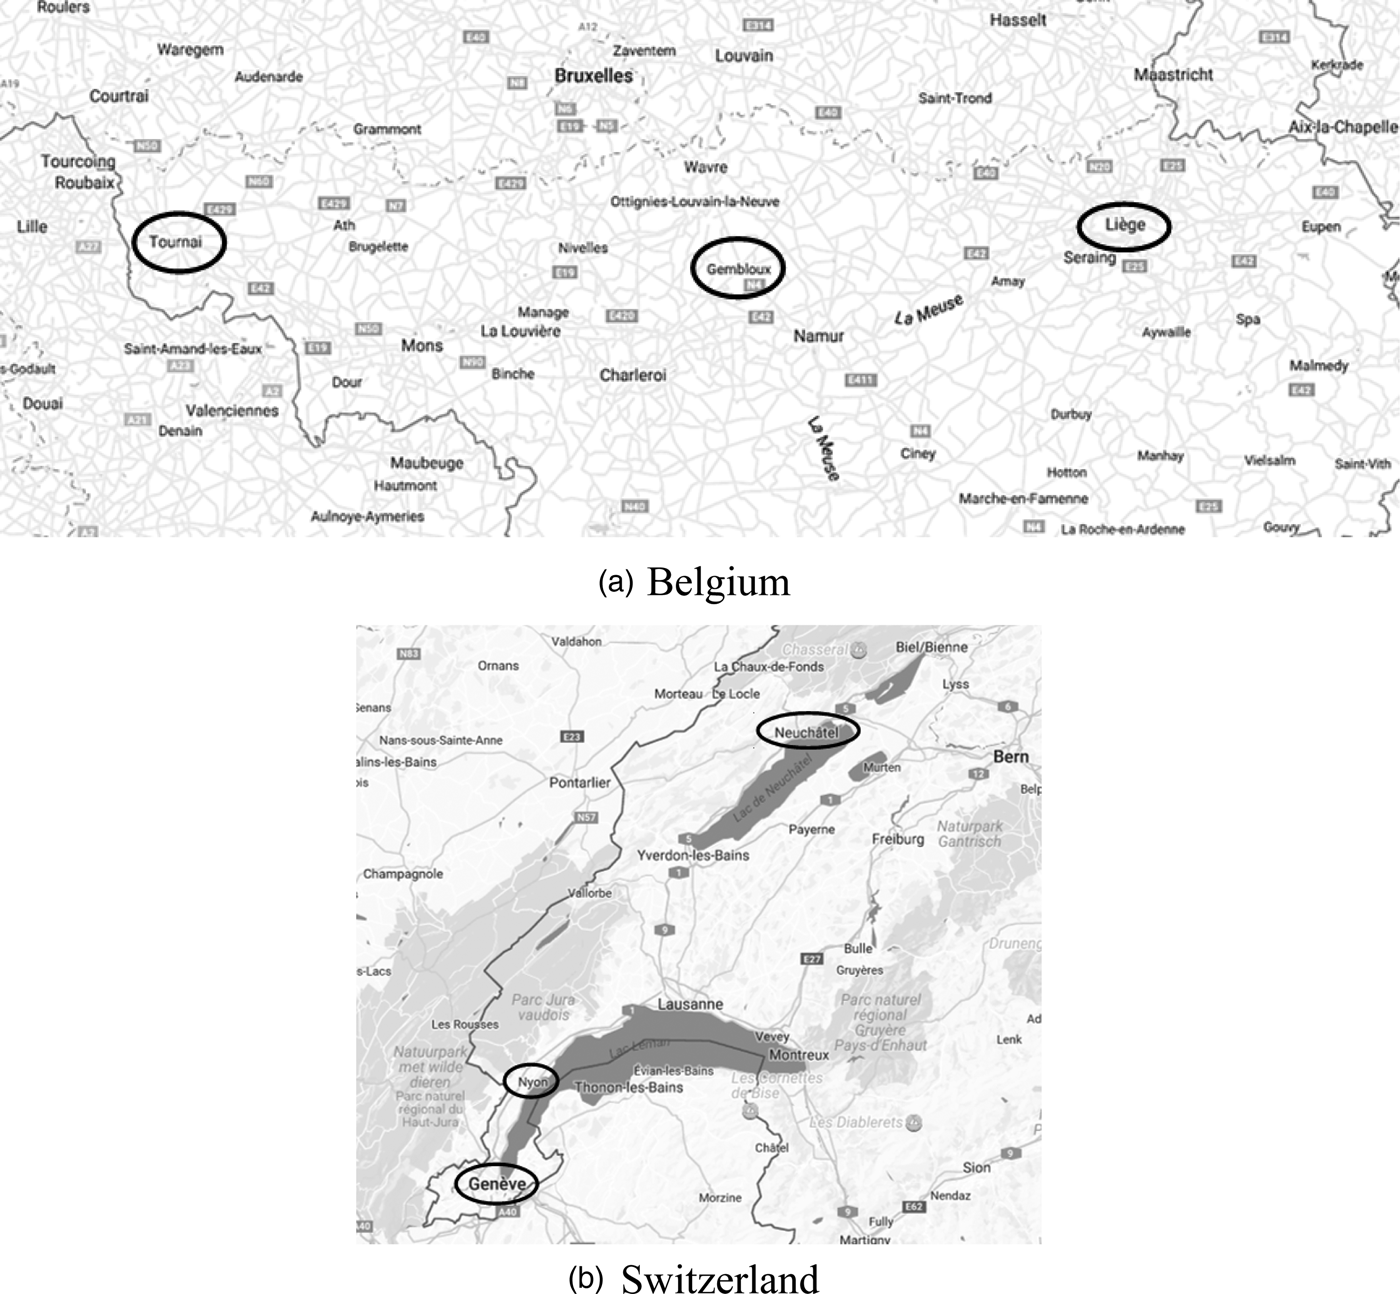
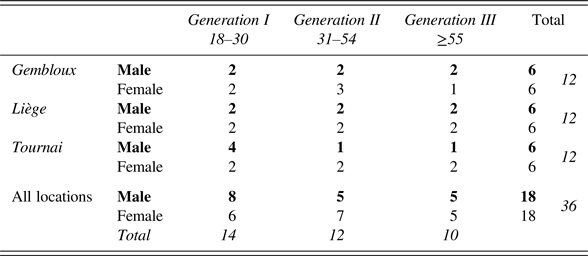
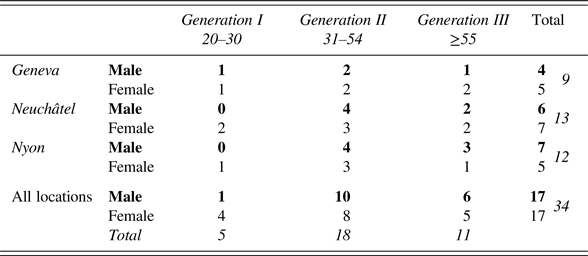
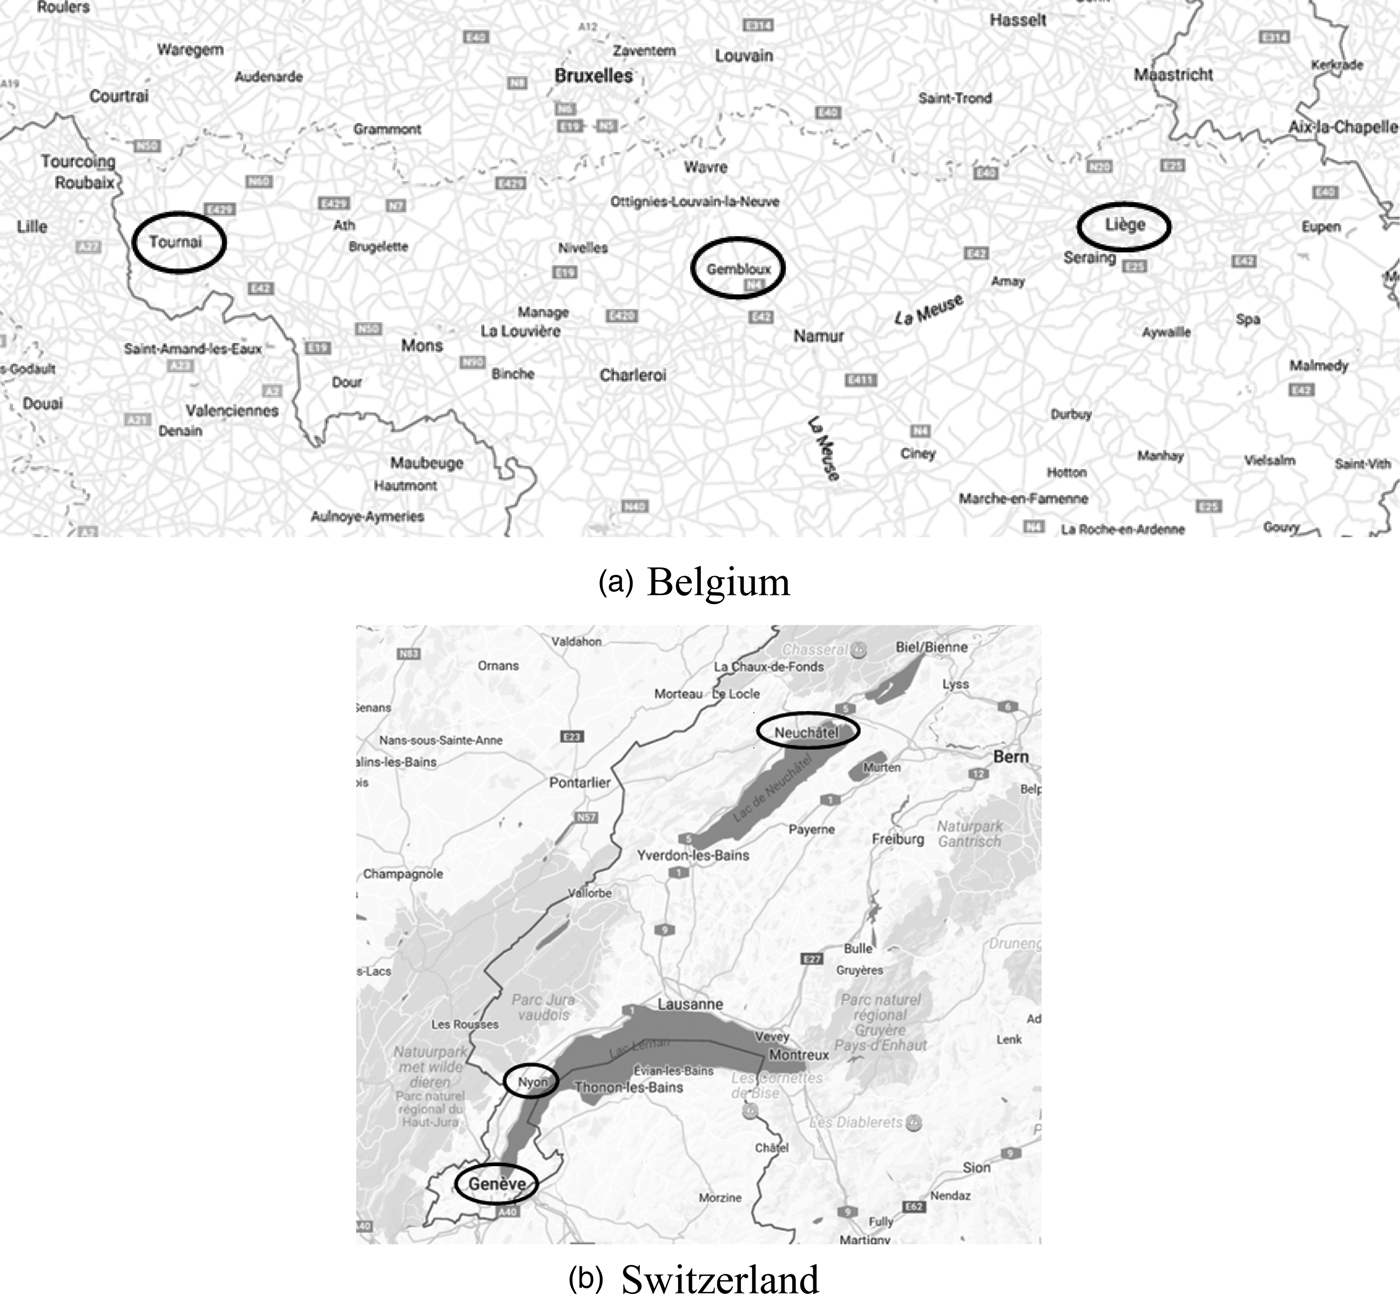
A number of surveys of the PFC (Phonologie du français contemporain) database (Durand et al. Reference Durand, Laks, Lyche, Pusch and Raible2002, Reference Durand, Laks, Lyche and Williams2005, Reference Durand, Laks, Lyche, Durand, Laks and Lyche2009; Detey et al. Reference Detey, Durand, Laks and Lyche2010)Footnote 4 were selected and analysed. This large spoken-language corpus of different varieties of French currently contains three Belgian and three Swiss surveys. For Belgium, these are Gembloux (situated to the south-east of Brussels, in the province of Namur), Liège (which lies close to the Dutch and German borders, in the province of Liège) and Tournai (located close to the French border, to the west-south-west of Brussels, in the province of Hainaut). The Swiss samples are from Geneva (the capital of the canton of Geneva, in the South-West, mainly surrounded by French borders), Neuchâtel (the capital of the canton of Neuchâtel, situated between the French border and the Swiss-German-speaking canton of Bern), and Nyon (situated in the canton of Vaud, to the north of Geneva). The surveys each contain about a dozen speakers, and are balanced for gender and age.Footnote 5 Figure 1 shows the geographical spread of the Belgian and Swiss surveys, and the distribution of the sociolinguistic features across the samples is given in Table 1.Footnote 6
Geographical distribution of the surveys (www.snazzymaps.com)
Demographic information for Belgium (n speakers)

Demographic information for Switzerland (n speakers)

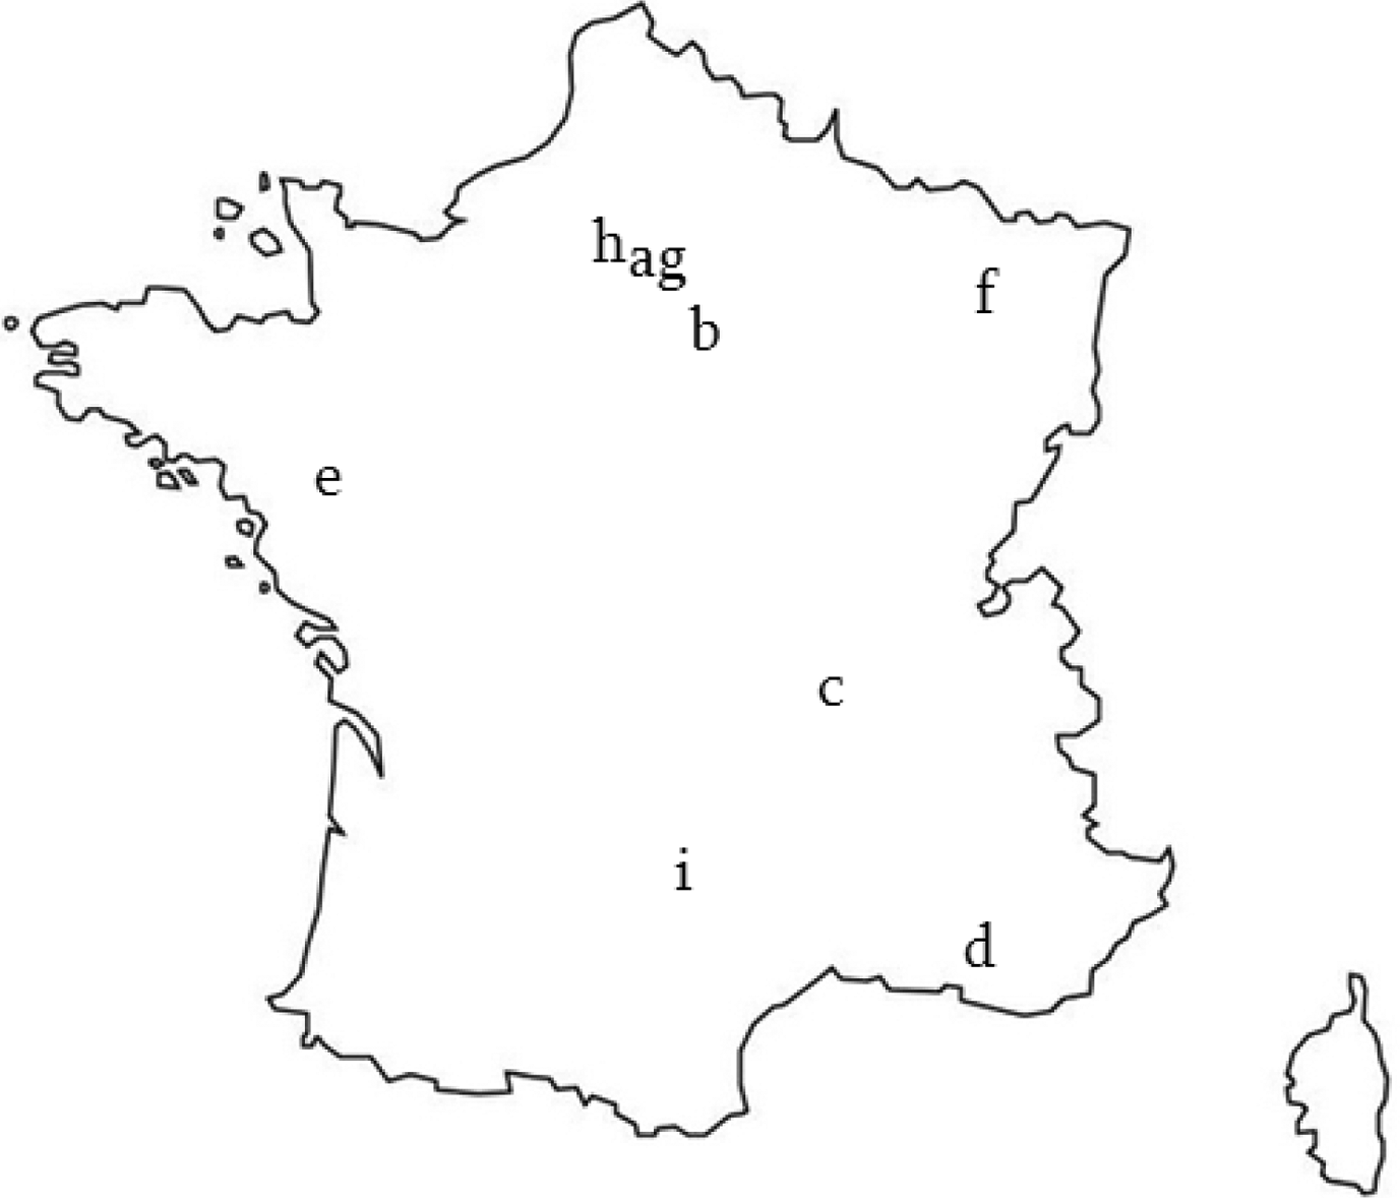
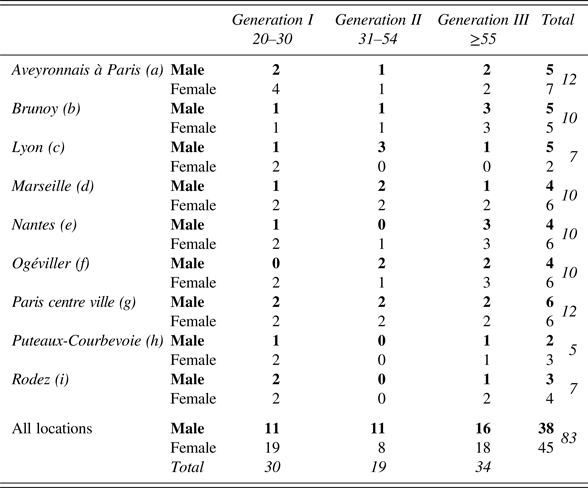
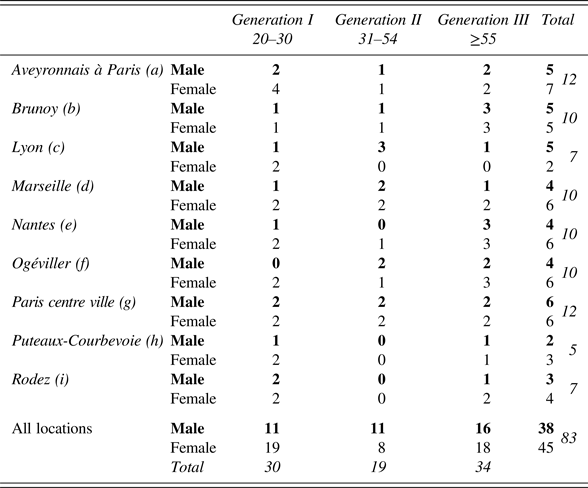
In order to put the Belgian and Swiss performances in proper perspective, the speakers of these varieties will be compared to the hexagonal French speakers studied in Berns (Reference Berns2015). The demographic details of this reference groupFootnote 7 are given in Figure 2 and Table 2.
Geographical spread of the surveys in France

Demographic information (n speakers)Footnote 8
In order to enable optimal comparison of the Belgian and Swiss outcomes with the Metropolitan French corpus study, the same methodology as used in Berns (Reference Berns2015) was adopted. All PFC speakers participated in two conversation tasks (an interview and a spontaneous conversation) and in two reading tasks (a wordlist with 94 items and a one-page narrative text).
The minimal pair patte (/a/ ‘paw’) and pâte (/ɑ/ ‘dough/pastry’) are present in both the text and the wordlist, but only the wordlist tokens were taken into account here. That is, they occur in stressed position in this task (i.e., the most likely context for the low vowel contrast to be maintained (Léon Reference Léon1966: 64, Walter Reference Walter1977: 41–42, Tranel Reference Tranel1987: 62–65) whereas they are phrase-internal (i.e., in unstressed position) in the read text. The words patte and pâte each occur twice in the list. The first time, they occur as randomly ordered items, the second time, they are directly sequenced and constitute a minimal pair. These four tokens were acoustically analysed with Praat software (Boersma and Weenink Reference Boersma and Weenink2016). The vowel length was measured by taking the beginning of the first full glottal pulse of the vowel at the zero crossing as the starting point. The qualitative parameter of interest is the second formant (F2), representing frontness/backness.Footnote 9 It was extracted at 50% of the vowel (Harrington Reference Harrington2010: 206–213). For the statistical analyses, the linear frequency values in Hertz were converted to the non-linear Bark scale (Traunmüller Reference Traunmüller1990),Footnote 10 which incorporates most faithfully the non-linear nature of perception of frequency.
3. Results
The contrastive parameters vowel quality and vowel quantity will first be described separately, followed by a discussion of their combined presence or absence.
3.1 Vowel frontness/backness
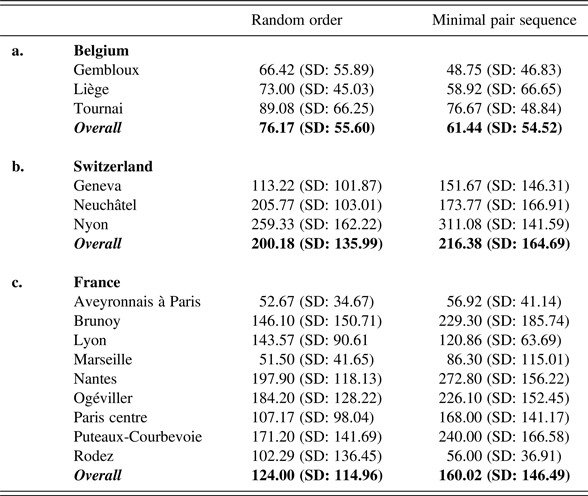
The corpus study for France has shown that speakers who maintained a certain degree of qualitative difference between the two vowels generally produced larger F2 differences when they were directly confronted with the contrast, as when the items were listed as a minimal pair (see Table 3c and Berns Reference Berns2015: 9–10 for a complete overview and discussion). The average absolute F2 differences between the two low vowel tokens for Belgium and Switzerland are given in Tables 3a and 3b.Footnote 11
Average absolute F2 differences (in Hertz)
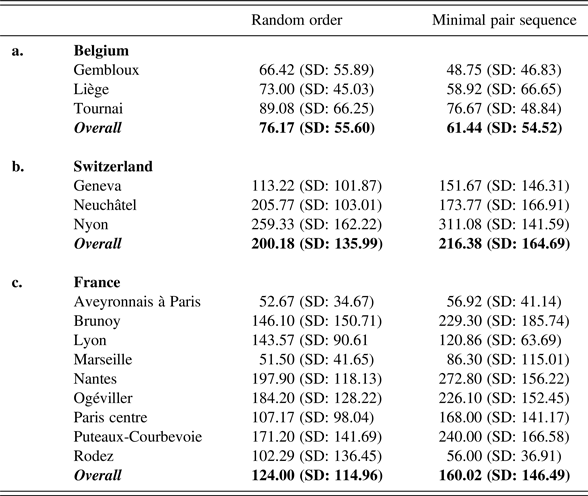
The Swiss surveys for Geneva and Nyon show larger overall mean differences between patte and pâte in the minimal pair context. The pattern is the reverse for Neuchâtel. However, the standard deviations of all three Swiss samples are substantial, indicating a considerable amount of inter-speaker variation.Footnote 12 As far as the mean F2 differences per se are concerned, Geneva's score approximates the mean value of France. Still, as the different French means show, this country does not behave as a homogeneous zone and it is therefore more accurate to say that Geneva behaves rather similarly to the Paris centre survey. Interestingly, Neuchâtel and especially Nyon highlight the frontness/backness cue in a far stronger way than Geneva and most surveys in France.
More striking differences arise when the Belgian scores are also taken into account. Contrary to the general tendency of producing a larger contrast in the minimal-pair context among the not-fully-neutralising speakers of France and Switzerland, the Belgian F2 differences in the random sequence are the reverse of what would be expected: for all samples they are somewhat larger than in the minimal pair context.Footnote 13 Even more striking, however, is the observation that the Belgian qualitative differences (as well as the standard deviations) in both contexts are overall considerably smaller than in Switzerland and the Middle and North of France.Footnote 14
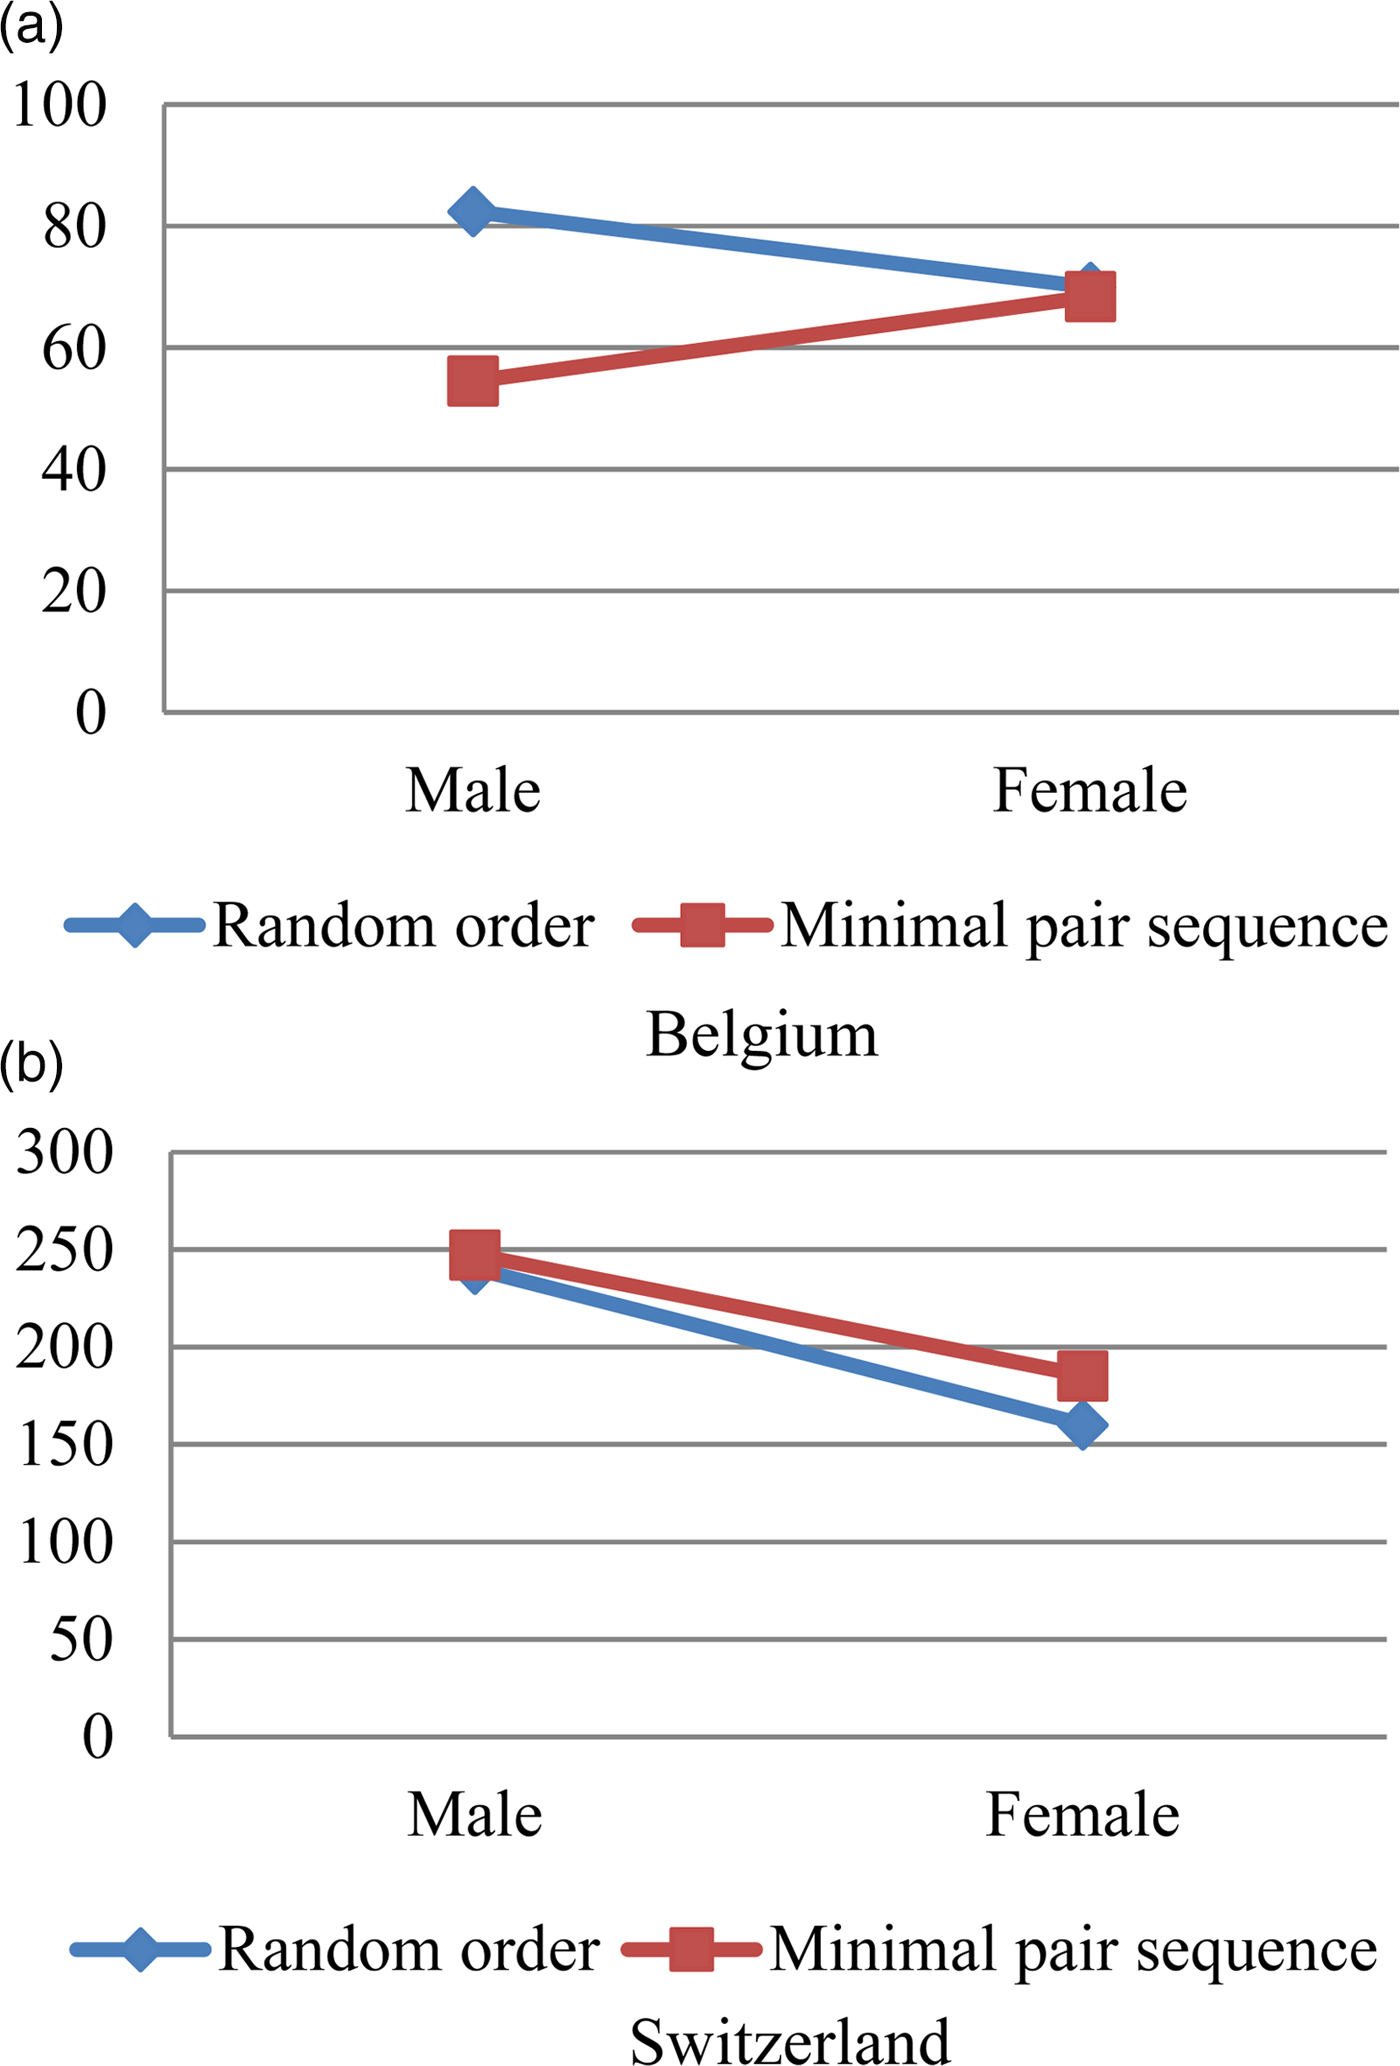
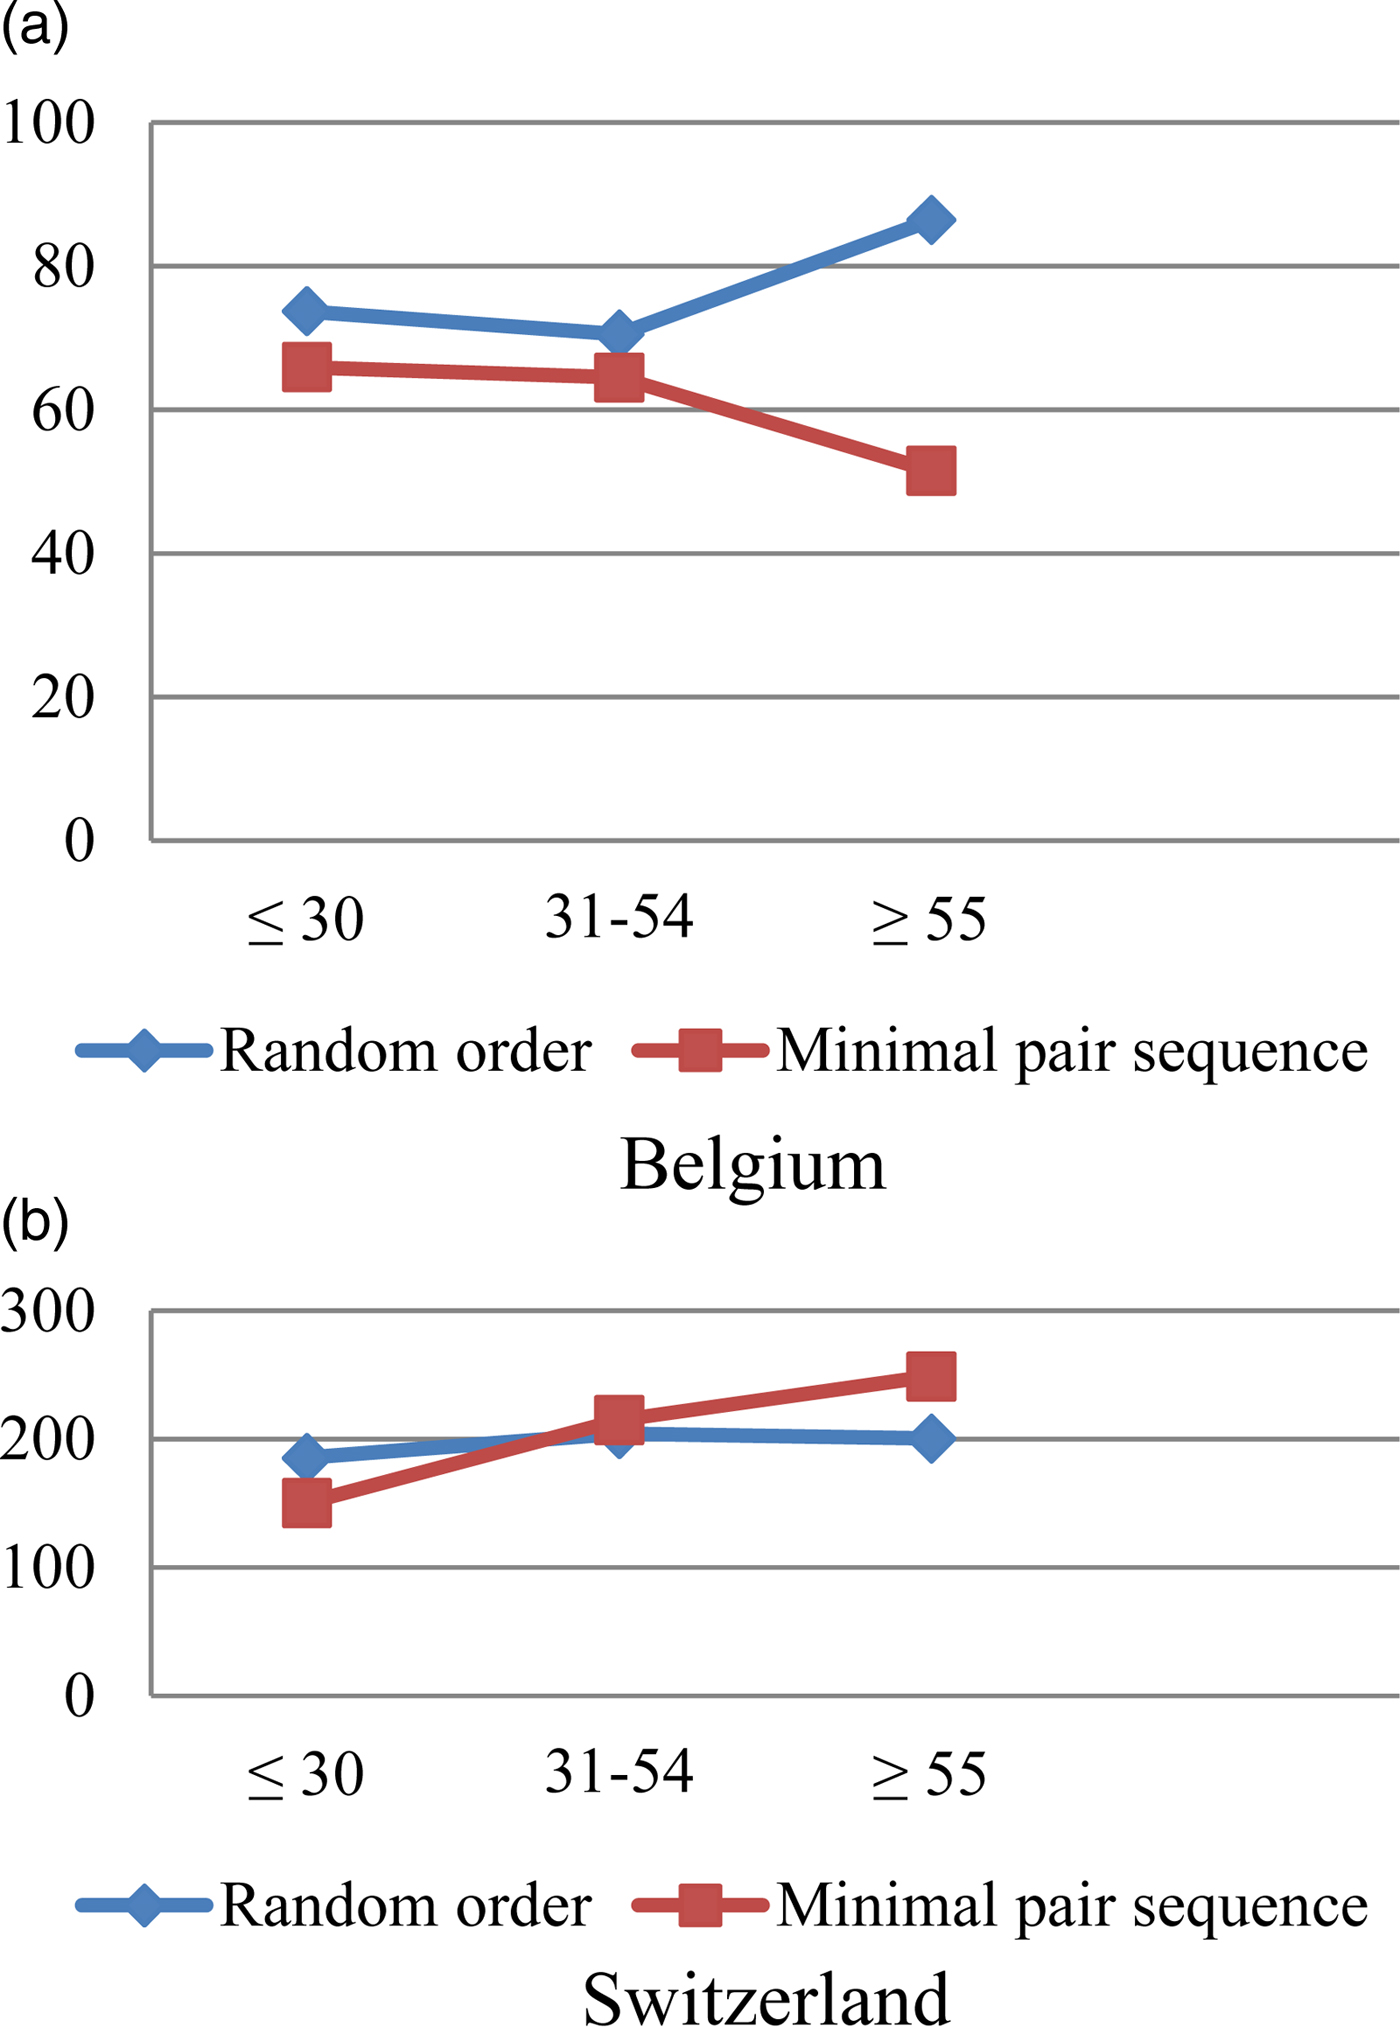
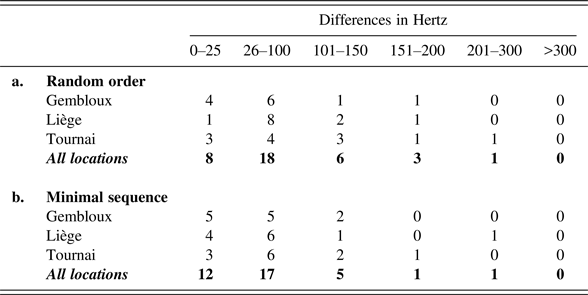
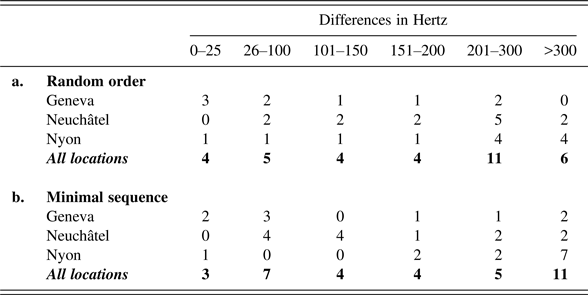
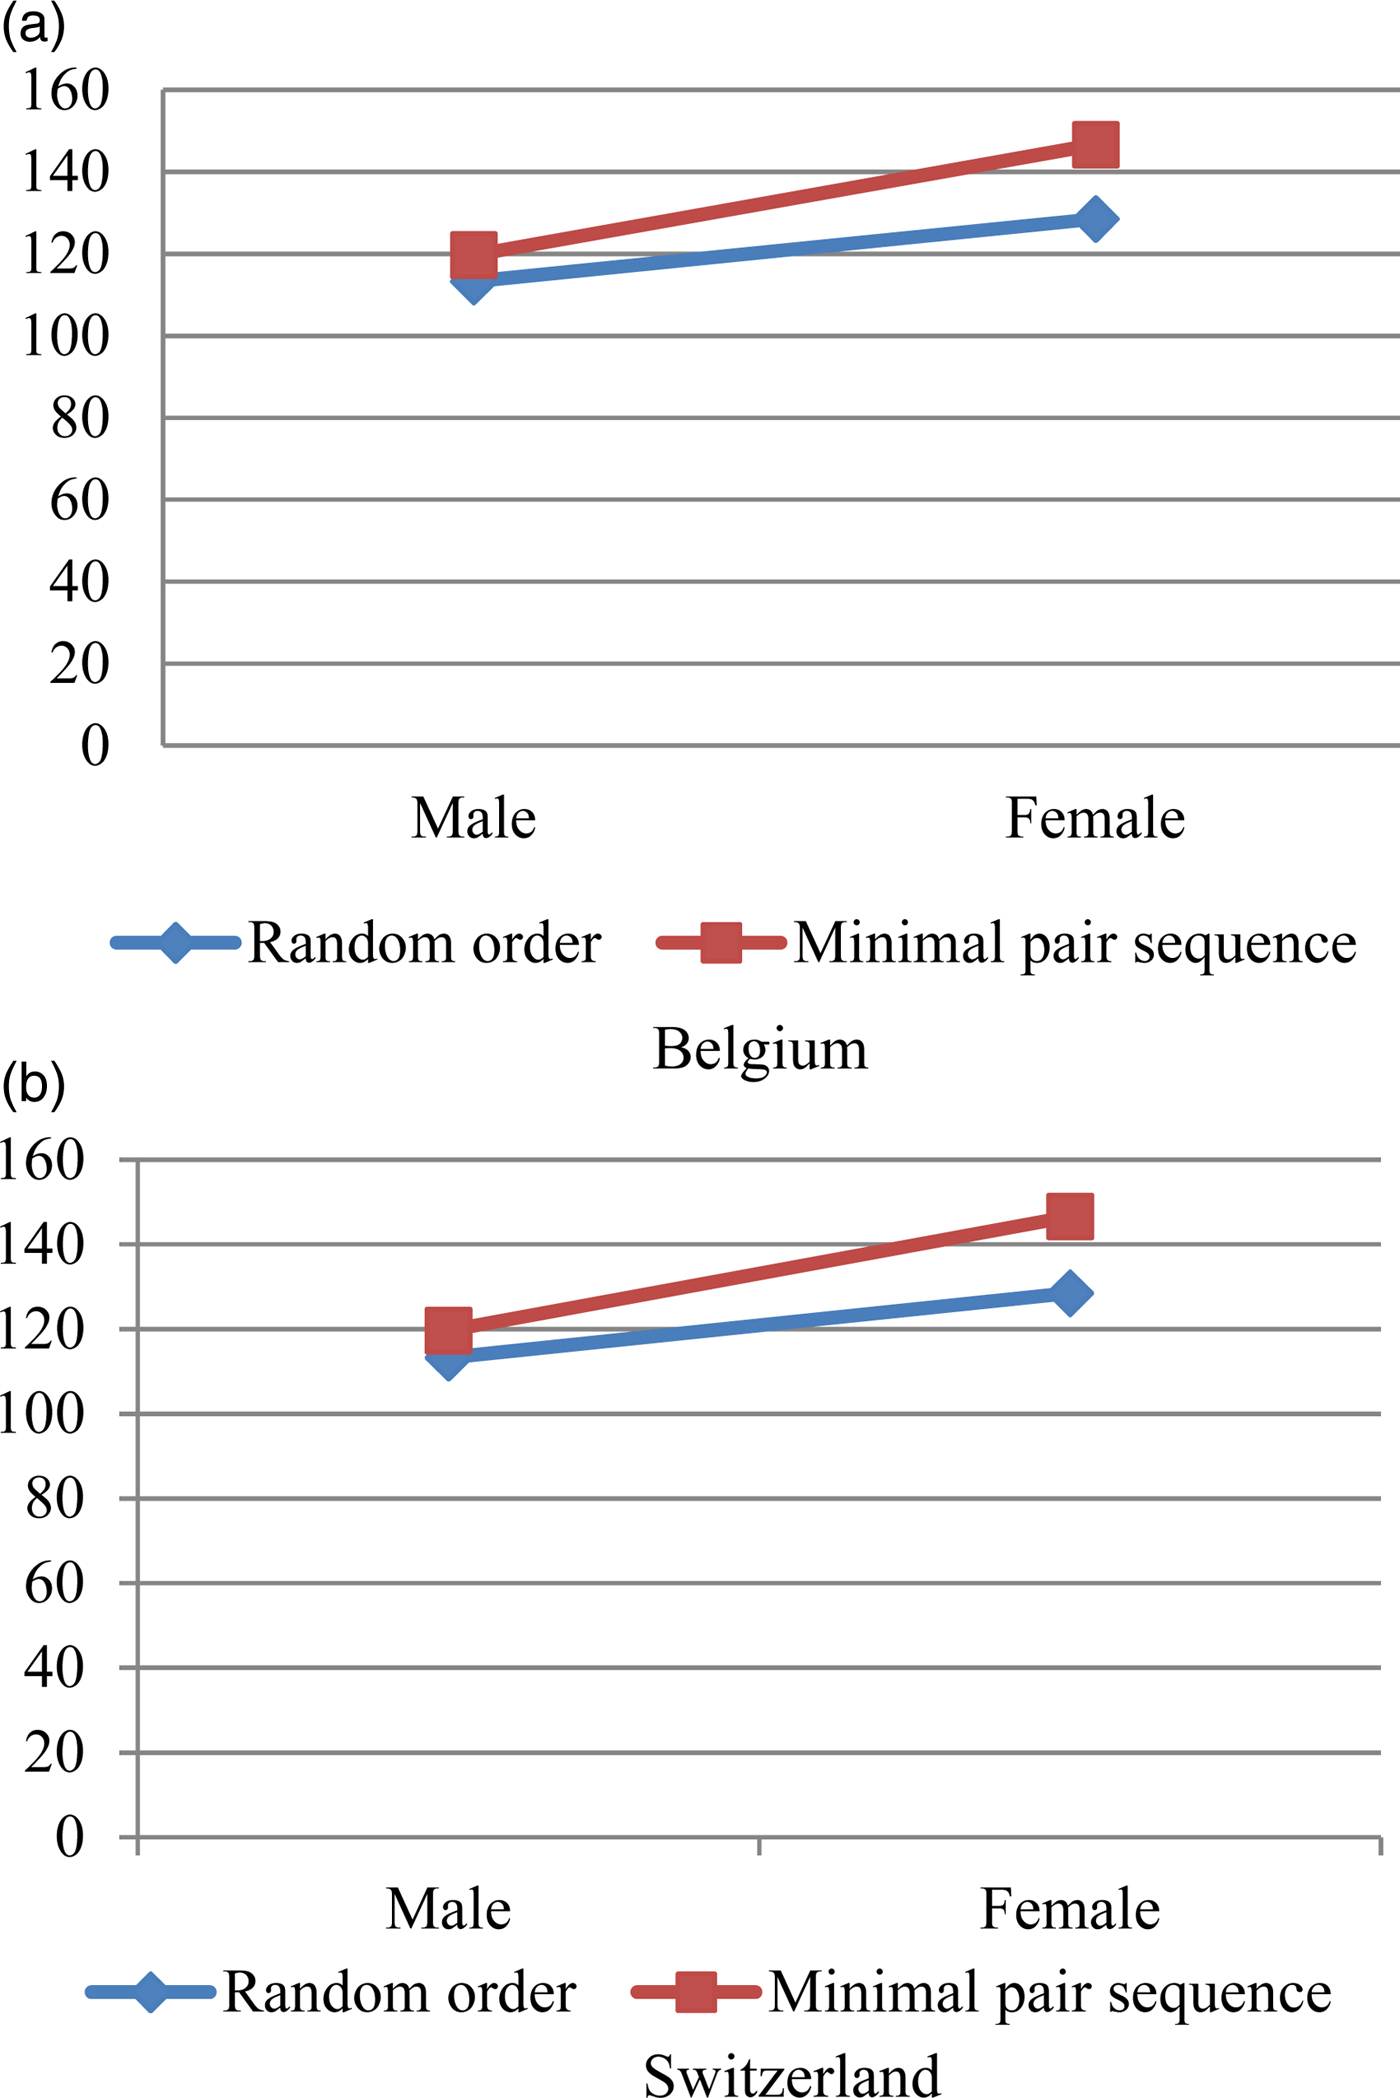
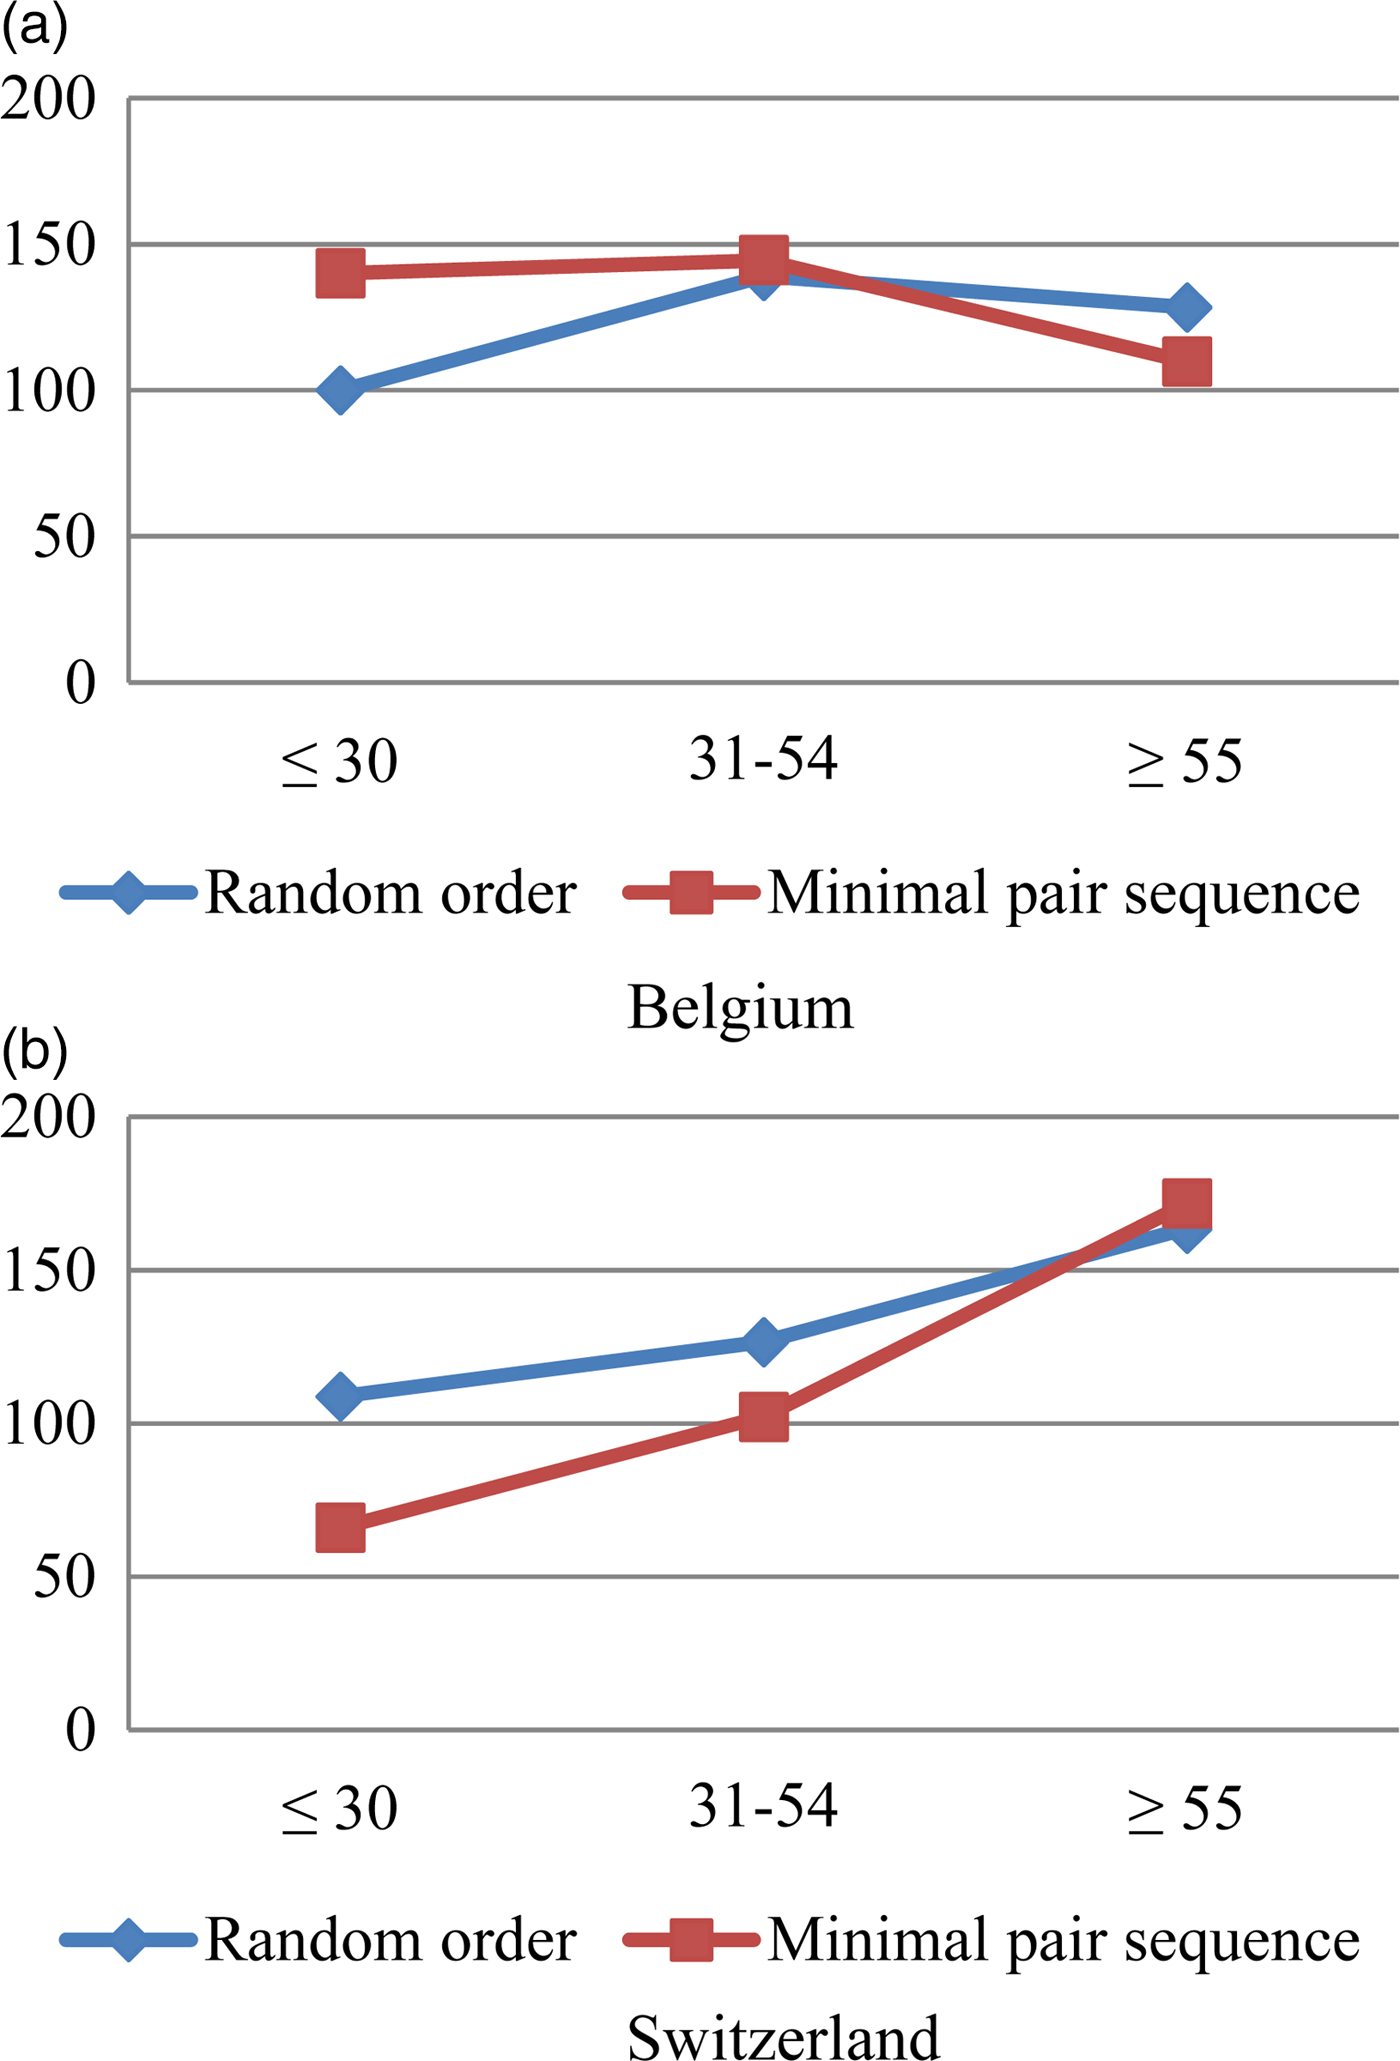
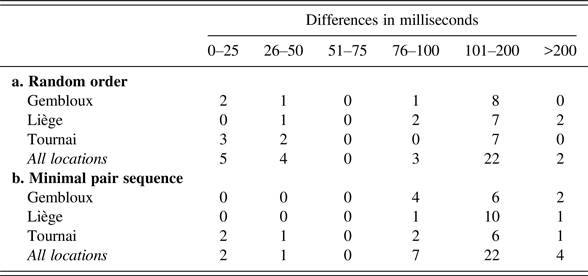
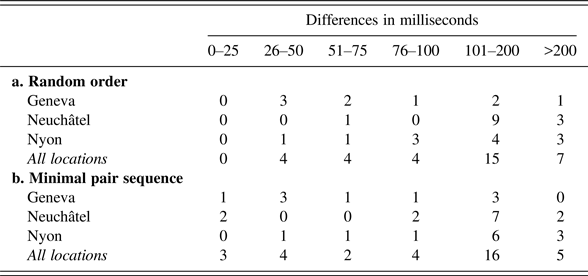
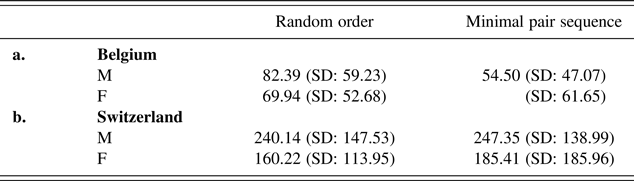
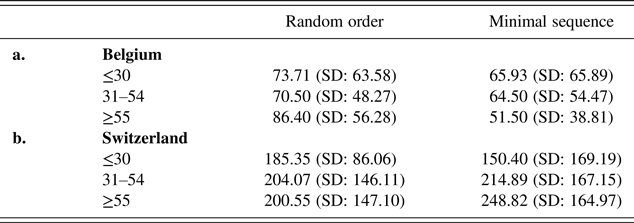
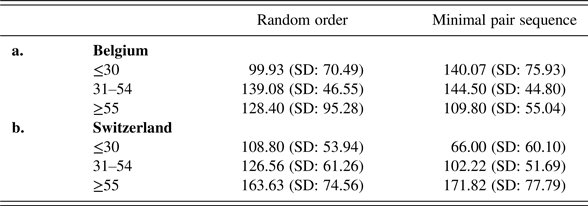
As the standard deviations have quite substantial ranges, it is worthwhile to zoom in on the individual realisations and the way these patterns are dispersed among the different age groups and genders. Tables 4 and 5 more explicitly illustrate the individual variation by providing the dispersion of contrasts realised by the Swiss and Belgian participants. When considering the data in these tables, the reader should keep in mind the information provided in footnotes 12 and 13. That is, the tables present the absolute differences, but a number of speakers reversed the contrast. These reversals show the speakers' uncertainty on the nature of the contrast and reflect the degree of instability of the distinction. Figures 3 and 4 show the average absolute frontness/backness differences between the low vowels in the patte and pâte tokens with respect gender and age.Footnote 15 The full descriptive statistics are given in Tables 13 and 14 in the Appendix.
Average absolute F2 differences (in Hertz) according to gender

Average absolute F2 differences (in Hertz) according to generation

Absolute F2 differences for Belgium (individual speakers per survey)

Absolute F2 differences for Switzerland (individual speakers per survey)

The Belgian and Swiss data were analysed by means of a repeated measures ANOVA in SPSS. As indicated above, the statistical analysis was based on the Bark frequency values, and included the within-subject factor ‘context’ (random order or minimal pair sequence) and the between-subject factors ‘age’, ‘gender’ and ‘regional background’. The significance level α was set at .05. For both the Belgian and Swiss surveys, no significant effects were obtained: the difference between the random and minimal pair contexts for each country does not exceed chance level, and the different Belgian and Swiss speakers are still quite stable across the different genders, generations and even regions.Footnote 16
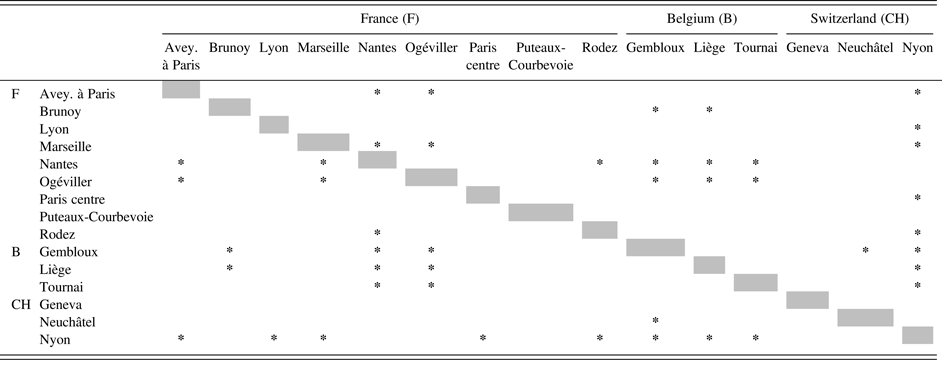
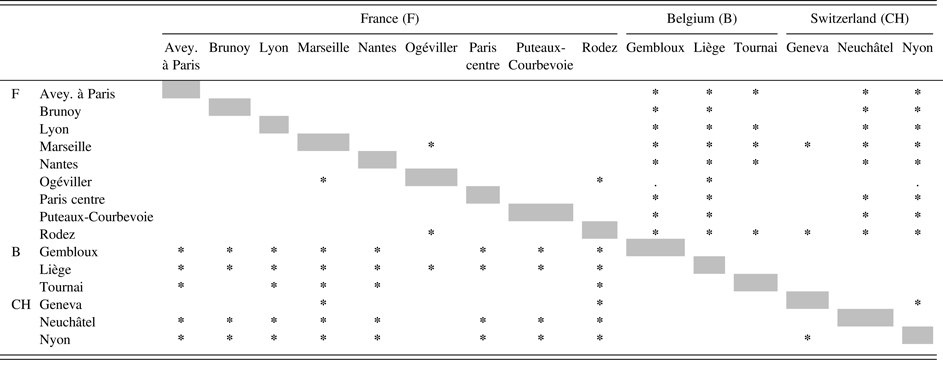
An extended repeated measures computation, including the individual realisations of the French, Belgian and Swiss surveys at the same time, yields a number of interesting insights.Footnote 17 The asterisks in Table 6 indicate the significant differences.
F2: France, Belgium and Switzerland

The Belgian speakers produced significantly smaller F2 differences than the speakers in the French surveys of Brunoy, Nantes and Ogéviller, which preserved a considerable F2 difference. Gembloux and Liège differ from all three of these Metropolitan samples, Tournai (the Belgian survey closest to the French border and with the highest average differences in Table 3a), deviates only from Nantes and Ogéviller. As the F2 difference has become very unstable and variable across France, no systematic overall difference between the two countries emerges.
A France-Switzerland comparison shows no meaningful differences for Neuchâtel and Geneva, which thus behave quite France-like. The picture is different for Nyon, the sample with the most pronounced F2 distinctions. It differs statistically from the most strongly neutralising samples of France: Aveyronnais à Paris, Lyon, Marseille, Rodez (i.e., surveys with speakers living in or originating from the South of France) and Paris centre. Statistical differences also emerge between Belgium and Switzerland. As expected on the basis of the figures in Table 3, these countries do not differ just by chance. The statistical comparison reveals that the large differences of Nyon are indeed higher than in all three Belgian samples, and Neuchâtel differs from Gembloux (the most radically F2-neutralising Belgian survey). Geneva, the most extreme F2-reducing Swiss sample, does not differ significantly from the Belgian productions.
Even though within both Belgium and Switzerland no statistically relevant differences arose between the regions, the full set of F2 results suggests that the three countries under scrutiny differ along a continuum: at one end we find the least reducing surveys (with Nyon at the low end), followed by a middle range of moderately reducing surveys, where several Swiss and French varieties intertwine to various degrees. At the high end of the continuum, we find the surveys that tend to reduce the contrast most strongly: those of Southern France and Belgium.
Adjacency to the French border, the degree of contact with France, and/or attitudes towards France seem to influence the degree of F2 maintenance (see Figure 1). That is, Geneva, situated close to the border and with close social and economic ties to France, is less pronounced in its F2 maintenance than the other Swiss varieties, and Tournai is less extreme in its F2 reduction than the other Belgian samples further removed from the border. Still, note that in Nyon, which is not far removed from France geographically speaking, no such effect is observable, probably because its contacts with and/or attitudes towards mainland France are not as strong as in Geneva.Footnote 18
3.2 Vowel length
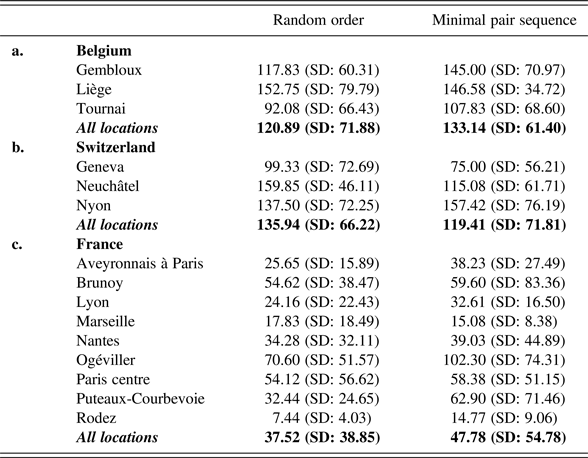
The length results in Table 7 are even more intriguing than the F2 outcomes. As the scores in Table 7c show, the length parameter has not been preserved to the same extent across France. In the zones where considerable traces of the length distinction can still be found, the longer length cues typically accompany the larger F2 contrasts. In comparison with speakers from France, Belgian and Swiss francophones generally produce a greater length contrast between the two vowels in both contexts.Footnote 19
Average absolute length differences (in milliseconds)

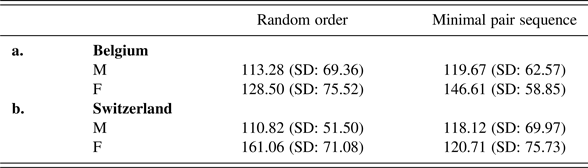
The patterns observed for Gembloux, Tournai and Nyon suggest that the speakers involved tend to emphasise the length contrast when they are directly confronted with the minimal pair. The mean for Liège is about equal in both contexts, whereas the length difference between the patte and pâte tokens in the Geneva and Neuchâtel samples seem instead to be attenuated somewhat in the minimal pair context.Footnote 20 Again, as the standard deviations show, variation among speakers is substantial, which makes it difficult to interpret these data without looking at the more fine-grained distributions. The absolute individual length differences for the speakers of each survey are given in Tables 8 and 9, which should be considered in the light of the observations made in footnote 20. Figures 5 and 6 show the sociolinguistic distribution of the length cues with respect to the age and gender of the participants. Tables 15 and 16 in the Appendix provide the full descriptive statistics.
Average absolute length differences (in milliseconds) according to gender

Average absolute length differences (in milliseconds) by generation

Absolute length differences Belgium (individual speakers per survey)

Absolute length differences Switzerland (individual speakers per survey)

Statistical assessment of the dataFootnote 21 (again a repeated measures ANOVA with α set at .05) reveals that for both Belgium and Switzerland, the difference between the random and minimal-pair context is not significant. The between-subject variables are, however, of different magnitude in these two varieties. The Belgian speakers do not differ systematically from one another on the basis of their age, gender or regional origin, whereas the Swiss speakers behave quite differently according to their age and regional background. The differences in Geneva are significantly smaller than in Nyon, while Neuchâtel lies between the two. Irrespective of regional background, age turns out to be statistically relevant. Several aspects may be involved here. As was found for their French neighbours, the length distinction may be disappearing to a certain extent among the younger Swiss speakers. Crucially though, this reduction is more moderate for the Swiss: length differences tend to be smaller for younger Swiss people than for their older compatriots, but the differences realised by these younger Swiss speakers are generally still considerable compared with those of their French peers. Another aspect that may play a role is that, in comparison with the younger generations, older speakers have more explicit or vivid knowledge of the existence of a low vowel contrast. When presented with the tokens in question, their awareness is triggered, and they put this knowledge into practice in a more extreme way than do the younger generation(s).
As with F2, an extended repeated measures computation was carried out to compare the individual realisations of the speakers from France, Belgium and Switzerland. The results are given in Table 10, where the asterisks again indicate the significant differences.
Length: France, Belgium and Switzerland (significant differences are indicated by *)

With respect to the Swiss surveys, essentially Neuchâtel and Nyon deviate from France, both differing significantly from eight Metropolitan samples (all except Ogéviller). The situation is different for Geneva, which differs only from Rodez and Marseille, two Southern groups that reduce length quite drastically. Like Tournai for Belgium, Geneva thus behaves quite Central/Northern French-like, and both surveys also did as far as F2 was concerned. Our findings are thus in line with the commonly expressed ideas that the variety of the Tournai region is the Walloon variety which sounds most France-like (e.g., Hambye et al. Reference Hambye, Simon, Wilmet, Detey, Durand, Laks and Lyche2010), and that the variety of French spoken in Geneva is the Swiss variety closest to standard French (e.g., Francard Reference Francard2001, Racine et al. Reference Racine, Schwab, Detey and Falkert2013).
The Belgian and Swiss surveys do not deviate significantly from each other, which implies that the relative presence of length is not radically different in these varieties (contrary to what was seen for F2). This does not hold for the Belgium-France comparison. The differences are most obvious for Gembloux, which differs from eight out of nine French surveys, and Liège, which differs from all nine of the French surveys. The speakers of Tournai differ from the Southern French speakers (i.e., the most radical neutralisers in France), but do not systematically deviate from the Central and Northern France varieties. As shown by Table 7a, the mean length distinction in Tournai is smaller than in the other two Belgian surveys, and the statistical results again strongly suggest that geographical distribution plays a role here. Tournai is situated in a region with a Picard substratum, and moreover, it is located close to the French border and maintains intensive economic contacts with the Northern France city of Lille; this evidently influences the degree of length maintenance.
The presence of a more extensive, systematic length contrast can thus be seen as characteristic of the Belgian and Swiss varieties. This contrast is still quite pronounced in both countries, although with different age-based patterns. However, as noted earlier for F2, the differences must be interpreted on a continuous scale: adjacency to the French border, degree of contact with France, and the attitudes towards France and its linguistic variety, are all likely to affect the degree of maintenance of the length contrast. Section 4 will discuss these sociolinguistic influences in more detail.
3.3 Anteriority and length
The preceding sections focused on the parameters of vowel quality and quantity in isolation. For France, different patterns of contrast maintenance and reduction were revealed, with length and timbre being affected to different degrees. The large(r) length differences showed up with large(r) F2 differences, but overall the two parameters proved to be only weakly correlated: the squared correlation coefficient (r 2) indicated that only 13% of the variation in length could be ascribed to variations in F2 (Berns Reference Berns2015: 12–13). In the Metropolitan French varieties that maintain the low vowel contrast to a certain extent, length is thus more than just an enhancing cue for F2, and the two can be used as independent contrastive signals.
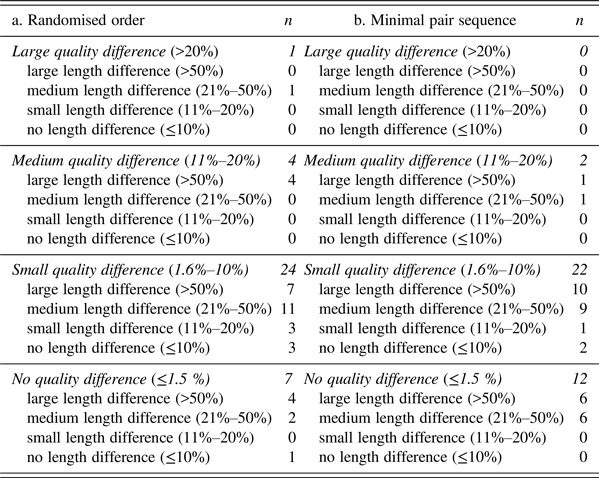
Let us now consider how Belgian and Swiss speakers do or do not combine the parameters of frontness/backness and length in their realisations of the two low vowel tokens under scrutiny. Table 11 gives an overview of the patterns produced by the Belgian participants. These results again clearly show the general absence of a strong F2 difference between the two vowels, but now we are able to see how, at the level of the individual speaker, frontness/backness goes together with length. The majority of speakers, in both the minimal-pair context and the randomised order, produce little or no F2 difference: instead, the back vowel turns into a central or front vowel. Still, among these F2-reducing speakers, the length cues are quite clearly pronounced, as most of them produce medium to large length contrasts.
Patterns of contrast maintenance and reduction: Belgium

The contrast between the two low vowels has disappeared in the speech of only one Belgian speaker (no qualitative and no length differences left); for the others, length helps to discriminate between the two vocalic tokens in the absence of the qualitative cue. The contrast between the front and back low vowels in the traditional sense (i.e., a quality distinction accompanied by a difference in length) is maintained by five speakers in the randomised order and by only two speakers in the minimal pair sequence. This strongly suggests that the low-vowel contrast has indeed been transformed into primarily a length distinction for the majority of Belgian PFC participants. It could of course be the case that the wordlist task triggers a certain linguistic awareness, which causes the contrast to be more explicitly pronounced than it would be in fully spontaneous speech, but even then, it generally does not lead the Belgian speakers to produce a contrast involving both parameters, but rather only length. In France, patterns where length was strongly present in the absence of a qualitative frontness/backness distinction were not found (Berns Reference Berns2015: 14)
Analogously to Table 11, Table 12 presents the detailed individual realisations of the Swiss participants.
Patterns of contrast maintenance and reduction: Switzerland

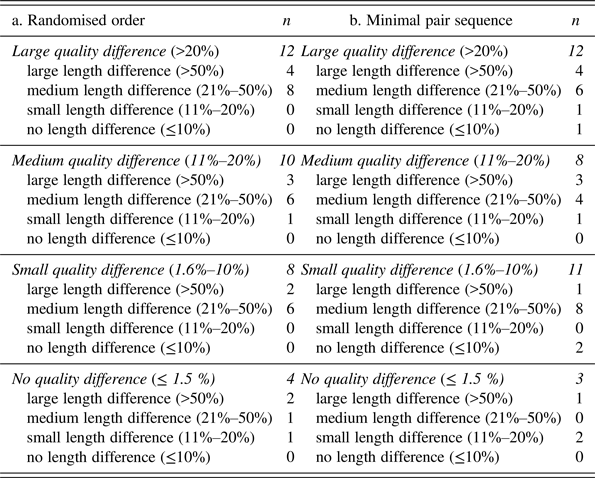
Unlike the Belgian patterns, F2 distinctions are clearly present in Switzerland. Differences between individuals do of course exist, but the distribution of the speakers of the two countries across the various degrees of F2 differences is substantially different. The Swiss patterns realised in the random-order context and the minimal-pair sequence are quite similar. Although a small number of participants show very moderate traces of the contrast, none of the speakers in these samples neutralise the distinction between the two vowels to below the perceptual thresholds for F2 and length. The traditional contrast, involving both length and quality, is maintained by 21 speakers in the random-order context and by 17 speakers in the minimal-pair sequence (i.e., these speakers exhibit medium or large differences in both length and quality). If medium or large F2 cues are present, they are mostly accompanied by a medium to large length difference. If the frontness/backness distinction is less overtly present, length is either present to some extent or fully gone.
In several surveys in France, the contrast has indeed fully disappeared (Berns Reference Berns2015), but Tables 11 and 12 show that this full neutralisation is clearly exceptional in Belgium and Switzerland. Interestingly, though, the Swiss and Belgian low-vowel patterns are far from identical; section 4 discusses in more detail the perspective in which the developments in each of these countries should be seen.
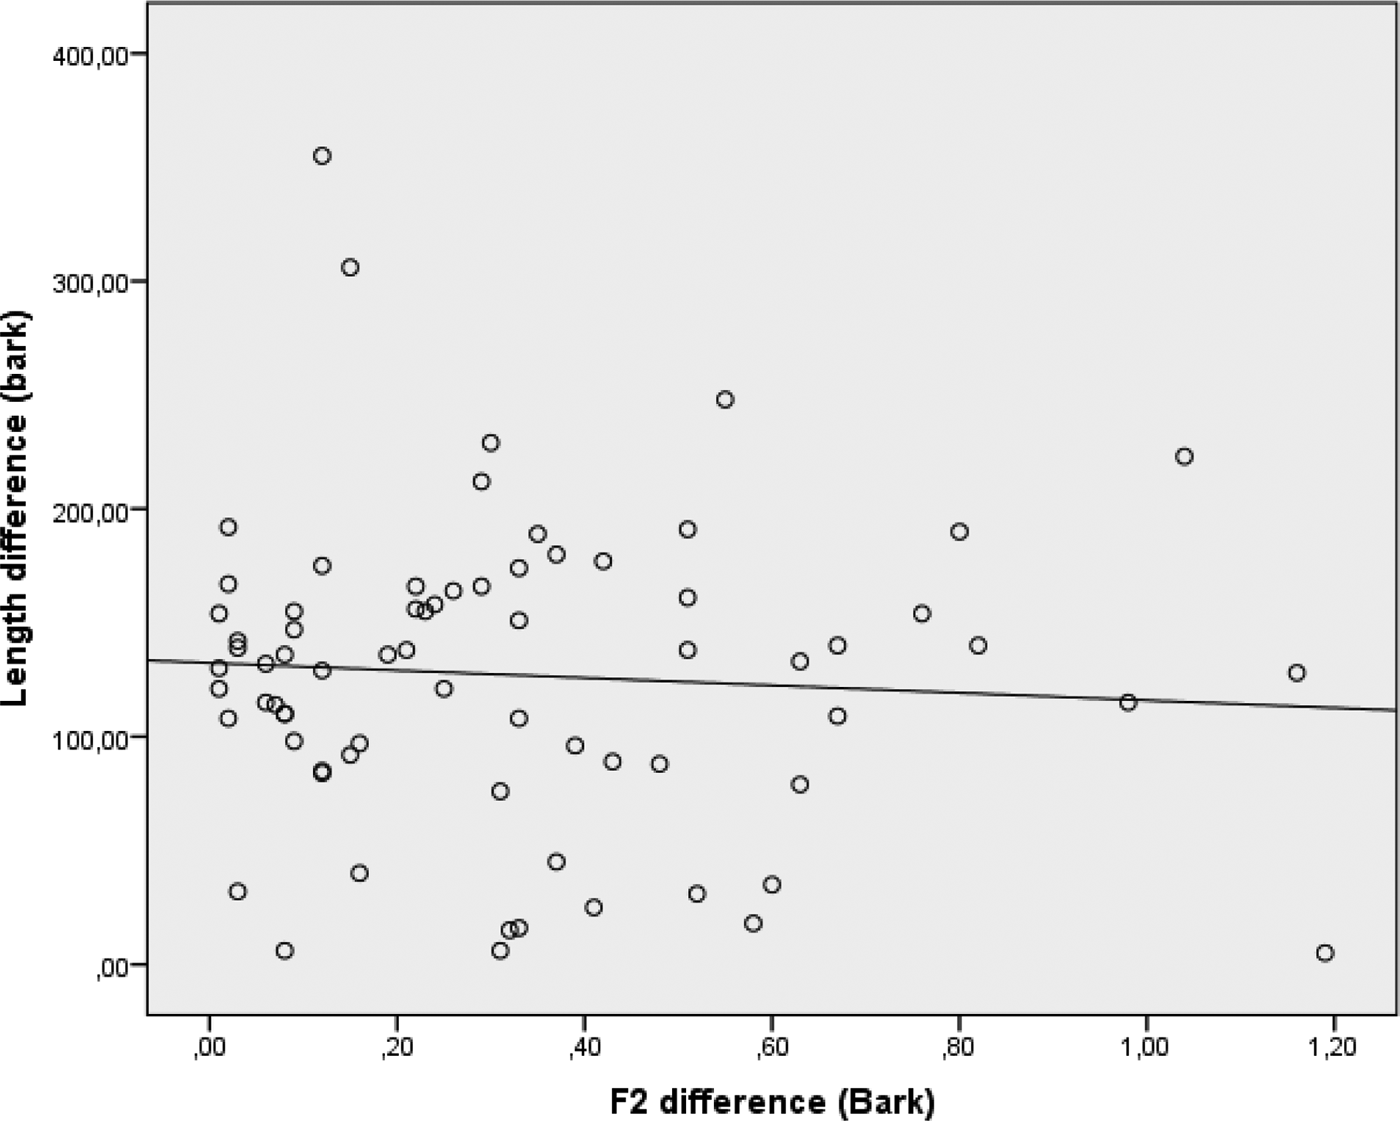
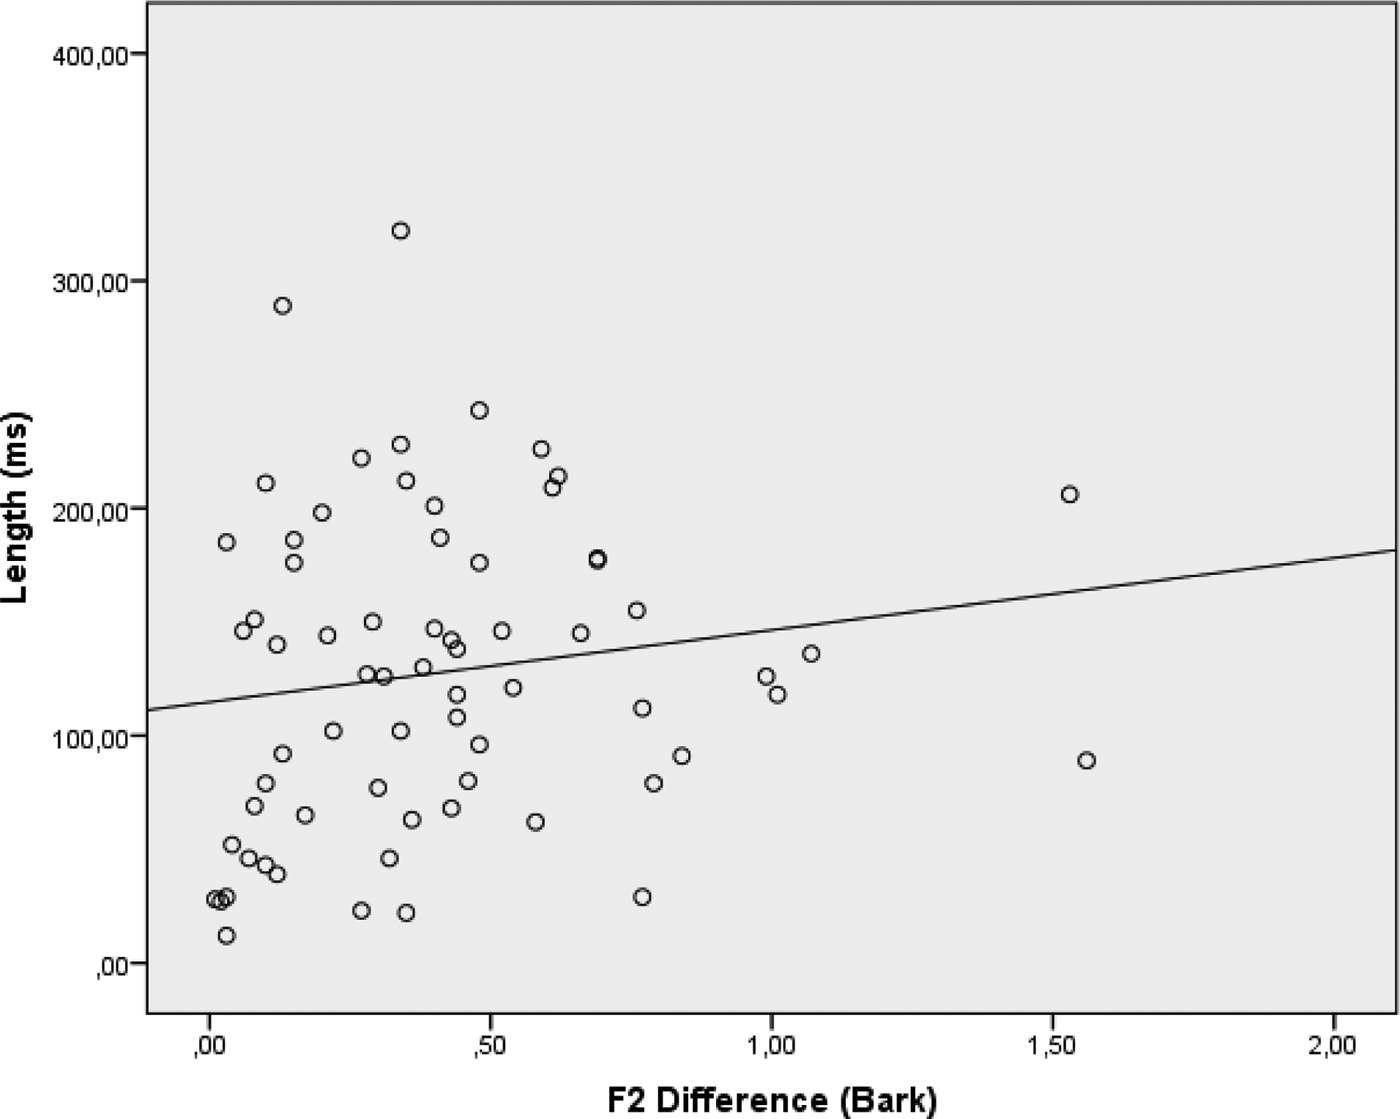
Correlating vowel quality and quantity for Belgium and for Switzerland, respectively, shows a very strong independence of the two cues. The squared correlation coefficients indicate that in Switzerland, 2.28% of the variation in length covaries with variation in F2, and, unsurprisingly, for Belgium this score is only 0.49%. In Figures 7 and 8, the mean length differences are plotted as a function of the mean F2 differences for each individual speaker.Footnote 22
Belgium F2 and length (r 2 = 0.0049)

Switzerland F2 and length (r 2 = 0.0228)

Figure 7 shows a weak negative correlation between length and F2 in Belgium, which reflects the fact that length can be present, even if the difference in quality is reduced. In contrast, for Switzerland the regression line in Figure 8 shows a positive correlation, meaning that, to some extent, large(r) F2 and length differences go hand in hand.Footnote 23
4. Discussion and conclusion
This section first contrasts the situation in the three Francophone countries, and then discusses the possible mechanisms involved in the initiation and propagation of the specific sound change under scrutiny in this paper.
4.1 France, Belgium and Switzerland
The PFC results presented in the previous sections allow us to characterise the low vowel contrast in three European French-speaking countries. As set out in the introduction, existing descriptions commonly note that, unlike in France, length in general plays a noticeable role in the vocalic system of Belgian and Swiss French, and this length is also of relevance for the /a/-/ɑ/ contrast in these varieties. For Walloon French, the F2 distinction is said to have virtually disappeared in the low vowel contrast, whereas descriptions are less explicit about the presence of a qualitative difference among the low vowels in Swiss French. Using corpus data, these general observations have been given empirical grounding, more fine-grained patterns have been detected and the developments in the different varieties have been compared.
As shown by previous research (e.g., Martinet Reference Martinet1957, Martinet and Walter Reference Martinet and Walter1973, Hansen and Juillard Reference Hansen and Juillard2011, Hansen Reference Hansen, Durand, Kristoffersen, Laks and Peuvergne2014, Berns Reference Berns2015), the timbre of the low vowels in France is changing, in the sense that the back vowel tends to merge with the front token. In the South of France, the contrast has been mostly neutralised, while in the Centre and North of the country, variation exists between speakers as to the degree of contrast maintenance in terms of F2 and/or length. If we compare the more recent findings of synchronic descriptions and apparent-time studies with the observations made several decades ago, it is highly likely that France is witnessing an ongoing change, which spreads naturally as the younger generations grow older.
The Belgian and Swiss contrasts each have their own specific properties. In Belgium, the qualitative difference has essentially disappeared,Footnote 24 as it has in the South of France. The low-vowel contrast of Belgian speakers primarily involves a robust length difference, stable across the genders and generations. In France the quantitative difference was clearly less steady across the different regions and speakers, and it is therefore not unlikely that the Belgian contrast will survive in its current shape for some time to come. Even though robust length cues can be found in all three Belgian samples, the geographical distance to France, orientation towards the North of France and/or contactsFootnote 25 with that region are highly likely to influence the exact shape of the contrast. That is, in comparison with Gembloux and Liège, Tournai most closely resembles the Northern French varieties: its F2 values are somewhat higher and its length differences somewhat smaller than in the other two Belgian samples. It could be the case that the data reflect the effect of levelling in the Tournai variety, or they could reflect a change in progress; future research and time will tell which possibility is correct.
In Switzerland, the situation is in some respects similar to Belgium, but in others quite different. As in Belgium, length is an essential parameter in the low-vowel contrast: in comparison with France, we also noted quite robust length cues in all three generations for the Swiss varieties. Still, low-vowel length in Switzerland differs from that in Belgium in two important respects. First, the Swiss situation seems to be not as uniform as in Belgium, as the length cues realised by the younger generations are shorter than those of the older speakers. On the basis of our apparent-time study, it is of course not possible to say whether this is due to the start of a trend where length reduction spreads as the younger generations age, or whether it is an effect of age-grading, but it is clear that although substantial length cues are still produced in the Swiss varieties by all generations, the pattern is not as universally strong across generations as it is in Belgium. The second difference resides in the fact (see Table 12) that larger length differences accompanied by (very) small F2 differences are less systematic in Switzerland than they are in Belgium. As in France, the larger length differences in Switzerland instead tend to combine with larger F2 differences. This immediately brings us to the F2 cue itself, which is still, contrary to the situation in both Belgium and France, quite a vital parameter in the Swiss low-vowel contrast.
As we have seen for Belgium, we would miss important considerations if we did not zoom in more closely on the three different samples, since there are differences between the surveys. The most pronounced low-vowel differences can be found among the speakers of Nyon, while Neuchâtel is moderate, and the patterns found in Geneva show more reduced contrasts. The Genevan length contrast is still considerably higher than in most surveys of France, but it is quite similar to the length contrast found in the Northern France city of Ogéviller. The scores of the frontness/backness difference realised by Genevan speakers quite closely resemble those of Parisian or Lyonnais speakers. As we have seen for the Belgian variety of Tournai, levelling of the contrast seems to be taking place. The human traffic between Geneva and Northern France, e.g., for work or shopping, the influence of hexagonal France spoken media such as radio and television, and the popularity and prestige of the neighbouring varieties in the North of France are all factors that may give the Genevan contrast its specific appearance.Footnote 26 Follow-up research is of course needed to determine to what extent these different factors apply.Footnote 27
All in all, the most significant difference between the three countries under discussion here seems to be that at this synchronic stage, contrary to the varieties of Metropolitan France, the Belgian and Swiss varieties are not (yet) involved in the same general merger of the two low vowel tokens. The Swiss contrast is characterised by pronounced length and F2 differences, while for Belgium, the length difference can be seen as a marker of the contrast.
These are the national tendencies, but perhaps even more importantly, the present study has shown that as far as the low vowels are concerned, one cannot speak of “the” Belgian or “the” Swiss contrast: political borders are not strict linguistic borders, and the low-vowel contrast too should be considered on a continuous scale of contrast reduction and maintenance.
4.2 Low vowel variation and change
We conclude by considering the nature of the (socio)linguistic variation we have explored above, and its actuation and transmission. We are witnessing a merger of the two low vowels, with the traditional parameters of vowel quality and quantity being reduced or maintained to different extents. The varieties in the most advanced stages of low vowel neutralisation are those of Southern France. Léon (Reference Léon1966: 64) observed in the 1960s that the contrast was most likely to be maintained in stressed position, but as the PFC data have shown, (strong) erosion is nowadays taking place in this context as well. Even though further research, including a larger variety of tokens and contexts, is required for absolute confirmation, it is highly likely that the situation has evolved from Léon's (Reference Léon1992: 87) observation that 97.6% of all lexical a tokens are realised as [a], to an even stronger presence of [a].Footnote 28 The merger that has clearly affected France, and that could possibly also involve Swiss and Belgian varieties in a more radical way in the future, is thus an unconditioned change that will eventually result in a vocalic system where the symmetry in the low vowel region is lost.
In his study on /ɔ/ fronting in Parisian French, Martinet (Reference Martinet1957) explains the shift from the back rounded vowel towards [œ] (e.g., joli [ʒɔli] ‘nice/pretty’ becoming [ʒœli]) in structuralist terms. In order to reduce the tension among the four back vowels in French ([u, o, ɔ, ɑ]), one of these back vowels may move towards the front region. As the pronunciation of /ɑ/ in the Parisian variety of French was close to [ɔ], and as the functional load of the existing contrast /ɔ/ ~ /œ/ was apparently not high enough to avoid a merger, /ɔ/ may have been fronted in certain sociolects. Fronting of /ɑ/ is also taking place in these varieties. As Martinet notes, this is not a direct effect of chain shifting, but is rather due to imported usage from speakers from outside Paris. At a given moment, the centralisation of the back vowel became widespread in the Parisian variety as well, making it the new pronunciation norm for the new generations.Footnote 29
The merger of the two low vowels in France is not only puzzling from a structuralist point of view, but is also challenging for a view adopting a principle of maximal dispersion (e.g., Liljencrants and Lindblom Reference Liljencrants and Lindblom1972, Lindblom Reference Lindblom, Ohala and Jaeger1986). Instead of keeping the contrasts in a particular sound inventory as dispersed as possible, the opposite is happening as contrasts are reduced or fully lost.Footnote 30 The perspective adopted by Ohala (Reference Ohala, Masek, Hendrick and Miller1981, Reference Ohala and MacNeilage1983, Reference Ohala, Breivik and Jahr1989, Reference Ohala1990, Reference Ohala and Jones1993) sheds a different light on the phenomenon. In his view, sound change is essentially non-teleological and its origin can be attributed to the speaker and/or the listener. If at some point, hearers “misperceive” the back vowel tokens as front vowels (independently of whether the contrast in the signal is reduced), the front vowel can gradually become the new pronunciation variant adopted by the speakers of the speech community. Even though the origin of variation is in itself non-teleological in Ohala's perspective, the sound change as such may of course spread on teleological grounds, because at a given moment, speakers may for reasons of style or social identification adopt the new pronunciation variant. If this results in a linguistic innovation that becomes sufficiently anchored in the speech community (i.e., “long-term stable variation”, Labov Reference Labov2001: 85), and the new form gradually becomes the dominant form, language change will be the eventual result.
Large-scale diachronic research is required to retrieve the historical reasons underlying the actuation of the low-vowel merger. At this synchronic stage, where the contrast has virtually disappeared in the South of France, and the different Swiss and Belgian varieties are each characterised by specific degrees of contrast maintenance or reduction, we can however suggest some social influences that may play a role in the further transmission of the change. That is, as we have seen, it is not just geographical proximity to the French border that determines whether or not the contrasts in Belgium and Switzerland resemble those in neighbouring varieties in France, but rather also the physical (i.e., mobility), mental, and cultural orientation towards certain varieties that causes speakers to accommodate to a specific variety, for reasons of identity and/or prestige. People in Geneva, for instance, may identify with the popular or prestigious variety of Paris. Related to this is the density of the social network of the speech community (Milroy and Milroy Reference Milroy and Milroy1993, Milroy Reference Milroy, Chambers, Trudgill and Schilling-Estes2004): if the ties within this network become less dense, speakers are more susceptible to language influences from outside their speech community. Density may be different for cities and villages in general, but also two cities or two villages may differ greatly from each other in the density of their respective speech communities.
The examination of the PFC data has provided an apparent-time image of the status of the low-vowel contrast in different varieties of French in France, Belgium and Switzerland. Longitudinal evidence is of course still required, preferably based on a representative social stratificationFootnote 31 and on a variety of speech tasks, involving different degrees of linguistic self-consciousness and self-monitoring (Labov Reference Labov1972: 208) in order to gain further insight into the actual long-term developments or stability of the Belgian and Swiss varieties, and the social factors involved.
It would also be informative to put these purely acoustic findings into a perceptual perspective: to what extent do listeners of the three countries run into difficulties when confronted with a low vowel, realised by a speaker of a different variety, in a potentially ambiguous context like Je vois la patte/pâte ‘I see the paw/dough’? Moreover, the results presented here suggest that listeners of the different varieties of French would have different best exemplars of each vowel, and it might be interesting to determine how their scores relate to each other.
The PFC data studied here have provided a picture of the pronunciation habits and “norms” related to the low vowel contrast of different French-speaking communities in three different countries. In fifty years' time, researchers can look back at this picture and determine to what extent it has become out-dated.
Appendix
Average absolute F2 differences (in Hertz) according to gender

Average absolute F2 differences (in Hertz) according to generation

Average absolute length differences (in milliseconds) according to gender

Average absolute length differences (in milliseconds) according to generation