Caffeine (1,3,7-trimethylxanthine) is one of the most widely consumed psychoactive substances worldwide, primarily found in coffee, tea and soda drinks(Reference Frary, Johnson and Wang1). As a potent adenosine receptor antagonist, caffeine exerts significant physiological effects across multiple organ systems. Caffeine has positive effects on both the cardiovascular and central nervous systems, and there is growing evidence suggesting it may have therapeutic potential for various related disorders, such as neurodegenerative diseases(Reference Alasmari2) and migraines(Reference Barbanti, Allais and Cevoli3). However, the relationship between caffeine and age-related eye diseases (ARED), a group of eye conditions that mainly include senile cataract, diabetic retinopathy (DR), glaucoma and age-related macular degeneration (AMD), remains incompletely understood, with conflicting evidence. While current evidence suggests a protective effect of caffeine consumption against senile cataract(Reference Jee, Kang and Huang4,Reference Qi, Zhang and Zhang5) , research on the link between caffeine and DR(Reference Alcubierre, Granado-Casas and Bogdanov6,Reference Shah, Cheong and Tan7) , intraocular pressure (IOP) and glaucoma has been less conclusive(Reference Chandrasekaran, Rochtchina and Mitchell8–Reference Yoshida, Ishikawa and Kokaze10). In addition, a systematic review and meta-analysis has shown that higher caffeine intake may deter the progression of AMD(Reference Electra, Theodoraliu and Lazarus11).
Caffeine is primarily metabolised in the liver by the cytochrome P450 isoenzyme 1A2 (CYP1A2)(Reference Butler, Iwasaki and Guengerich12,Reference Kot and Daniel13) , and the expression of CYP1A2 is regulated by the aryl hydrocarbon receptor (AHR) gene(Reference Cornelis, Monda and Yu14,Reference Nukaya, Moran and Bradfield15) . Therefore, genetic variations near the CYP1A2 and AHR genes are associated with plasma caffeine levels(Reference Larsson, Woolf and Gill16,Reference Woolf, Cronjé and Zagkos17) . The metabolism of caffeine exhibits substantial interindividual variability, largely attributable to genetic polymorphisms that affect the activity of the CYP1A2 enzyme, which mediates over 90 % of caffeine clearance. Specifically, variants in the CYP1A2 gene are associated with a reduced paraxanthine-to-caffeine ratio (indicating slower metabolism), elevated plasma caffeine concentrations and lower habitual caffeine consumption(Reference Cornelis, Kacprowski and Menni18). This reduced consumption likely reflects the fact that individuals genetically predisposed to slower caffeine metabolism require less caffeine to achieve the desired psychostimulant effects compared with those with faster metabolism. Consequently, genetic variants influencing CYP1A2 enzyme activity and its regulation by AHR serve as robust instrumental variables for investigating the lifelong impact of subtle variations in plasma caffeine levels. Therefore, studies focusing on plasma caffeine rather than coffee intake may provide a more accurate and nuanced understanding of the association between caffeine and ARED. However, such studies remain scarce.
Additionally, observational studies cannot infer causality, and randomised controlled trials are costly and hard to implement in chronic diseases. As an alternative, we used genetic variants related to caffeine metabolism within Mendelian randomisation (MR) analysis to investigate the potential causal effects of genetically predicted plasma caffeine levels on the risk of four types of ARED: senile cataract, DR, glaucoma and AMD. Given the complexity surrounding glaucoma, we further investigated the impact of genetically predicted plasma caffeine on both primary open-angle glaucoma (POAG) and primary angle closure glaucoma (PACG). Additionally, we performed a two-step MR to explore the potential mediating effect of IOP between genetically predicted plasma caffeine and glaucoma risk.
Methods
Study design
We employed a two-sample MR design using summary-level data from genome-wide association studies (GWAS). The study was conducted in two phases: Phase 1 assessed the associations between genetically predicted plasma caffeine and ARED (senile cataract, DR, glaucoma and AMD), while Phase 2 focused on the associations between genetically predicted plasma caffeine and two subtypes of glaucoma: POAG and PACG. Additionally, we evaluated the mediating role of IOP in the association between genetically predicted plasma caffeine and glaucoma. The study design in Figure 1 highlights the three key assumptions that underpin the causal interpretation of MR estimates. The genetic variants, specifically single-nucleotide polymorphisms (SNP), were used as IV (instrumental variables) to infer causal relationships between exposures and outcomes. The SNP should satisfy the following assumptions: (1) relevance: the IV (SNP) must be strongly associated with the exposure; (2) exclusion restriction: the IV must affect the outcome only through the exposure and (3) independence: the IV must not be associated with any confounders of the exposure–outcome relationship(Reference Emdin, Khera and Kathiresan19).
Study design overview. AHR, aryl hydrocarbon receptor; CYP1A2, cytochrome P450 1A2.

Data sources
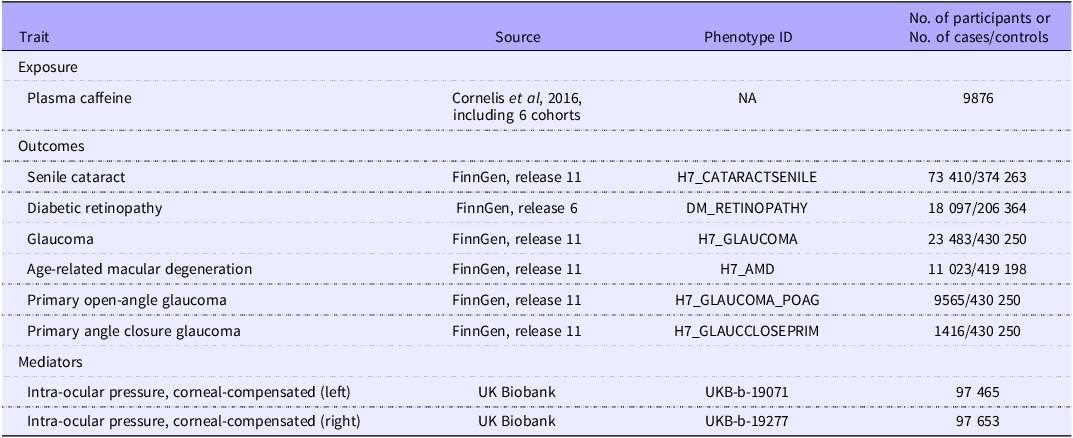
SNP associated with plasma caffeine were derived from GWAS involving 9876 participants (47–71 years of age) of European ancestry from six population-based studies(Reference Cornelis, Kacprowski and Menni18). Each study applied a different method for normalising the distribution of the metabolites, and all data were normalised and standardised to have a mean of 0 and an sd of 1 to facilitate meta-analysis(Reference Cornelis, Kacprowski and Menni18). More details can be found in Cornelis et al.(Reference Cornelis, Kacprowski and Menni18). All participants were required to fast before plasma caffeine levels were measured, and the GWAS data were adjusted for relevant covariates.
Summary data of the ARED outcomes were derived from the FinnGen study, a large population biobank based in Finland, providing the genome-wide association(Reference Kurki, Karjalainen and Palta20). The FinnGen study is a large-scale ongoing research project focused on genomics and personalised medicine, drawing from the abundant phenotypic archives of national longitudinal health databases and the extensive genotypic data amassed from biobank contributors. Each disease-specific analysis employed a case–control design within the cohort. Controls were individuals without the target disease diagnosis, excluding related diseases within the same category as detailed in online Supplementary Table 1. Control groups showed substantial overlap across analyses since individuals could serve as controls for multiple unrelated diseases. All cases were identified using International Classification of Diseases codes across multiple healthcare settings. Additional details are available at https://r11.finngen.fi/ and in online Supplementary Table 1. The GWAS associations were adjusted for age, sex, ten principal components and genotyping batch. Our final samples included 73 410 cases and 374 263 controls for senile cataract (median age: 72·9 years, 53·3 % females), 18 097 cases and 206 364 controls for DR (median age: 58·7 years, 48·0 % females), 23 483 cases and 430 250 controls for glaucoma (median age: 66·3 years, 57·7 % females) and 11 023 cases and 419 198 controls for AMD (median age: 76·2 years, 52·4 % females). We selected the version with the largest sample sizes, primarily FinnGen R11, except for DR, which was derived from FinnGen R6. Data for the main types of glaucoma in the older adults from FinnGen R11 involve POAG (9565 cases, 430 250 controls, median age 69·58 years, 55·2 % females) and PACG (1416 cases, 430 250 controls, median age 66·02 years and 58·1 % females).
We extracted the summary-level statistics from the GWAS for IOP in the European UK Biobank population from the Medical Research Council Integrative Epidemiology Unit (MRC-IEU) OpenGWAS project (https://gwas.mrcieu.ac.uk/)(Reference Elsworth, Lyon and Alexander21). The GWAS statistics of corneal-compensated IOP were available for the left eye (field ID 5262; n 97 465) and right eye (field ID 5254; n 97 653), separately. The IOP in each eye was measured directly using the Ocular Response Analyzer noncontact tonometer (Reichert Corp, Depew, NY, USA). The adopted corneal-compensated IOP was calculated from a linear combination of inward and outward applanation tensions(Reference Medeiros and Weinreb22), because it is less affected by corneal biomechanical properties(Reference Susanna, Ogata and Daga23). The details of data processing procedures for IOP can be found here (https://biobank.ndph.ox.ac.uk/showcase/refer.cgi?id=100236).
Details of each genetic instrument used in the analyses are summarised in Table 1.
Genome-wide association studies used as sources for Mendelian randomization analyses

Statistical analysis
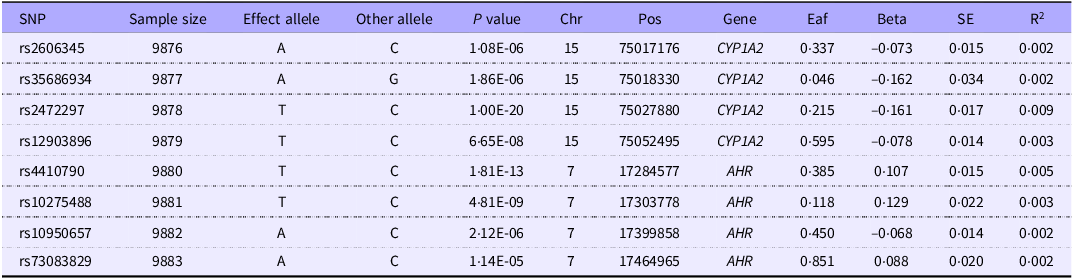
We restricted our analysis to SNP within 100 kb of the CYP1A2 and AHR gene regions known to play important roles in caffeine metabolism, following the recommendation of Stephen Burgess(Reference Woolf, Cronjé and Zagkos24). The selected variants demonstrated associations with plasma caffeine concentrations at P < 5 × 10⁻⁵, a threshold corresponding to Bonferroni correction for the 955 SNP identified by Cornelis et al. within the two gene regions(Reference Cornelis, Kacprowski and Menni18), an approach consistently employed as genetic instruments for caffeine metabolism in previous plasma caffeine studies(Reference Woolf, Cronjé and Zagkos17,Reference Dong, Xu and Linghu25,Reference Mi, Lin and Chen26) . A clumping algorithm with specific cut-offs (r 2 < 0·3 and 10 000 kb windows) was employed to eliminate linkage disequilibrium, thereby ensuring the selected SNP are independent. This strategy, used in several MR studies, employs genetic variation as a proxy for plasma caffeine levels(Reference Larsson, Woolf and Gill16,Reference Larsson, Woolf and Gill27) . Phenoscanner, a database of genetic associations, was used to ensure the SNP were not linked to other traits (confounders or outcomes) that could bias the results. The final chosen IV are listed in Table 2. To ensure consistency, we harmonised the data by removing palindromic and incompatible SNP(Reference Kamat, Blackshaw and Young28).
Final single-nucleotide polymorphisms as the proxy for plasma caffeine levels used in Mendelian randomisation analyses

SNP, single-nucleotide polymorphisms.
We used inverse-variance weighted meta-analysis to explore the causal relationship between genetically predicted plasma caffeine and ARED, POAG and PACG. SNP-specific Wald ratio, a key indicator to estimate causal effect, was calculated by dividing the outcome SNP estimate by the exposure SNP estimate. A multiplicative inverse-variance weighted random effects model was combined with the Wald ratios to produce a final estimate of the causal effect. The estimates were expressed in the standard deviation (sd) unit based on the standardised z-scores reflecting genetically predicted plasma caffeine changes for each effector allele in caffeine GWAS. Moreover, we employed a two-step MR to explore the mediation effect of IOP in the association between genetically predicted plasma caffeine and glaucoma in mediation analysis. The results were reported in OR with a 95 % CI.
We employed leave-one-out analyses to eliminate bias one by one based on the data categorised into groups CYP1A2 and AHR genes. We also explored heterogeneity between CYP1A2 and AHR genes. Importantly, no sample overlap was detected between the exposure and outcome GWAS, meaning that the sets of individuals included in the two studies were completely distinct, with no participants being present in both datasets. This approach can reduce bias from the winner’s curse and enable a more accurate assessment of the impact of exposure on the outcome(Reference Burgess, Davies and Thompson29). These results were visualised as the forest plot and leave-one-out plots. Besides, the robustness of mediation effects was tested using the Sobel test.
Bonferroni correction was conducted to address multiple testing and control the rate of false positives (Type I errors). Since six independent statistical tests were performed, a Bonferroni corrected threshold of P < 0·008 (P = 0·05/6) was used to indicate statistical significance, while a P value between 0·008 and 0·05 indicated a suggestive association. We calculated the statistical power, with a recommended value of 80 % indicating sufficient power (https://shiny.cnsgenomics.com/mRnd/)(Reference Brion, Shakhbazov and Visscher30).
All statistical analyses and visualisations were performed using R statistical software (version 4.3.1, R Foundation for Statistical Computing; https://www.R-project.org) and utilising the ‘TwoSampleMR’ and ‘MendelianRandomization’. The R package ‘forestploter’ was employed to generate specific figures. As the GWAS data used are publicly available and approved by the relevant ethical review committees, ethical approval was not required for this analysis.
Results
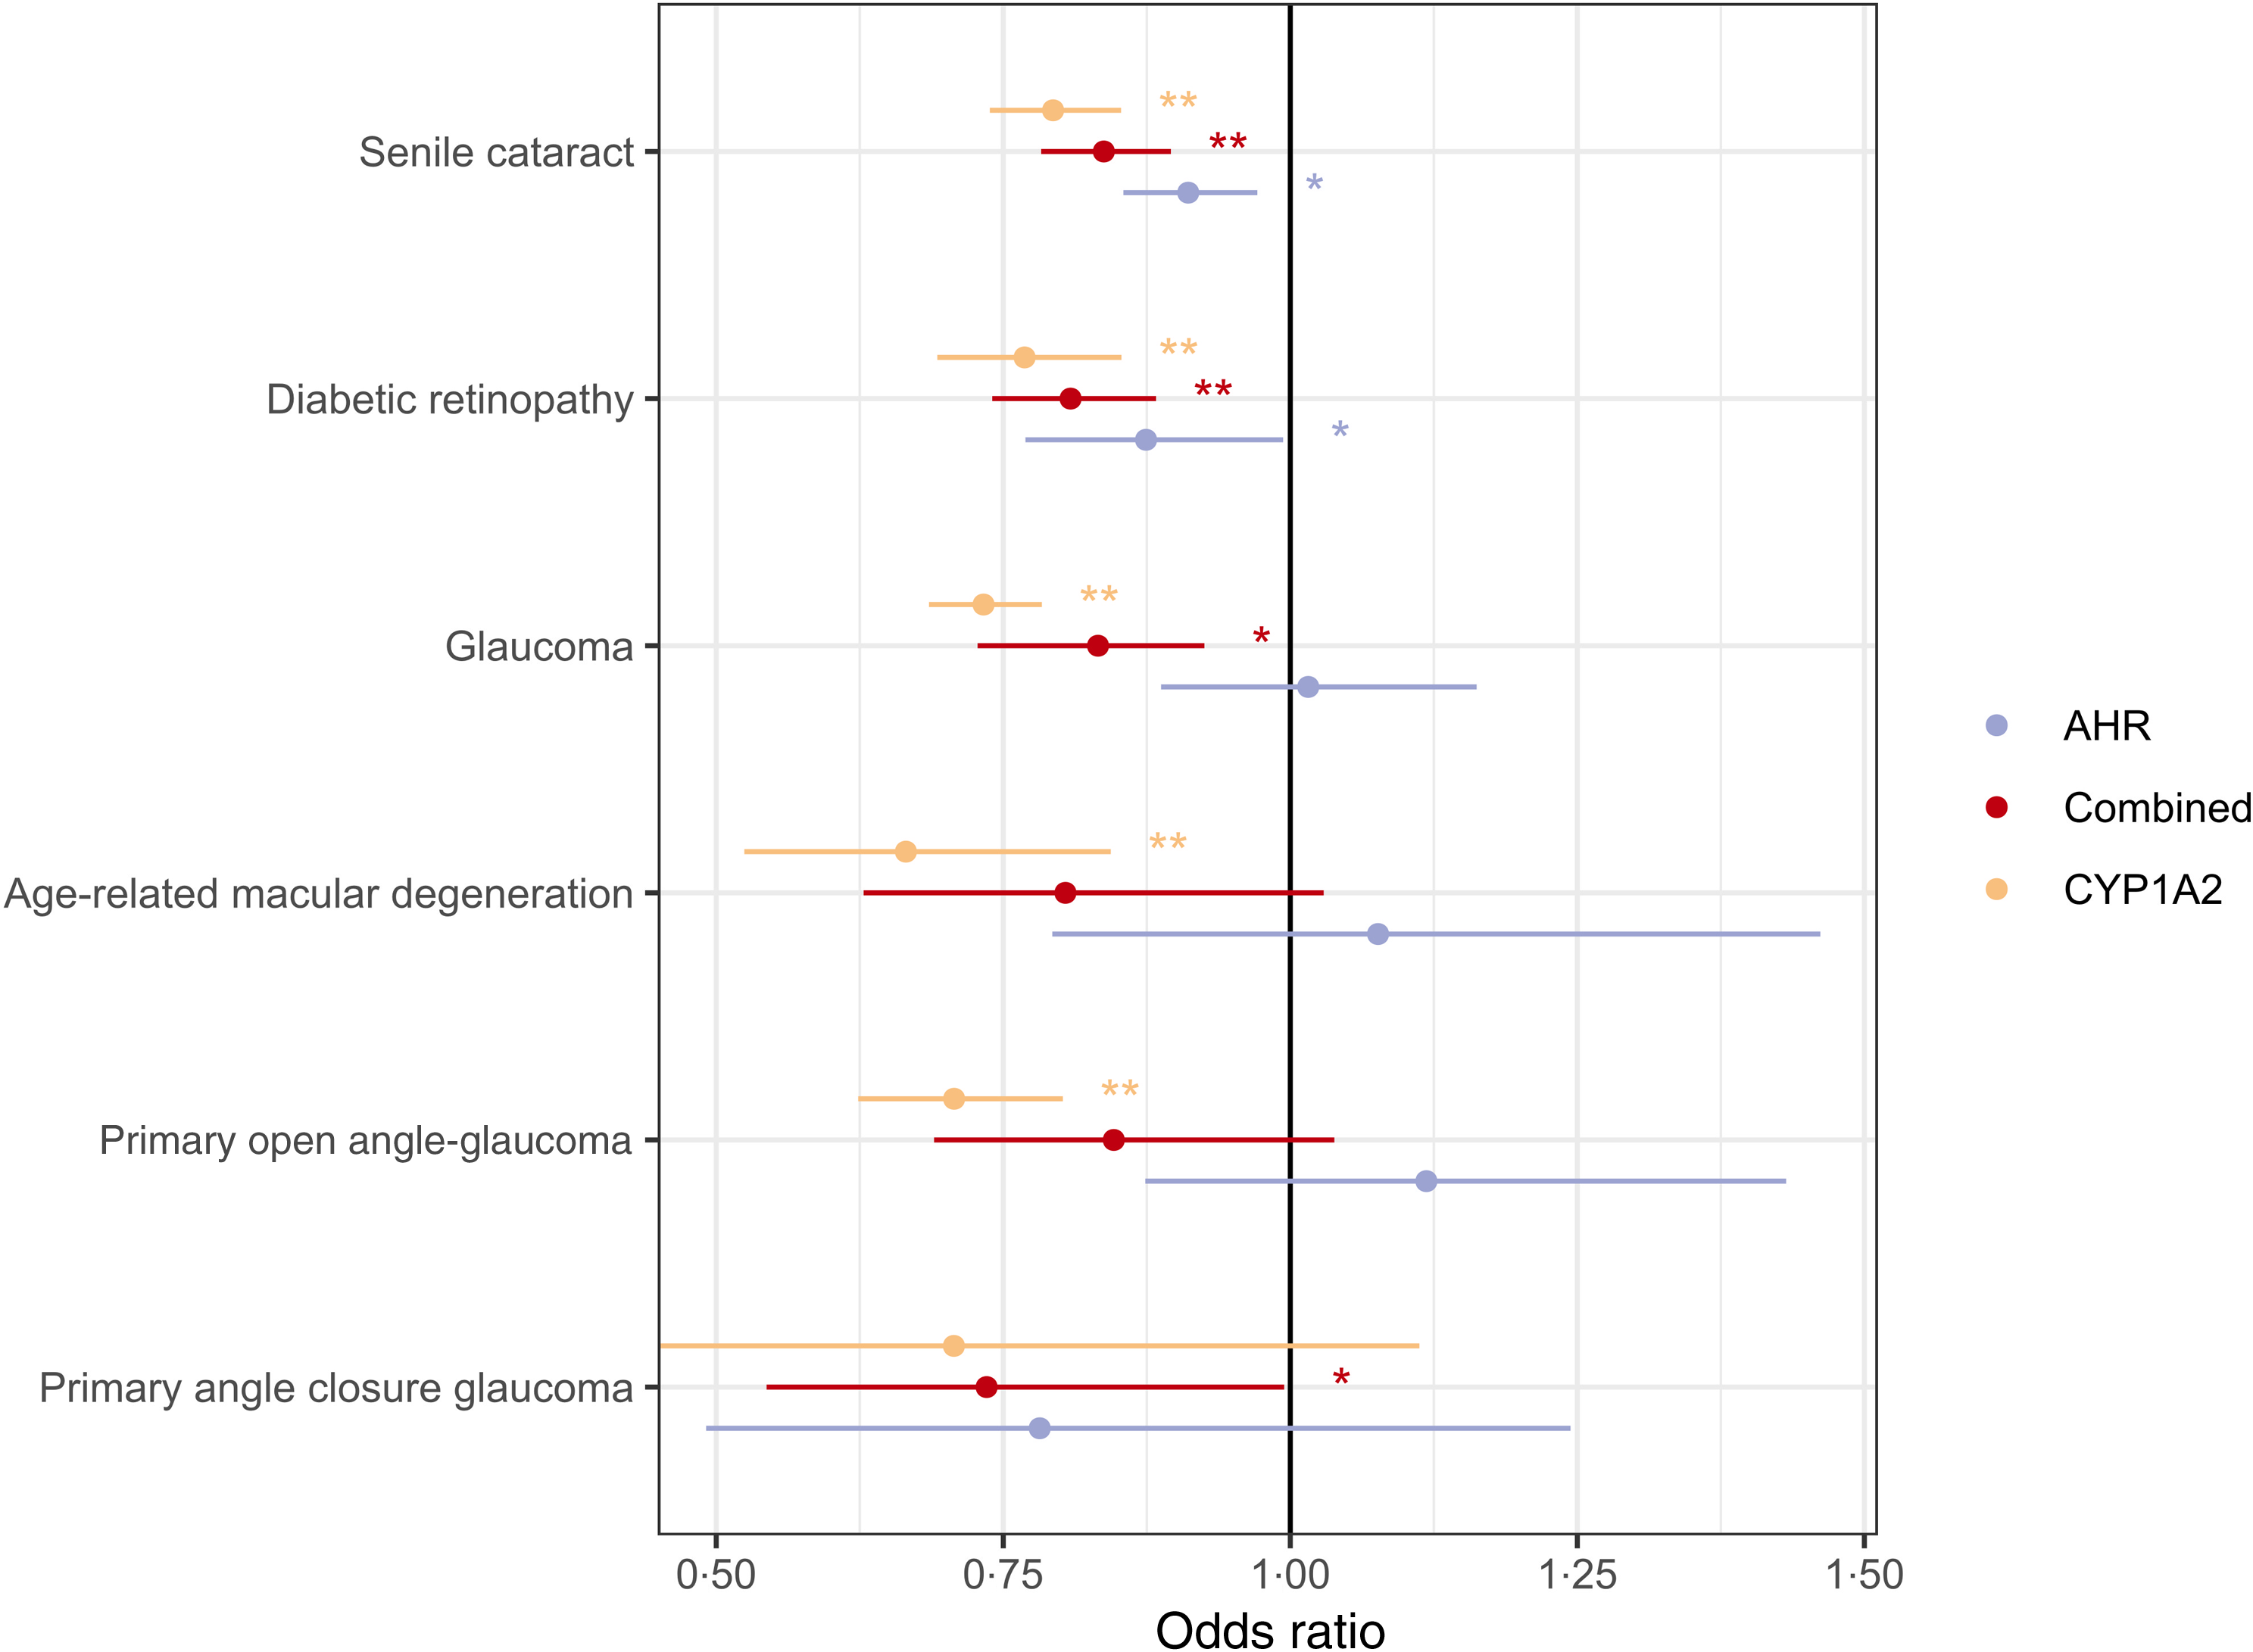
Our MR analysis revealed that genetically predicted plasma caffeine was associated with reduced risk of senile cataract (OR 0·84, 95 % CI 0·78, 0·90, P < 0·001) and DR (OR 0·81, 95 % CI 0·74, 0·88, P < 0·001) and a suggestive reduced risk of glaucoma (OR 0·83, 95 % CI 0·73, 0·95, P = 0·008). However, there was no significant association between genetically predicted plasma caffeine and AMD (OR 0·80, 95 % CI 0·63, 1·03, P = 0·083) (online Supplementary Table 2). The forest plots and the leave-one-out plots for AREDs are shown in Figure 2 and online Supplementary Figure 1, respectively.
Forest plots of the causal effect of plasma caffeine on ARED (senile cataract, diabetic retinopathy, glaucoma and age-related macular degeneration), primary open-angle glaucoma and primary angle closure glaucoma. AHR, aryl hydrocarbon receptor; ARED, age-related eye diseases; CYP1A2, cytochrome P450 1A2.

In further analysis of glaucoma subtypes, genetically predicted plasma caffeine was associated with a decreased incidence of PACG (OR 0·74, 95 % CI 0·54, 0·99, P = 0·046). No significant association was observed between genetically predicted plasma caffeine and POAG (OR 0·85, 95 % CI 0·69, 1·04, P = 0·110). Compared with the combined analyses, the subgroup analyses of CYP1A2 and AHR showed different results. Additionally, the SNP in CYP1A2 were associated with lower odds of senile cataract, DR, glaucoma, AMD and POAG. The SNP in the AHR were associated with lower odds of senile cataract and DR (Figure 2).
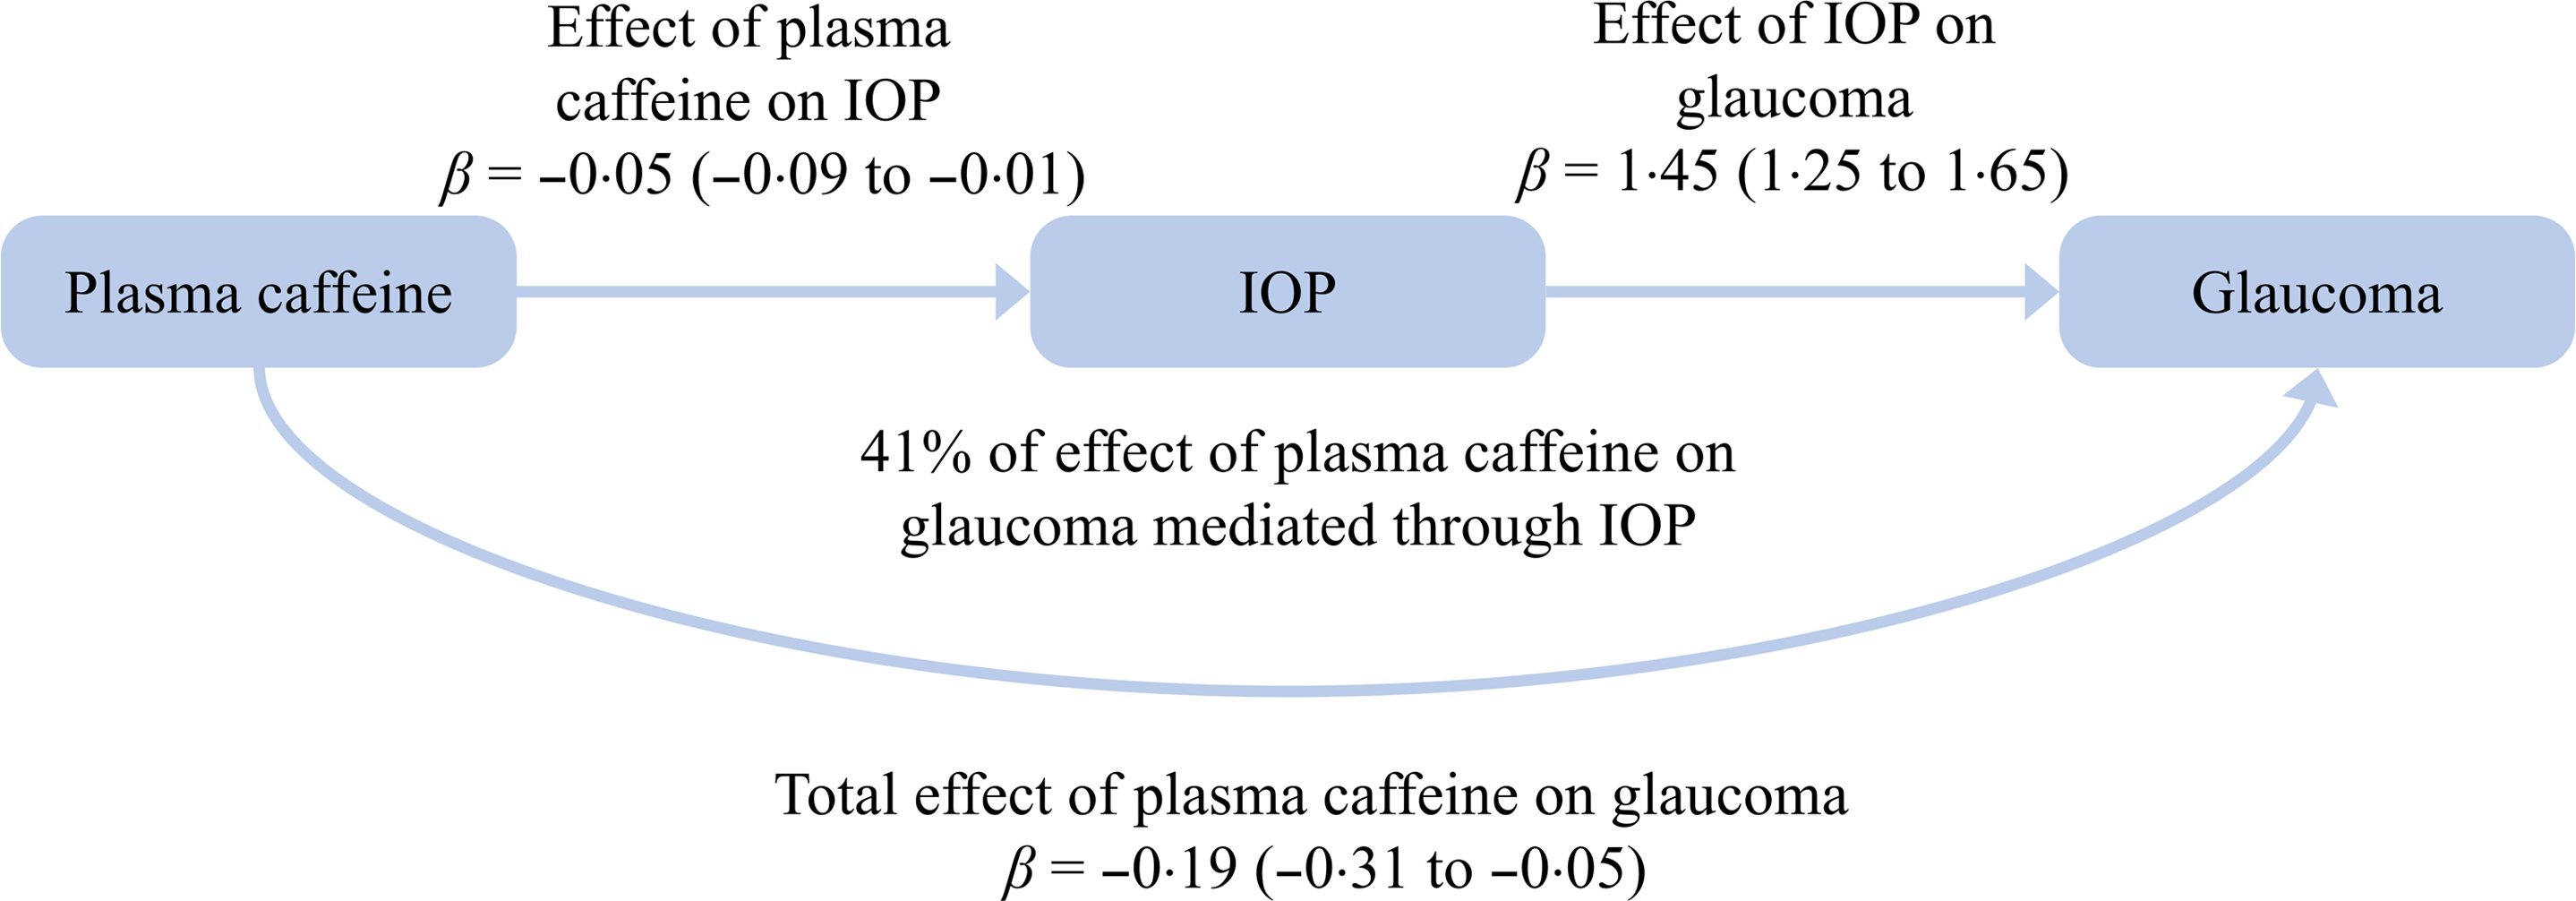
The results also showed that higher genetically predicted plasma caffeine concentrations led to decreased IOP (β = −0·05, 95 % CI −0·09, −0·01, P = 0·026) and the increased IOP led to glaucoma (β = 1·45, 95 % CI 1·25, 1·65, P < 0·001). Two-step MR analysis showed that each sd increase in genetically predicted plasma caffeine was associated with a β = −0·07 (95 % CI −0·14, −0·01) unit reduction in glaucoma risk, with IOP mediating this effect. IOP mediated 41 % of the protective effect of genetically predicted plasma caffeine against glaucoma. These results remained robust in further sensitivity analyses, indicating that the results were not affected by any single SNP (Figure 3). According to the power analysis, the power of MR in detecting the OR regarding genetically predicted plasma caffeine on four types of ARED (senile cataract, DR, glaucoma and AMD), POAG and PACG was 1·00, 0·99, 0·99, 0·98, 0·77 and 0·47, respectively.
Causal-directed acyclic graph showing the total effect of plasma caffeine on glaucoma risk and the effect mediated by intraocular pressure. The presented Mendelian randomisation effect estimates with their corresponding 95 % confidence intervals (shown in parentheses) are scaled per one standard deviation increase in plasma caffeine concentration. IOP, intraocular pressure.

Discussion
This two-sample MR study comprehensively evaluated the causal relationship between genetically predicted plasma caffeine and ARED. Our results revealed that higher genetically predicted plasma caffeine was associated with a lower risk of senile cataract, DR and glaucoma, but had no significant association with AMD. The secondary MR analysis found that higher genetically predicted plasma caffeine was also associated with a lower risk of PACG, but had no significant association with POAG. IOP mediated nearly half of the effect of genetically predicted plasma caffeine on glaucoma.
While the association between plasma caffeine levels and senile cataract has received less attention, observational studies focusing on coffee or caffeine consumption suggest a potential link. A large population study across forty-three countries showed a significant negative association between coffee per capita consumption and cataract(Reference Varma31). Recent prospective cohort studies further support an inverse dose–response relationship(Reference Jee, Kang and Huang4,Reference Qi, Zhang and Zhang5) . Our results suggest that plasma caffeine may partially explain the negative association between coffee consumption and cataract risk. However, another MR analysis showed that a higher genetically predicted coffee consumption (twelve SNPs) was associated with a higher risk of senile cataract(Reference Yuan, Wolk and Larsson32), which may stem from different exposure measures. Individuals with genetic variants in both genomic regions tend to metabolise caffeine more slowly and have higher plasma caffeine concentrations, leading to lower coffee and caffeine consumption(Reference Cornelis, Kacprowski and Menni18). Caffeine forms a stable antioxidant in the body and may prevent photochemical damage to the lens by scavenging oxygen free radicals(Reference Kronschläger, Löfgren and Yu33). Additionally, caffeine may also reduce blood sugar and lipids, inhibit markers of oxidative stress caused by metabolic abnormalities and then delay or reverse cataract formation by enhancing lens transparency(Reference Evereklioglu, Güldür and Alasehirli34).
Several recent cross-sectional studies suggest a protective effect of higher coffee consumption on DR(Reference Alcubierre, Granado-Casas and Bogdanov6,Reference Lee, Park and Kwon35) . However, research on retinal blood vessels has produced mixed results. Two interventional studies reported that caffeine intake (100 and 200 mg, respectively) caused acute retinal vessel constriction(Reference Okuno, Sugiyama and Tominaga36,Reference Terai, Spoerl and Pillunat37) . In early diabetes, the retina often exhibits reduced blood flow and capillary constriction. A recent systematic review concluded that the link between coffee and DR remains unclear(Reference Shah, Cheong and Tan7). Evidence supported that chlorogenic acid, a component of coffee, may protect against retinal degeneration(Reference Jang, Ahn and Jo38). However, research on caffeine’s specific effects on the retina is limited. One possible mechanism caffeine may be its ability to inhibit cell death induced by hyperglycaemia or hypoxia(Reference Maugeri, D’Amico and Rasà39). Additionally, genetic factors associated with higher plasma caffeine levels may also influence lipid metabolism. For example, certain alleles at the AHR locus linked to higher caffeine levels are also associated with lower LDL, total cholesterol and TAG levels(Reference Cai, Ma and Zhang40). These three lipid metabolites are positively related to the development of diabetic macular oedema(Reference Romero-Aroca, Baget-Bernaldiz and Fernandez-Ballart41), thus promoting DR progression(Reference Chou, Ma and Su42).
IOP is the only established modifiable risk factor for glaucoma, and many previous studies have examined the relationship between coffee or caffeine consumption and IOP levels. Some research suggests that drinking coffee may increase the risk of glaucoma associated with elevated IOP(Reference Jiwani, Rhee and Brauner9,Reference Vera, Redondo and Molina43) , while other research showed no link between them(Reference Chandrasekaran, Rochtchina and Mitchell8). Similarly, a study from Japan reported that male habitual coffee drinkers had lower IOP levels compared with non-coffee drinkers(Reference Yoshida, Ishikawa and Kokaze10). In a recent UK Biobank study, habitual caffeine intake showed a small inverse association with IOP but no overall connection to glaucoma(Reference Kim, Aschard and Kang44). However, in individuals with a high genetic risk for elevated IOP, higher caffeine consumption was linked to increased IOP and a higher prevalence of glaucoma(Reference Kim, Aschard and Kang44). The association between caffeine and different types of glaucoma varies by glaucoma subtypes. A prospective cohort study reported that while overall caffeine consumption was not linked to an increased risk of POAG, caffeine appeared to increase the risk in individuals with a family history of glaucoma(Reference Kang, Willett and Rosner45). A MR study showed a positive effect of caffeine intake on POAG(Reference Li, Cheng and Cheng46). These conflicting findings may be due to differences in study populations, genetic predispositions and cultural/lifestyle factors that could influence how coffee affects eye pressure and glaucoma risk(Reference Thorpe, Fontanillas and Pham47).
While studies have not directly examined the relationship between plasma caffeine levels and IOP or glaucoma, variations in how caffeine is studied (e.g. acute v. chronic consumption, type of caffeinated product) might explain conflicting findings. The relationship between caffeine and PACG has been less explored, but our study revealed a protective effect of higher genetically predicted plasma caffeine against PACG. One possible explanation is that caffeine reduces IOP, as supported by our mediation analysis. In addition, caffeine’s adenosine antagonistic properties may protect retinal nerves. Growing evidence supports the role of A2A receptor (adenosine receptor) mediated microglial activation in neurotoxicity. By blocking A2A receptors, caffeine may help reduce retinal ganglion cell loss by mitigating microglial dysfunction and inflammation(Reference Santiago, Baptista and Santos48). Another potential mechanism is related to changes in the thickness of the macular retinal nerve fibre layer. Research has found an inverted U-shaped relationship between caffeine intake and macular retinal nerve fiber layer thickness. This suggests that moderate caffeine intake may benefit the thickening of macular retinal nerve fiber layer, which is further linked to a reduced risk of glaucoma(Reference Yuan, Bulloch and Zhang49). The association between caffeine and glaucoma warrants further study.
Two large epidemiological studies found no evidence linking habitual coffee or caffeine intake to AMD risk(Reference Kumari50,Reference Tomany, Klein and Klein51) . Our study produced similar findings. However, exploratory micronutrient analyses suggest that increased caffeine intake may offer some protection against AMD(Reference Raimundo, Mira and Cachulo52). Given the non-linear association between coffee consumption and AMD risk, our MR analysis may have detected significant associations. This could also be owing to reverse causality or residual confounding, which are common challenges in traditional epidemiological studies. There is also a case report of acute AMD resulting from excessive caffeine consumption (ten cups daily), but the effect may be linked to the gradual changes in macular retinal nerve fiber layer thickness(Reference Sarraf, Rahimy and Fawzi53).
Our research has several advantages. First, the use of MR designs minimises reverse causality and potential confounding. Second, unlike previous studies that used coffee or caffeine consumption behaviour as a proxy, we focused on genetically predicted plasma caffeine levels as the exposure to explore their relationship with ARED from a drug-target perspective. Compared with behavioural GWAS, biomedical GWAS are less susceptible to residual confounding, which strengthens our findings(Reference Howe, Nivard and Morris54). Third, using massive GWAS data improves the statistical capacity of our analysis. However, this study has several limitations. First, despite using the largest GWAS data, we may have missed the weak association between genetically predicted plasma caffeine and ARED. Second, genetic confounding from other metabolites processed by CYP1A2 cannot be completely excluded. Third, certain criteria for MR sensitivity analyses cannot be applied to our cis-design methodology in environments with correlated variation, but we implemented a robust strategy to assess heterogeneity in MR estimates for AHR and CYP1A2 across different data sources. Fourth, since we used pooled data, we could not examine dose–response relationships between caffeine and ARED. Finally, our MR analysis was primarily based on the European population, which limits the generalisability of our results to other populations.
In conclusion, this study supports that higher levels of genetically predicted plasma caffeine have protective effects against senile cataract, DR and glaucoma, but have no significant effects on AMD. While the impact of genetically predicted plasma caffeine on different types of glaucoma varies by glaucoma subtypes, IOP may serve as a mediator in this relationship. These results suggest that caffeine could be explored as a potential preventive strategy for ARED. Further research is needed to determine whether caffeine supplementation could have clinically relevant therapeutic or preventive benefits.
Supplementary material
For supplementary material/s referred to in this article, please visit https://doi.org/10.1017/S0007114525105291
Acknowledgements
We thank all investigators for making their GWAS data available. We also acknowledge the participants and investigators of the FinnGen Consortium. All genome-wide association studies of plasma caffeine can be accessed at https://doi.org/10.18131/G3860C. The GWAS summary data of senile cataract, DR, glaucoma and AMD were downloaded from the FinnGen study (https://www.finngen.fi/en/access_results). Summary data for IOP were downloaded from the MRC-IEU consortium (https://gwas.mrcieu.ac.uk/)
Supported by the National Innovation and Entrepreneurship Training Program for College Students (202310343062X); the Science and Technology Innovation Activity Plan of Zhejiang University Student & XinMiao Talents Program (2024R413B069); the Wenzhou Medical University Honglan Innovation and Entrepreneurship Seed Fund awarded to Y. M. and the Foundation of Wenzhou Science & Technology Bureau (Grant no. Y20210997) to M. W. All funders had no role in the design, analysis, or writing of this article.
X. Z. and Y. M. devised the idea and designed the research. Y. C. collected and analysed the data. X. Z. wrote the manuscript. L. T. and M. W. supervised the study and revised the manuscript. M. W. had primary responsibility for the final content. All authors have read and approved the final manuscript.
The author(s) declare no conflicts of interest.