I. INTRODUCTION
Despite excellent electrical properties,Reference Solomon1 SiO2 is largely being replaced in the semiconductor nanoelectronics industry by new insulating dielectric materials that either have lower or higher values of dielectric constant (k). The replacement of SiO2 as the interlayer dielectric (ILD) in Cu interconnect structures with lower dielectric constant (i.e., low-k) SiOC:H materials has been driven primarily by the need to reduce capacitive signal propagation delays and power losses that threaten to limit device performance.Reference Maex, Baklanov, Shamiryan, Iacopi, Brongersma and Yanovitskaya2,Reference Volksen, Miller and Dubois3 Similarly, SiO2 has most recently been replaced as the gate dielectric in metal-oxide-semiconductor field effect transistor (MOSFET) devices by materials with a higher dielectric constant (i.e., high-k)Reference Wilk, Wallace and Anthony4 due to the need to increase the capacitance of the gate dielectric and to enable the continuation of Dennard device scaling.Reference Dennard, Gaensslen, Yu, Rideout, Bassous and LeBlanc5,Reference Robertson6 Although the implementation of both low and high-k dielectric materials by the industry has enabled impressive gains in device performance and the continuation of Moore's law,Reference Moore7,Reference Auth, Cappellani, Chun, Dalis, Davis, Ghani, Glass, Glassman, Harper, Hattendorf, Hentges, Jaloviar, Joshi, Klaus, Kuhn, Lavric, Lu, Mariappan, Mistry, Norris, Rahhal-orabi, Ranade, Sandford, Shifren, Souw, Tone, Tambwe, Thompson, Towner, Troeger, Vandervoorn, Wallace, Wiedemer and Wiegand8 the electrical properties of these low and high-k materials are reduced relative to SiO2, and there are significant electrical reliability concernsReference Ribes, Mitard, Denais, Bruyere, Monsieur, Parthasarathy, Vincent and Ghibaudo9–Reference Haase11 as the industry seeks to continue to implement these materials in future <15 nm and beyond technologies.Reference Kuhn12,13
Specific electrical reliability concerns for low- and high-k dielectrics include line–line interconnectReference Ou, Wang, He, Lu, Leung and Spooner14,Reference Wang, Chang-Liao, Wang, Chang, Wang, Lin, Lee, Chiu and Wu15 and gate dielectric leakage,Reference Yeo, King and Hu16,Reference Xu, Houssa, De Gendt and Heyns17 dielectric breakdown (V bd),Reference Chiang, Ko, Chen, Wu, Lu, Jang and Liang18–Reference Lombardo, Stathis, Linder, Pey, Palumbo and Tung20 time-dependent dielectric breakdown,Reference McPherson21–Reference Kauerauf, Degraeve, Cartier, Soens and Groeseneken24 stress-induced leakage currents,Reference Rosenbaum and Register25,Reference Pae, Ghani, Hattendorf, Hicks, Jopling, Maiz, Mistry, O’Donnell, Prasad, Wiedemer and Xu26 bias temperature instabilities,Reference Zhou, Tsetseris, Rashkeev, Fleetwood, Schrimpf, Pantelides, Felix, Gusev and D’Emic27,Reference Rahman, Agostinelli, Bai, Curello, Deshpande, Hafez, Jan, Komeyli, Park, Phoa, Tsai, Yen and Xu28 charge trapping,Reference Lauer, Sinha, Nichols, Antonelli, Nishi and Shohet29–Reference Bargallo Gonzalez, Rafi, Beldarrain, Zabala and Campabadal32 and a host of other charge-related buildup phenomena.Reference Sinha, Nichols, Sehgal, Tomoyasu, Russell, Antonelli, Nishi and Shohet33,Reference Bersuker, Zeitzoff, Sim, Lee, Choi, Brown and Young34 Despite the wide range of reliability concerns, a key ingredient in the models for all of these phenomena is some type of “defect” or “trap” in the dielectric material.Reference Ligatchev, Wong, Liu and Rusli35–Reference Chaves, Devine and Koltunski45 Tremendous resources and effort have been devoted to detecting and identifying the chemical identity and physical structure of such defects and traps in SiO2,Reference Stathis46–Reference Skuja48 and they continue to be the subject of significant research interest.Reference Anderson, Vedula, Schultz, Van Ginhoven and Strachan49 However, the nature of traps and defects in low- and high-k dielectric materials is still poorly understood and only recently has become the focus of some investigation. A more fundamental understanding of traps and defects in low- and high-k materials is therefore needed as the semiconductor industry seeks a transition to alternate MOSFET channel materials (Ge,Reference Heyns and Tsai50 InGaAs,Reference Heyns and Tsai50 and grapheneReference Kim, Choi, Kim, Cho and Chung51) and interconnect metals (grapheneReference Kim, Choi, Kim, Cho and Chung51–Reference Chen, Akinwande, Lee, Close, Yasuda, Paul, Fujita, Kong and Philip Wong53 and carbon nanotubesReference Chen, Akinwande, Lee, Close, Yasuda, Paul, Fujita, Kong and Philip Wong53). Integration of high-k gate dielectrics with Ge and III–V semiconductors has proven extremely challenging due to the presence of persistent interfacial defects and traps.Reference Tsai, Goel, Koveshnikov, Majhi and Wang54,Reference Lin and Robertson55 Likewise, the transport properties of graphene have been shown to be particularly sensitive to defects and charge traps in the substrate material.Reference Nagashino, Yamashita, Nishimura, Kita and Tonumi56,Reference Fan, Zheng, Chihaia, Shen and Kuo57
Despite numerous electrical-based measurements identifying a range of bulk and interfacial point defects and traps in low and high-k materials,13–Reference Chaves, Devine and Koltunski45,Reference Ngwan, Zhu and Krishnamoorthy58–Reference Shamuilia, Afanas’ev, Somers, Stesmans, Li, Tokei, Groeseneken and Maex70 very little is still known about the actual chemical identity and structure of these defects. A number of electron spin resonance (ESR) studies of low-k Reference Shamuilia, Afanas’ev, Somers, Stesmans, Li, Tokei, Groeseneken and Maex70–Reference Afanas’ev, Keunen, Stesmans, Jivanescu, Tokei, Baklanov and Beyer73 and high-k Reference Kang, Lenahan, Conley and Solanki74–Reference Wright and Barklie80 materials have provided some hints experimentally toward the identification of some point defects in these materials. However, theoretical investigations have so far provided the most insight into both the structure and chemical identity of the various possible point defects in high-k materials.Reference Bartram, Swenberg and Fournier81–Reference Nolan, Elliott, Mulley, Bennett, Basham and Mulheran106 Unfortunately, such theoretical investigations are still lacking for low-k dielectric materials. The almost complete lack of theoretical investigations on point defects in low-k materials therefore represents an additional challenge for low-k reliability research that is quite surprising, given the current overabundance of theoretical investigations on point defects in high-k materials.
For oxide-based high-k materials (such as Al2O3, HfO2, ZrO2, and TiO2), experimental electrical measurements predominantly detect the presence of defects/traps somewhere in the upper portion of the dielectric band gap. For example, detailed capacitance–voltage (CV) measurements on pyrolytic and atomic layer deposited (ALD) Al2O3 MOS capacitors by Harrari and RoyceReference Harrari and Royce40 and Sambuco-Salomone et al.Reference Sambuco-Salomone, Lipovetsky, Carbonetto, Garcia Inza, Redin, Campabadal and Faigon44 have indicated a bimodal distribution of traps at 2.2 and 2.6 eV below the conduction band minimum. Similarly, detailed current–voltage (IV) measurements by Yeh et al.Reference Yeh, Ma, Ramaswamy, Rocklein, Gealy, Graettinger and Min66 and Winslow et al.Reference Winslow, Johnson and Williams68 on ALD HfO2 films have shown the presence of electrical traps approximately 0.3–0.5 eV below the dielectric conduction band minimum. The observations of such traps by electrical measurements have been supported by several optical measurements that have also detected traps and defects at similar locations in the band gaps of high-k dielectric materials. For Al2O3 (E g = 7–8.8 eVReference French107,Reference Bersch, Rangan, Bartynski, Garfunkel and Vescovo108 ), optical transmission measurements on single crystal α-Al2O3 have shown the presence of prominent absorption bands at 6.1 and 4.8 eV within the dielectric band gap that closely correspond with the energy level of the previously mentioned electrical traps.Reference Lee and Crawford109,Reference Evans110 Likewise, spectroscopic ellipsometry measurements by a number of researchersReference Takeuchi, Ha and King111–Reference Price, Bersuker and Lysaght113 have also detected optical defects at 4.5–5.0 eV within the dielectric band gap of hafnia (E g = 5.7 eVReference Bersch, Rangan, Bartynski, Garfunkel and Vescovo108). These defects have all largely been attributed to oxygen vacancy-related defects based on the numerous theoretical investigations indicating that these are the most likely defects in the upper part of the high-k dielectric band gap.Reference Bartram, Swenberg and Fournier81–Reference Nolan, Elliott, Mulley, Bennett, Basham and Mulheran106
In contrast, ESR measurements of various high-k dielectric films deposited on Si have all primarily detected only Si dangling bond defects in the SiOx interlayer formed at the interface between the Si substrate and the high-k dielectric.Reference Kang, Lenahan, Conley and Solanki74–Reference Triplett, Chen, Nishi, Kasai, Chambers and Colombo78,Reference Stesmans and Afanas’ev114,Reference Stesmans and Afanas’ev115 Very few defects in the “bulk” of the high-k dielectric film have been detected by ESR, to date. The few defects clearly identified so far in the bulk of high-k dielectric films have not been attributed to oxygen vacancies and include other defects such as an  ${\rm{O}}_{\rm{2}}^ -$ peroxy center,Reference Kang, Lenahan and Conley75 NO2 radical,Reference Stesmans, Afanas’ev, Chen and Campbell116 undercoordinated Hf3+,Reference Kang, Lenahan and Conley75 and a P atom substituting at a Hf or Zr site.Reference Stesmans, Clemer and Afanas’ev117 More detailed ESR measurements by Wright and BarklieReference Barklie and Wright79,Reference Wright and Barklie80 on HfO2 and ZrO2 powders identified a number of different paramagnetic defect centers that were attributed to undercoordinated Zr/Hf3+,
 ${\rm{CO}}_{\rm{2}}^ -$ radicals, O−, and
 ${\rm{O}}_{\rm{2}}^ -$ groups, oxygen vacancies, and surface oxygen vacancy (SOV) clusters. The assignment of the oxygen vacancy defect centers was tentative due to a lack of agreement in the g-tensor experimentally observed and the values predicted by theory for an oxygen vacancy. However, as recently pointed out and demonstrated by Gillen et al.,Reference Gillen, Robertson and Clark95 this could be a result of a not so well-known error in density functional theory calculations, where the calculated wavefunctions for a defect center are overly delocalized. For other bulk high-k dielectrics such as Al2O3, oxygen vacancy defect centers have apparently only been observed by ESR for gamma- and neutron-irradiated sapphire crystals.Reference Lee and Crawford109,Reference Draeger and Summers118,Reference DuVarney, Garrison, Nilas and Spaeth119
For low-k SiOC:H materials, detailed IV measurements have indicated that electrical leakage is most likely due to trap-assisted Frenkel–Poole or Fowler–Nordheim tunneling mechanisms.13,Reference Ou, Wang, He, Lu, Leung and Spooner14 The analysis of temperature-dependent IV measurements has indicated the barrier height, for these traps range from 0.7–1.3 eV.Reference Ngwan, Zhu and Krishnamoorthy58–Reference Gischia, Croes, Groeseneken, Tokei, Afanas’ev and Zhao60,Reference Vilmay, Roy, Volpi and Chaix120,Reference Atkin, Shaw, Liniger, Laibowitz and Heinz121 More detailed vacuum ultraviolet spectroscopy measurements by Lauer have additionally shown the presence of traps in the upper portion of plasma enhanced chemically vapor deposited (PECVD) porous low-k SiOC:H dielectrics (k = 2.55–2.75) at roughly 1 eV below the conduction band minimum (E g ≅ 9 eV).Reference Zhou, Tsetseris, Rashkeev, Fleetwood, Schrimpf, Pantelides, Felix, Gusev and D’Emic27 However, spectroscopic ellipsometry measurements reported by Baklanov on lower-k (k = 2.3–2.5) SiOC:H dielectrics have also shown the presence of optical defects in the lower portion of the low-k dielectric band gap at 3–6 eV.Reference Baklanov, Zhao, Van Besien and Pantouvaki122 These defects have been attributed to carbon residues resulting from incomplete removal of the porogen during UV curing and have been linked to increases in leakage currents for these films.Reference Afanas’ev, Keunen, Stesmans, Jivanescu, Tokei, Baklanov and Beyer73,Reference Baklanov, Zhao, Van Besien and Pantouvaki122
In contrast to high-k dielectrics, ESR measurements on porous and nonporous low-k SiOC:H dielectrics have pointed to a variety of different silicon and carbon dangling bond defects within the bulk of low-k materials.Reference Shamuilia, Afanas’ev, Somers, Stesmans, Li, Tokei, Groeseneken and Maex70–Reference Afanas’ev, Keunen, Stesmans, Jivanescu, Tokei, Baklanov and Beyer73 However, in most cases, the location of these defects within the low-k band gap and their correlation to electrical reliability are not clear. To complicate matters, further ESR studies have shown that additional defects can be created in low-k materials by downstream porogen removal and plasma etching processes that expose the low-k material to intense UV-VUV radiation, energetic ions, and chemically active radicals and neutrals.Reference Bittel, Lenahan and King123–Reference Sinha, Ren, Nichols, Lauer, Tomoyasu, Russell, Jiang, Antonelli, Fuller, Engelmann, Lin, Ryan, Nishi and Shohet127 These process-induced defects may not be present or dominant in the as-deposited material. Accordingly, understanding the exact nature of the electrical point defects in low-k materials fully integrated into actual metal interconnect structures is quite complicated and difficult to unravel.
As a direct connection between the chemical identity, structure, and energy level of point defects in both low and high-k materials has yet to be made using electrical, optical, and paramagnetic resonance measurements, an alternative approach has been attempted utilizing standard surface sensitive analytical spectroscopies. Specifically, reflection electron energy loss spectroscopy (REELS) in combination with Auger electron spectroscopy (AES) and Ar+ sputtering has been utilized to both determine the band gap and detect subgap surface defect states in low- and high-k materials. REELS and photoemission-based EELS have recently been used with great success in measuring the surface band gap of amorphous high-k Reference Miyazaki128–Reference King, French, Jaehnig, Kuhn, Boyanov and French135 and low-k Reference King, French, Jaehnig, Kuhn, Boyanov and French135–Reference King, French, Bielefeld, Jaehnig, Kuhn, Xu and French137 materials. More recently,Reference King, French and Mays138 the authors have also demonstrated that REELS is sensitive to defects induced on the surfaces of Ar+ sputtered low-k dielectric materials that bear a striking resemblance to SOV defects identified by REELS on single crystalline Quartz (0001) and related oxide surfaces two decades earlier.Reference Bart, Gautier, Duraud and Henriot139–Reference Wu, Truong and Goodman148
In this study, combined REELS, AES, and Ar+ sputtering experiments have been extended to several crystalline and amorphous high-k dielectric materials (Al2O3, HfO2, ZrO2, and TiO2) that are currently of interest for various electronic applications. More detailed measurements and analysis on porous and nonporous low-k materials are also presented. It will be demonstrated that REELS is capable of determining both the width of the band gap and the relative position of surface defects for both low-k and high-k materials. The REELS measurements show that Ar+ sputter-induced defects reside primarily in the upper portion of the band gap for both low and high-k dielectric materials and correspond with a decrease in surface oxygen content as determined by AES. Comparison of the relative position of the induced surface defects and the observed changes in surface stoichiometry with the numerous theoretical studies for defects in SiO2 and high-k dielectric materials suggests that these defects are likely SOVs. These observations therefore provide a possible link between the numerous electrical measurements and theoretical calculations on high-k materials pointing to oxygen vacancies as the dominant reliability-limiting defect centers. Likewise for low-k dielectrics, these measurements suggest that the identity of the defect/traps contributing to electrical leakage may also be due to oxygen vacancy/silicon dangling bond defects.
II. EXPERIMENT
The low-k and high-k dielectrics utilized in this study were all deposited on 300-mm diameter (100) Si wafers using industry-standard high-volume manufacturing tools and processes. As previously described,Reference King and Gradner149–Reference Andideh, Lerner, Palmrose, El-Mansy, Scherban, Xu and Blaine152 plasma enhanced chemical vapor deposition (PECVD) was utilized to deposit 100–300 nm thick porous and nonporous low-k SiOC:H dielectrics with k ranging from 2.3–3.2. Porous low-k dielectrics were formed by intentionally incorporating a second phase “porogen” material that was removed post deposition utilizing either UV or electron beam cure.Reference Jousseaume, Zenasni, Favennec, Gerbaud, Bardet, Simon and Humbert153,Reference Bailey, Mays, Michalak, Chebiam, King and Sooryakumar154 Atomic layer deposition (ALD)Reference Miikkulainen, Leskela, Ritala and Puurunen155,Reference Kim, Lee and Maeng156 was used to deposit 25-nm thick Al2O3, HfO2, TiO2, and ZrO2 films with k > 9. The single side polished crystalline SiO2, Al2O3, and TiO2 substrates were purchased from MTI Crystals and examined as received.
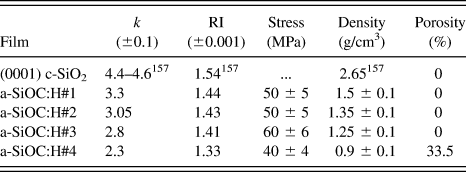
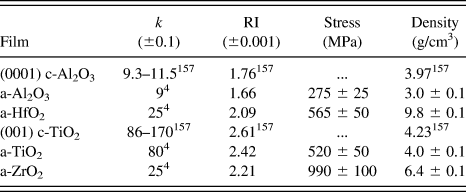
Tables I and II summarize some of the key material properties for the low and high-k dielectric materials investigated in this study including dielectric constant, refractive index, intrinsic film stress, mass density, and porosity.Reference Haynes and Haynes158 Additional details concerning the PECVD and ALD processing and thin film measurements have been previously reported elsewhere.Reference King and Gradner149–Reference Andideh, Lerner, Palmrose, El-Mansy, Scherban, Xu and Blaine152
Summary of properties for PECVD a-SiO2 and low-k a-SiOC:H thin films investigated in this study. RI = refractive index at 673 nm.

Summary of properties for ALD high-k thin films investigated in this study. RI = refractive index at 673 nm.
The low and high-k samples were transferred ex situ to a VG Microlab 350 AES system (VG Scientific, Ltd., West Sussex, UK) for REELS analysis. The details of this system and the REELS experiments have been previously described in detail.Reference King, French, Jaehnig, Kuhn, Boyanov and French135,Reference King, French and Mays138 Briefly, a typical REELS measurement consists of exposing a surface to a narrow energy beam of electrons and energy analyzing the reflected/backscattered electrons. The resulting REELS spectra are composed of both elastically and inelastically backscattered electrons. The intensity of the elastically scattered electrons is typically several orders of magnitude larger than the inelastically scattered electrons and creates a large peak at zero energy loss in the REELS spectra that is typically referred to as the elastic peak. Several physical mechanisms can lead and contribute to the creation of inelastically scattered electrons in REELS spectra including excitation of surface plasmons, ejection of core level electrons, and the creation of Auger electrons.Reference Zangwill159 For REELS band gap measurements, one is interested in another possible inelastic loss event, where backscattered electrons lose a finite amount of energy due to exciting valence electrons into the conduction band of the dielectric. Due to the lack of available electron states between the valence and conduction bands, the band gap of a dielectric material is ideally represented in REELS spectra by the energy difference between the center of the primary elastic peak and the onset of detected inelastically backscattered electrons.
The REELS spectra in this study were collected using 0.5 and 2.5 keV primary electron beam energies and a hemispherical electron energy analyzer operated at a resolution of ∼0.2 eV with a pass energy of ∼8 eV. The full width half maximum for the primary electron beam (i.e., elastic peak) was ∼0.5 eV. The REELS spectra were collected with a shallow surface exit angle of 80° relative to the surface normal to improve surface sensitivity and reduce the intensity of the background, which, in the spectral region of interest, is primarily due to the inelastically scattered electrons in the low-energy tail of the elastic peak. Additionally, 0° exit angle spectra were collected to determine whether the shallow exit spectra were representative of the near-surface bulk of the sample. For the 0.5 keV electrons and the 80° exit angle, 95% of the signal was estimated to originate from the topmost 7–10 Å; for the 2.5 keV electrons and 0° exit angle, the sampling depth was estimated to be 40–60 Å depending on the density and composition of the material. These sampling depths were estimated from effective attenuation length calculations and generally increase with decreasing film density.Reference Powell and Jablonski157,Reference Jablonski and Powell160 Transient sample charging was evidently absent in these analyses. Neither the elastic peak nor the spectral features were observed to shift or broaden upon successive scanning (20 scans per spectrum). Static charging of the samples was ruled out by comparing the elastic peak and Si LVV Auger peak positions to their positions on a bare Si sample with only native oxide present. Based on these observations, significant electron-beam-induced damageReference Pantano and Madey161 of the low and high-k surfaces was also ruled out. A 3-keV Ar+ ion sputtering beam operating at 10 μA/cm2 was utilized to remove residual surface contamination and induce surface defects.
Due to the loss of translational symmetry in amorphous dielectrics, electronic states encroach into the otherwise empty density of states between the valence and conduction bands that typically define the band gap for a single crystalline material.Reference Zallen162 Accordingly, there is no “true” band gap for amorphous materials. However, a number of empirical measures have been established for delineating extended gap/defect states and determining the effective band gap of amorphous materials.Reference Mok and O’Leary163 This allows for a comparison of the band gap of amorphous and crystalline materials and the extension of the theoretical concepts developed for crystalline materials to their amorphous counterparts. In this study, the band gap for the a-SiOC:H thin films was determined from the raw REELS spectra by linearly extrapolating the leading edge of the loss spectrum to the elastic peak baseline similar to the method of Miyazaki.Reference Miyazaki128 The validity of this approach has been previously established via separate detailed measurements and comparisons with other optical-based techniques.Reference King, French, Jaehnig, Kuhn, Boyanov and French135 Features detected in REELS spectra below the band gap energy are treated as either extended states arising from the amorphous structure or more specific defect states.
III. RESULTS AND DISCUSSION
A. SiO2 and low-k SiOC:H materials
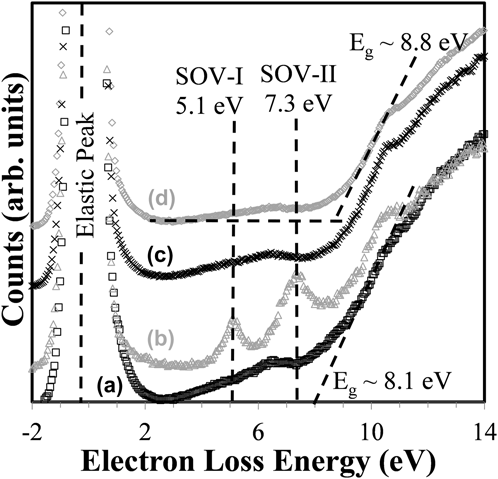
Figure 1 shows REELS spectra collected from an as-received single crystal (0001) quartz surface; the same surface after Ar+ sputtering; last, the same surface after sputtering and subsequent exposure to atmosphere, at two emission angles. All spectra were normalized to their elastic peaks to remove any differences due to primary electron beam intensity drift and have been offset vertically in the figure for clarity. Linear extrapolation of the leading edge of the loss for the as-loaded film indicates a surface band gap of 8.1 eV that is slightly less than the band gap reported for SiO2 based on other REELSReference Bart, Gautier, Duraud and Henriot139–Reference Poveda and Glachant142 and optical band gap measurements.Reference Weinberg, Rubloff and Bassous164,Reference DiStefano and Eastman165 Possible reasons for these low values will be presented and discussed later.
REELS spectra at 80° emission angle of (0001) quartz (a) as-received, (b) after Ar+ sputtering, (c) after Ar+ sputtering and subsequent exposure to atmosphere, (d) same as (c) with 0° emission angle. The two black, dashed vertical lines in the gap region show the positions of SOV defect states, which are most prominent in (b). The intersection of the black dashed lines fit to curve (d) indicates the onset of the loss spectrum used to calculate the band gap energy for this data set. The intersection of the dashed line fit to (a) with the x-axis marks the onset of the loss spectrum for (a).
For the Ar+ sputtered quartz surface, additional states centered at 5.1 and 7.3 eV are observed to appear in the band gap region as has been previously reported by others.Reference Bart, Gautier, Duraud and Henriot139–Reference Poveda and Glachant142 As mentioned in the Sec. I, these defect centers have been attributed to the creation of SOVs based on numerous experimental and theoretical investigations.Reference O’Reilly and Robertson166,Reference Rudenko, Keil, Katsnelson and Lichtenstein167 Further supporting the assignment of these defects to SOVs is the fact that they disappear completely after short exposure to atmosphere [Figs. 1(c) and 1(d)] or even after a long residence in the analysis chamber (discussed in greater detail below). After re-exposure to atmosphere, the surface band gap is measured to be 8.8 eV in the 0° emission spectrum, which has a greater sampling depth and is less affected by surface defect states. This band gap energy is much closer to the expected value for SiO2. Additionally, the leading edge of the loss spectrum in Fig. 1(d) is considerably sharper than the as-received or sputtered samples, suggesting that additional defect states extending into the gap from the conduction band were removed by sputtering and subsequent atmospheric exposure.
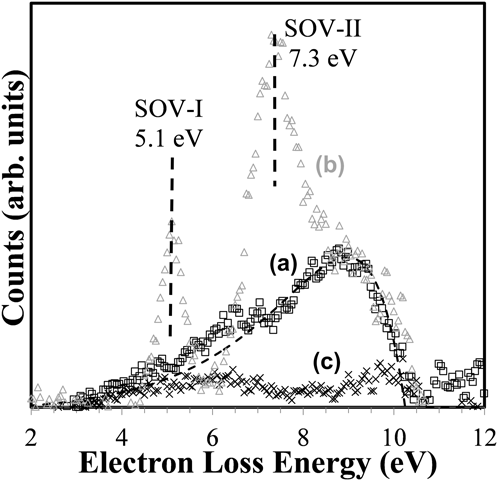
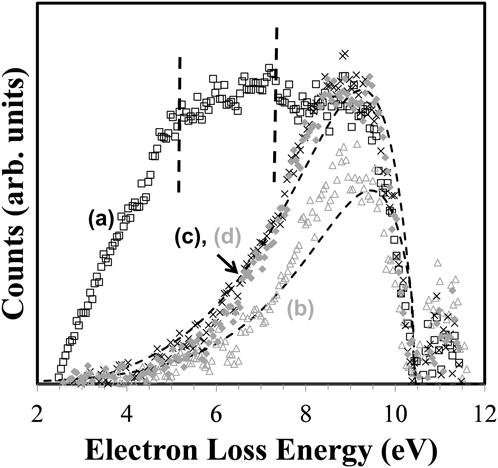
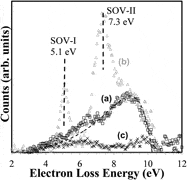
To better highlight the defect states present in each data trace, the 0° emission spectrum collected after sputtering and re-exposure to atmosphere was scaled to match the excitonic peak intensity at ∼10.3 eVReference Chang, Rohlfing and Louie168 and subtracted from each of the other three spectra. These difference spectra are shown in Fig. 2. The SOV states are dominant in the sputtered surface and not visible in the other two data traces as would be expected for surfaces exposed to atmosphere. Another broad feature peaking at ∼9.0 eV is most prominent in the as-received sample [Fig. 2(a)] but also appears to be present in the sputtered sample and, to a much lesser extent, the sputtered sample that was re-exposed to atmosphere [Fig. 2(c)]. This feature arises because of the additional exponential band-edge tails, or Urbach tails, present in these three spectra compared to the subtracted spectrum of Fig. 1(d).Reference Skuja, Kajihara, Ikuta, Hirano and Hosono169–Reference Cheng, Schiefelbein, Moore, Pierson-Stull, Smith and Sen171 The dashed line in Fig. 2 is a pure exponential tail fit to the data of Fig. 2(a) and demonstrates that almost all of the defect states present in the as-received quartz can be described by an Urbach tail. Such tails have been previously explained as representing the extension and smearing of the conduction band minimum into the band gap due to both static disorder (nonuniform bond-lengths or amorphous content) and dynamic disorder (exciton–phonon coupling).Reference Skuja, Kajihara, Ikuta, Hirano and Hosono169,Reference Sadigh, Erhart, Aberg, Trave, Schwegler and Bude172–Reference Pan, Inam, Zhang and Drabold176 In this bulk crystalline quartz sample, the Urbach tails could be due to incorporated surface contamination or damage from the surface finishing procedures during manufacture, as well exciton–phonon coupling. The tail feature was nearly eliminated relative to the 0° emission reference spectrum by sputtering and exposure to atmosphere, and it is chiefly a surface phenomenon in this sample (it is weaker with the greater sampling depth of the 0° emission spectrum than in the 80° emission spectrum; indeed, it disappears almost completely when the beam energy is increased to increase sampling depth further). The apparent confinement of this tail feature to the surface and the fact that it could be removed suggest that it was principally due to some static disorder at the surface. A final feature of the difference spectra worth noting is a broad band of states extending from 4 to 7 eV loss energies, which follow the same behavior as the Urbach tail (i.e., reduced by sputtering and re-exposure to atmosphere, and evidently a surface phenomenon). Modeling of defect energies has pointed to the possibility of defects in the 4–7 eV range due to interstitial O2 (unlikely for this bulk quartz crystal) as well as Si–H termination and bridging, which is possible.Reference Alkauskas, Broqvist and Pasquarello177 Another possible explanation is the presence of surface organic or halogen contamination, which would certainly be present on the as-received sample, and could be present in small quantities on the sample re-exposed to atmosphere. The effects of such airborne molecular contaminants on dielectric performance are well known.Reference Tamaoki, Nishiki, Shimazaki, Sasaki and Yanagi178
REELS spectra at 80° emission angle of (0001) quartz with 0° emission angle spectrum from Fig. 1(d) subtracted (a) as-received, (b) after Ar+ sputtering, and (c) after Ar+ sputtering and subsequent exposure to atmosphere. The vertical dashed lines indicate the position of the SOV states at 5.1 and 7.3 eV. The dashed curve shows the exponential fit to the onset of the loss spectrum for spectrum (a) to demonstrate the contribution of the Urbach tail.
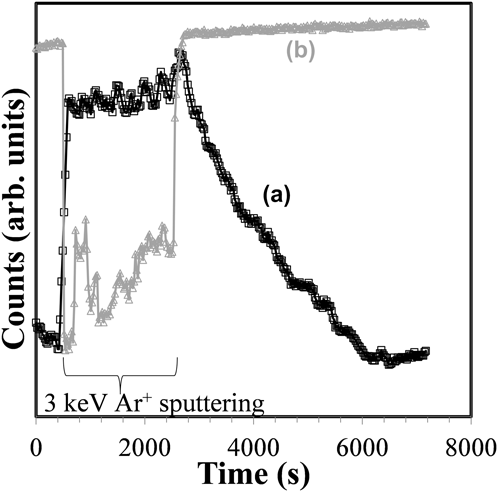
Figure 3 shows the summed intensity of the 5.1 and 7.3 eV SOV defect states as well as the elastic peak intensity as a function of time before, during, and after a prolonged Ar+ sputtering of the (0001) quartz surface. During sputtering, the defects' intensity rises nearly 400% as soon as the Ar+ bombardment begins, but then only increases slightly over the next 40 min. The elastic peak intensity during sputtering is decreased ∼40%, presumably by electrons lost to neutralization of Ar+ and to the retarding effect of the positive charge accumulated on the surface. When the Ar+ beam is turned off at ∼2400 s, the elastic peak intensity immediately returns to its full intensity. The defect state intensities begin a long decay back to undetectable levels. This experiment was conducted in a vacuum chamber with a base pressure around 10−9 Torr. In another experiment, the load lock gate valve was opened to bring the pressure in the main chamber up to ∼10−7 Torr, and the defect states were extinguished roughly twice as quickly. The fact that the rate of defect extinction was not 100x faster (as the time for monolayer coverage in the vacuum system should have been) suggests a diffusion or dissociation-limited step. This is expected due to the fact that O-vacancy creation inevitably extends below the surface and is the planned subject of future study. This experiment also provides the useful result that, within the detection limit of the spectrometer system configuration, the rate at which SOV defects are eliminated is greater than the rate at which they might be created under the primary electron beam.
Intensity of (a) SOV peaks and (b) elastic peak versus time before, during, and after extended Ar+ sputtering of (0001) quartz surface.
Figure 4 shows the REELS difference spectra of four as-received nonporous and porous low-k a-SiOC:H dielectrics with k ranging from 3.3–2.3. The reference spectrum subtracted from the raw data to generate the difference spectra was a defect-free a-SiO2 film spectrum with a sharp loss spectrum onset relative to these low-k dielectric films. Prior REELS measurements indicated that the surface band gap for these materials was 8.0 ± 0.4 eV, and despite the addition of carbon, still consistent with the band gap for a SiO2 network material.Reference King, French and Mays138 For the three nonporous films [Figs. 4(b), 4(c), and 4(d)], the strongest features in the as-received spectra are again well-fit by a pure exponential tail, as was the case for as-received quartz in Fig. 2(a). For the fit to data in Fig. 4(b), a sharper inverse-logarithmic slope could be used than in the other three data traces of Fig. 4, indicating lower overall static disorder in this film. For these three films, no discrete subgap defect states were evident.
REELS spectra of the gap region of several as-received low-k dielectric thin films: (a) k = 2.3, porosity = 33.5%; (b) k = 3.3, porosity = 0%; (c) k = 3.05, porosity = 0%; and (d) k = 2.8, porosity = 0%. These spectra were calculated by subtracting a relatively defect-free a-SiO2 spectrum to strip the elastic peak at 0 eV and excitonic peak at ∼10.7 eV. The vertical dashed lines indicate the position of SOV states at 5.1 and 7.3 eV. The dashed curves show the exponential fits to the onset of the loss spectrum for spectra (b) and (d) to demonstrate the contribution of Urbach tails.
The Urbach tail fit to Figs. 4(c) and 4(d) also fits the porous low-k film data [Fig. 4(a)] quite well closer to the conduction band minimum, but in the middle and deeper portion of the gap, other states predominate. The two vertical dashed lines in Fig. 4 indicate the location of the SOV states previously identified for the bulk quartz sample in Fig. 2(b). They appear to be present in the as-received porous low-k film [Fig. 4(a)] but are not clearly separated and appear weak. These defect states are expected to experience the same broadening mechanisms that yield Urbach tails on the conduction band minimum, which should make them less distinct in these amorphous films relative to crystalline quartz. Another feature in Fig. 4(a) is a broad defect band extending from ∼2–6 eV that has been previously attributed to carbon dangling bonds due to porogen residues.Reference King, French and Mays138
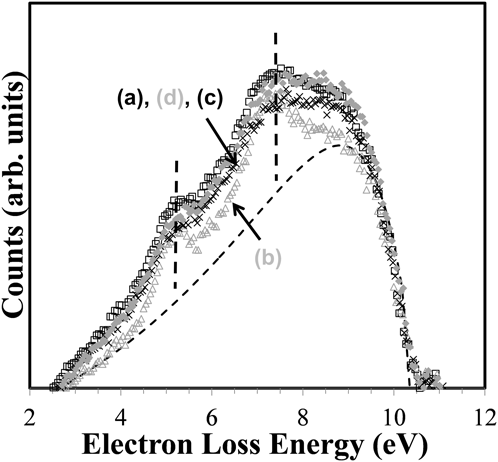
Figure 5 shows the difference spectra of the four low-k dielectric films of Fig. 4 after Ar+ sputtering to induce defects. The positions of SOV states are indicated by vertical dashed lines, and an example of a pure exponential fit to the Urbach tail is shown by the smooth dashed curve under Fig. 5(b). While these graphs are plotted on arbitrary ordinate scales, it should be noted that when normalized to the elastic peak intensity, the intensity of the defect states after sputtering are ∼4x greater than in the as-received state. Additionally, the inverse-logarithmic slope of exponential function fit to the Urbach tails of the sputtered samples is ∼3x that of the as-received samples, suggesting more extensive damage and disorder in these already-amorphous films.Reference Zammit, Gasparrini, Marinelli, Pizzoferrato, Agostini and Mercuri179,Reference Sundari180 Sample-to-sample differences in Urbach tail slopes from the REELS spectra are expected to mirror the more commonly reported optical absorption spectraReference Cheng, Schiefelbein, Moore, Pierson-Stull, Smith and Sen171,Reference Zammit, Gasparrini, Marinelli, Pizzoferrato, Agostini and Mercuri179–Reference Lopinski and Lannin181 slopes in their trend, but not absolute magnitude. Conversion of these REELS spectra to optical absorption coefficient spectra is beyond the scope of this article but presents an exciting avenue of future study for these films.
REELS spectra of the gap region of the low-k dielectric thin films shown in Fig. 4 after Ar+ sputtering. (a) k = 2.3, porosity = 33.5%; (b) k = 3.3, porosity = 0%; (c) k = 3.05, porosity = 0%; and (d) k = 2.8, porosity = 0%. These spectra were again calculated by subtracting a relatively defect-free a-SiO2 spectrum to strip the elastic peak at 0 eV and excitonic peak at ∼10.3 eV. The vertical dashed lines indicate the position of SOV states at 5.1 and 7.3 eV. The dashed curve shows the exponential fit to the onset of the loss spectrum for spectrum (b) to demonstrate the contribution of the Urbach tail.
Figure 5 shows that in all cases, Ar+ sputtering induces defect states at ≈5.1 and 7.3 eV similar to previous measurements for (0001) quartz and a-SiO2 surfaces. Their shape is broadened relative to crystalline quartz due to structural disorder of the films, similar to the broadening of the Urbach band-edge tailing. As previously discussed, this highly suggests that SOV defects are similarly created by Ar+ sputtering of low-k a-SiOC:H surfaces. Given the well-documented fragility of low-k materials and their susceptibility to the removal of terminal organic groups by plasma etch and clean processing,Reference Worsley, Bent, Fuller, Tai, Doyle, Rothwell and Dalton182–Reference Yamamoto, Asano, Ishikawa, Sekine, Hayashi, Sakai, Ohiwa, Takeda, Kondo and Hori184 a similar susceptibility to SOV creation by Ar+ sputtering should be expected. In fact, terminal organic removal/carbon depletion by Ar+ sputtering could also lead to the creation of additional related Si dangling bond defects. We also note that the observed oxygen vacancy defects were confirmed to be located within the near a-SiOC:H surface by the observation of a similar saturation in intensity with sputter time and a decrease in intensity with vacuum or air exposure as shown in Fig. 3 for (0001) quartz.
It is instructive to put these results in the context of a modern integrated circuit backend dielectric/metal layer stack. The results for low-k dielectrics show that the barrier for promotion of an electron from a TaN diffusion barrier Fermi level into the 5.1 eV defect state is only ≈1.3 eV. Likewise, promotion of an electron from the 5.1 eV defect state into the 7.3 eV defect state and then into the conduction band involves consecutive barriers of only 1.2 and 1.0 eV, respectively. These barriers are in favorable agreement with the leakage current measurements performed by Ngwan et al.Reference Ngwan, Zhu and Krishnamoorthy58 for low-k/Cu damascene comb capacitor structures fabricated utilizing a k = 2.9 a-SiOC:H ILD. Considering both Schottky and Frenkel–Poole type leakage mechanisms, Ngwan determined barrier heights of 0.7 eV for leakage predominantly along the interface between the ILD and the Cu capping/etch stop layer. We also note that based on a Fowler–Nordhein tunneling mechanism, Gischia et al.Reference Gischia, Croes, Groeseneken, Tokei, Afanas’ev and Zhao60 have determined a trap depth/barrier height of 1.05–1.17 eV for leakage through a k = 2.5, 25% porous a-SiOC:H ILD material. This trap depth is certainly consistent with the depth below the conduction band minimum of the uppermost oxygen vacancy defect observed in this study. Although the oxygen vacancy defects observed in this study are primarily surface defects, bulk oxygen vacancy type defects can be expected to have similar energy levels in the band gap. Prior research on UV cured low-k a-SiOC:H materials certainly points to their existence. However, this commonality does not preclude leakage through other types of bulk defects in the low-k a-SiOC:H materials.
In summary, we have demonstrated that the surface band gap of typical PECVD low-k a-SiOC:H dielectrics is similar but slightly reduced relative to PECVD a-SiO2 at 8.2 ± 0.2 eV. Ar+ sputtering of low-k a-SiOC:H dielectrics has been demonstrated to produce SOV defects with peak distributions at 5.1 and 7.3 eV within the band gap, as well as significant additional band tailing due to structural disorder. Defects attributed to carbon dangling bonds from porogen residues were observed to lie in the lower half of the band gap at 2–6 eV.
B. Hi-k dielectrics (Al2O3, HfO2, ZrO2, TiO2)
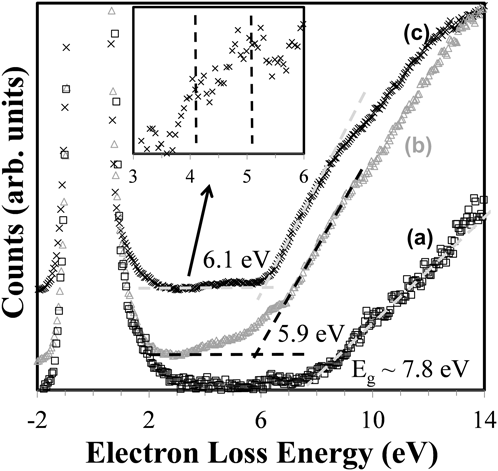
Figure 6 shows REELS spectra collected from a (0001) sapphire surface, as-received ALD Al2O3 thin film surface and the same thin film after Ar+ sputtering. The dashed line fits to each data series were used to calculate the onset of loss spectrum for calculating the band gap energy. The surface band gap deduced from the (0001) sapphire REELS spectrum is 7.8 eV, in agreement with previous optical measurements.Reference Afanas’ev, Keunen, Stesmans, Jivanescu, Tokei, Baklanov and Beyer73,Reference Gautier, Duraud, Pham Van and Guittet146,Reference Tahir, Kwon, Shin, Oh, Kang, Heo, Chung, Lee and Tougaard185 In the other two data traces of Figs. 6(b) and 6(c), the ALD Al2O3 film appears to have a much narrower band gap compared to the sapphire crystal, a feature that does not change even after Ar+ sputtering. The gap for these films appears to be 5.9 eV before sputtering, and 6.1 eV after sputtering, although the presputtering value is artificially low due to an extended tail and broad defect states in the band gap. This discrepancy is attributed to a combination of defect states close to the conduction band minimum, and to band gap narrowing that has been observed in amorphous Al2O3. The possibility of defect states near the conduction band minimum is supported by detailed IV measurements from Ruiz Agaudo et al.Reference Ruiz Agaudo, Govoreanu, Dong Zhang, Jurczak, De Meyer and Van Houdt62 that have shown a continuous distribution of traps ranging from 1.4–2.0 eV below the conduction band minimum in similar Al2O3 films in MOS capacitors. Similar results have been obtained by trap spectroscopy by charge injection and sensing.Reference Degraeve, Cho, Govoreanu, Kaczer, Zahid, Van Houdt, Jurczak and Groeseneken186 The band narrowing due to the amorphous nature of ALD Al2O3 films is supported by numerous theoreticalReference Afanas’ev, Keunen, Stesmans, Jivanescu, Tokei, Baklanov and Beyer73,Reference Liu, Clark and Robertson88,Reference Gautier, Duraud, Pham Van and Guittet146 and experimental studies.Reference Tahir, Kwon, Shin, Oh, Kang, Heo, Chung, Lee and Tougaard185,Reference Huang, Chang, Chang, Lin, Kwo and Hong187–Reference Geppert, Eizenberg, Ali and Datta189 The general explanation for this structure-induced band gap narrowing is that the coordination of Al and O atoms in the amorphous films is lower than in sapphireReference Liu, Clark and Robertson88 and that the ionic radius of O atoms is reduced, allowing greater interaction of O anions and a concomitant shift in the energies of O 2p states, which constitute the upper valence band. Modeling of the Al2O3 band gap for a hypothetical monoclinic structure, to represent the atomic coordination present in amorphous Al2O3,Reference Liu, Clark and Robertson88 gives 6.58 eV, which is much closer to experimental results.
REELS spectra of (a) (0001) sapphire, (b) as-received ALD Al2O3 thin film, and (c) ALD Al2O3 thin film after Ar+ sputtering. The intersection of the gray dashed lines in (c) and black dashed lines in (b) indicates the onset of the loss spectrum for the purpose of calculating the band gap energy for these data sets. The intersection of the gray dashed line fit to (a) with the x-axis represents the onset of the loss spectrum for (a). The inset shows an expanded view of the gap region of (c), showing the position of SOVs similar to those observed in SiO2.
Deeper in the band gap of the ALD Al2O3 thin films, two discrete defect peaks are evident (see inset of Fig. 6), similar to those observed for (0001) quartz and all SiO2-based low-k films discussed earlier. These defects appear at ∼4.0 and 5.1 eV loss energies after Ar+ sputtering and subsequently disappear with time suggesting that they too are SOVs. There are a number of plausible defect assignments available from the literature based on theoretical studies.Reference Stashans, Kotomin and Calais84–Reference Weber, Janotti and Van de Walle89 However, most of this theoretical work is for crystalline Al2O3 with a considerably wider band gap than is present in the samples of this study. It is not immediately clear how the position of the defect states identified in these theoretical studies might move with the contraction of the valence band position that accompanies the amorphous structure of these thin films.
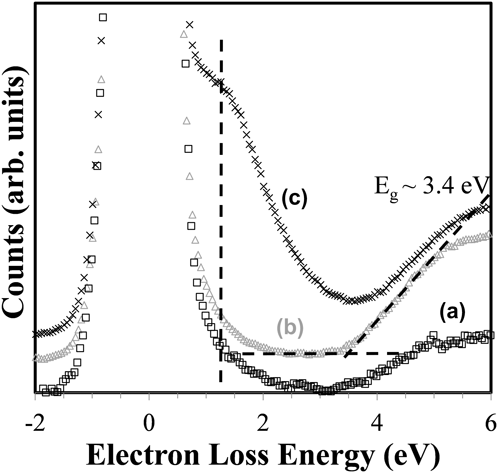
Figure 7 shows the REELS spectra for a (001) c-TiO2 surface, as-received ALD thin film TiO2, and the same film after Ar+ sputtering. The band gap energies measured from each data trace are 3.4, 3.5, and 3.9 eV for the crystal, the as-received ALD film, and the Ar+ sputtered ALD film, respectively. The band gap energies of the as-received film and the bulk crystal agree well with reported values in the literature.Reference Henderson, Epling, Peden and Perkins190–Reference Landmann, Rauls and Schmidt192 However, in the ALD thin film data, the appearance of a wide defect band centered at ∼1.4 eV after sputtering makes calculation of the energy gap by the extrapolation of the leading edge of the loss spectrum inaccurate. The broad defect band introduced in the film by sputtering is consistent with experimental reports of SOV defects, although the position in the present work is at a slightly higher energy than reported by Henderson et al.Reference Henderson, Epling, Peden and Perkins190 The discrepancy is likely due to two main factors: (i) the much broader energy distribution of the primary electrons in the present work, which partially obscures this defect with the elastic peak and also broadens all loss features and (ii) additional structural defects in the ALD film examined here relative to the crystal studied by Henderson, which give additional breadth to all features in the band gap.
REELS spectra of (a) (001) c-TiO2, (b) as-received ALD TiO2 thin film, and (c) ALD TiO2 thin film after Ar+ sputtering. The black, vertical dashed line indicates the mean position of the wide band of SOV defect states in (c). The intersection of the two black, dashed lines fit to curve (b) indicates the onset of the loss spectrum for the purpose of calculating the band gap energy.
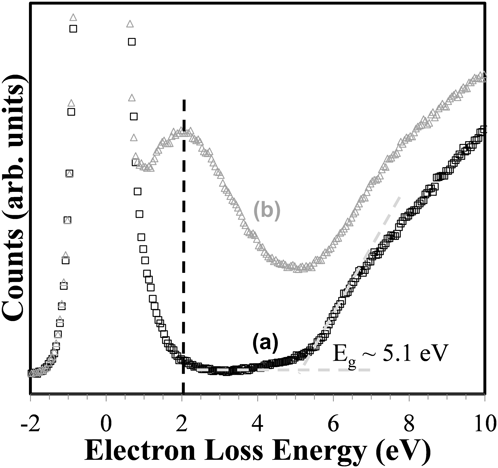
In Fig. 8 the REELS spectrum of the surface of as-received ALD thin film ZrO2 is shown along with the spectrum of the same film after Ar+ sputtering. The band gap energy from the as-received sample is ∼5.1 eV, which is close to but slightly less than the expected value of 5.5 eV obtained by UPS,Reference French, Glass, Ohuchi, Xu and Ching193 electron photoinjectionReference Houssa, Tuominen, Naili, Afanas’ev, Stesmans, Haukka and Heyns39 or energy loss from an O1s photoelectron peak.Reference Miyazaki128,Reference Huang, Chang, Chang, Lin, Kwo and Hong187 As with TiO2, the appearance of a wide defect band after Ar+ sputtering makes calculation of the energy gap inaccurate so the as-received sample is the most reliable for this purpose. A broad defect band centered at 2.0 eV appears after Ar+ sputtering, which is consistent with SOV-type defects modeled by Foster et al.Reference Foster, Sulimov, Lopez Gejo, Shluger and Nieminen100 Neutral oxygen interstitial defects were also modeled to have this energy but are deemed unlikely after Ar+ sputtering.
REELS spectra of (a) as-received ALD ZrO2 thin film and (b) ALD ZrO2 thin film after Ar+ sputtering. The black, vertical dashed line indicates the mean position of the wide band of SOV defect states in (b). The intersection of the two gray dashed lines indicates the onset of the loss spectrum for the purpose of calculating the band gap energy.

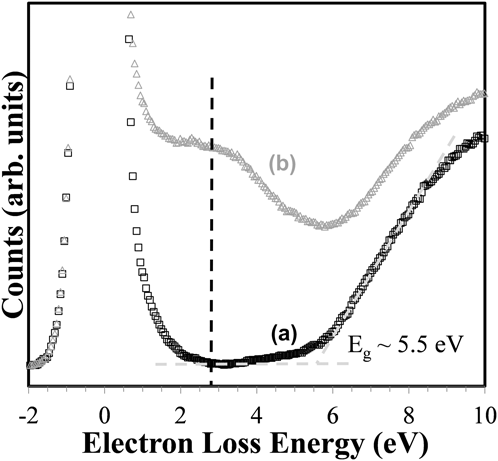
Figure 9 shows the REELS spectra of the surface of as-received ALD thin film HfO2 and the same film after Ar+ sputtering. The band gap width for the as-received sample is 5.5 eV, which is in line with other reported experimentalReference Jin, Oh, Kang and Cho132,Reference Jin, Oh, Kang and Tougaard194,Reference Jang, Jeong, Chung, Lee, Lee and Cho195 and theoretical values.Reference Jang, Jeong, Chung, Lee, Lee and Cho195,Reference Xiong and Robertson196 As with TiO2 and ZrO2, a wide defect band that appears after Ar+ sputtering makes calculation of the band gap energy unreliable from this data. The similar shape of the data trace in the vicinity of the onset of the loss spectrum and beyond suggests that the band gap energy of the sputtered surface is not significantly different from the as-received surface. The defect band is centered at 2.7 eV, which is in excellent agreement with theoretical calculations of SOV-type defect energies modeled by Foster et al.Reference Foster, Lopez Gejo, Shluger and Nieminen197
REELS spectra of (a) as-received ALD HfO2 thin film and (b) ALD HfO2 thin film after Ar+ sputtering. The black, vertical dashed line indicates the mean position of the wide band of SOV defect states in (b). The intersection of the two gray dashed lines indicates the onset of the loss spectrum for the purpose of calculating the band gap energy.
It should be noted that the assignment of SOV to the defects created in TiO2, ZrO2, and HfO2 is supported by AES measurements of the surface before and after sputtering, which shows a clear reduction of oxygen relative to the metal species. The preferential sputtering/depletion of oxygen from these oxide surfaces is consistent with the 2-fold coordination of oxygen versus the 4–8-fold coordination of the metal ion. Specifically, the number of broken bonds and energy required to create an oxygen vacancy are roughly half that required to create a metal-ion vacancy.
The presence of other defect states deeper or shallower in the band gaps could also be contributing to the broad defect band but obscured by the elastic peak, the broad SOV defect band, or broadened conduction band tail. Future work with the REELS technique will strive to resolve additional defect states through a combination of reduced primary beam energy spread, deconvolution of the primary beam energy spread from the spectrum, and improved elastic peak removal.
IV. CONCLUSIONS
REELS has been utilized to measure the band gap and detect Ar+ sputter-induced subgap defect states for high-k (Al2O3, HfO2, ZrO2, and TiO2) and low-k (nonporous and porous low-k a-SiOC:H) dielectric materials. The REELS measurements show that Ar+ sputtering consistently induces the formation of discrete defect states in the upper portion of the dielectric band gap, as well as Urbach band tailing due to structural disorder. Based on changes in the surface composition measured by AES and comparison to previous theoretical calculations and experimental observations, we conclude that the Ar+ sputter-induced defects are very likely SOVs and related to the numerous observed electrical and optical defects to which a host of reliability issues for low and high-k dielectric materials has been previously attributed.
ACKNOWLEDGMENTS
The authors would like to thank Drs. Ebony Mays and Tim Glassman of Intel Corporation for providing the samples utilized in this investigation. We would also like to acknowledge the support and encouragement from Drs. B. Tufts, J. Maiz, and B. Boyanov also of Intel Corporation during the course of this research.