


1. Introduction: Facing Down Factor Risk
Pension plan trustees are increasingly aware of the range of risks present in defined benefit pension plans. Volatile markets have led to volatile funding ratios, compounding the impact of falling interest rates and increasing longevity. This heightened awareness has led many plans to look at ways of managing these risks.
Another key risk has proved more difficult to manage. The security of participants’ benefits is often dependent on the assumption that any shortfall in a pension plan’s assets relative to its liabilities will be met by the company funding it, referred to here as the plan sponsor. Yet, there is a risk that a plan sponsor may fail. If a plan’s sponsor falls into insolvency when the plan is in deficit, then the plan’s participants are at risk of receiving reduced pensions. The risk of sponsor insolvency is often closely linked to the performance of plan assets – when firms are struggling, pension plan assets are more likely to be depressed.
This link between the health of a sponsor’s business and the funded status of its pension plan is as great a concern for the sponsor as for the plan participants. It creates the risk that when plan assets perform poorly, the need for funding to boost declining funded status will come at precisely the worst time for the sponsor. Funded status aside, a plan’s poor investment performance could exaggerate poor performance in the sponsor’s business as the corporate balance sheet must take into account plan investment results. Although insulation from the performance of the sponsor’s equity is provided by legislation, this provides incomplete protection.
Most existing literature does not address this problem directly, though the link between pension plan liabilities and corporate strength has been acknowledged for many years. Indeed, Graham & Dodd (Reference Graham and Dodd1934) suggest that when analysing securities, pension liabilities should be treated as a debt of the firm and pension assets should be treated as a firm’s assets. This link is supported by Ippolito (Reference Ippolito1985), who points out that pension plan deficits act as a type of debt for the sponsoring employer. Bagehot (Reference Bagehot1972) introduces the idea of the pensions-augmented balance sheet, thus reinforcing the idea of a financial link between what happens in the plan and to the sponsor, whereas Sharpe (Reference Sharpe1976) goes further by characterising the pensions deficit as a put option and the surplus a call option for the employer.
The issue of correlation between plan assets and corporate strength is addressed by Sweeting (Reference Sweeting2006) and later by Kemp (Reference Kemp2011). However, neither of these addresses the measurement of the risk or how investment strategies can be used to mitigate this risk.
Conversely, in this paper, we propose an approach to dealing with the risk that a sponsor may not be able to make up a shortfall in plan assets. We discuss a framework that can be used to develop a portfolio designed to protect against extreme adverse events for the sponsor, while at the same time maintaining a particular target rate of return. Key to this approach is the measure used to describe the financial health of the sponsor. One obvious variable would be the sponsor’s share price. However, as our framework is calibrated using historical data, there is a risk that this will reflect past idiosyncratic events. Further, the sponsor is unlikely to have experienced extreme stresses in the historical data, an example of survivorship bias. As an alternative, we therefore propose using an economic variable that can serve as a proxy for the risks faced by the firm.
Essentially, we think in terms of the economic exposure of the sponsor. The nature of this exposure varies from firm to firm – for example, an aircraft manufacturer might be negatively exposed to extreme increases in the price of aluminium, whereas a firm that mines aluminium ore will be negatively exposed to its opposite: extreme decreases. Similarly, an airline might be negatively exposed to the risk that oil prices rise sharply, whereas an oil producer will be concerned about collapsing oil prices. In this paper, we use the example of an oil producer to show how an asset allocation to hedge sponsor risk could be constructed.
We conclude that it is possible not only to measure the extent of such risks to the pension plan, but also to construct a portfolio that allows investors to mitigate the risk of extreme adverse movements in a key variable – in our example, the oil price – without sacrificing expected returns or portfolio efficiency.
2. Generating Investment Returns
In order to assess the extent of economic exposure risk, consistent time series are needed for various economic and financial variables. These variables are:
∙ the return series for the various assets in the pension plan assets;
∙ the return series for the pension plan liabilities; and
∙ the return series for the economic variable to which the sponsoring employer is sensitive.
We model all of these variables using a multivariate model similar to that described by Sheikh & Hongtao (Reference Sheikh and Hongtao2009). The framework we use is described in the Appendix. In particular, our model seeks to address serial correlation resulting from stale pricing; the non-normal shape of marginal return distributions; and the fact that the correlation between variables changes with the volatility of those observations. The first of these issues is dealt with using the unsmoothing algorithm developed by Fisher et al. (Reference Fisher, Geltner and Webb1994); the second is dealt with by assuming that the marginal distributions are skew-t, as described by Azzalini & Capitanio (Reference Azzalini and Capitanio2003); and the varying correlations are dealt with by using a t-copula, as described by Nelsen (1999). All of the parameters are derived from historical monthly observations for the 10 years to 31 December 2011, except for the expected returns that are taken from the 2012 J.P. Morgan Asset Management Long-Term Capital Market Assumptions. The expected return on oil is derived by assuming that the Sharpe ratio is equal to that of commoditiesFootnote 1. For simplicity, the pension plan liabilities are assumed to behave exactly like a long-dated US corporate bond in terms of their change in value over time.
3. From VaR to CVaR to CRCVaR
As we use non-normal return distributions, it makes sense to use measures of risk that allow for this non-normality. The measure we use when considering the risk within a portfolio is the conditional value at risk (CVaR; see Acerbi & Tasche, Reference Nelsen2001). The CVaR is calculated as the average portfolio return for a given level of confidence. For example, the CVaR95 would be defined as the average loss in a portfolio in the worst 5% of scenarios, based on forward-looking computer-run simulations using the non-normality model. It contrasts with the more conventional value at risk (VaR) – first formally developed by J.P. Morgan in 1994 (see Jorion, Reference Jorion2006) – which solely measures return at the fifth percentile.
The cross-return CVaR (CRCVaR) extends the portfolio CVaR concept to consider the return on the portfolio relative to a given factor, such as an asset or other economic variable. The CRCVaR95 is calculated as the average portfolio return when the lowest 5% of factor returns occur. Figure 1 shows the key steps in this process:
∙ the returns of both the factor and the portfolio are simulated;
∙ the simulations in which the worst 5% of factor returns are identified; and
∙ the average portfolio return in the simulations that correspond to the worst 5% of factor performances is calculated.
Steps to calculate the cross-return CVaR95. Source: Authors; for illustration only.

The distinction between CVaR and CRCVaR may be described as follows. Let us define CVaR as
 $${\rm CVaR}=E\left[ {X\!\mid\!X\,\lt\, x} \right]$$
where x represents the pension fund’s asset returns, and there exists q such that Pr[X|X<x]=q.
Then CRCVaR is defined as
 $${\rm CVaR}=E\left[ {X\!\mid\!Y\,\lt\, y} \right]$$
where y represents the expected return of the external factor being measured, and Pr[X|Y<y]=q.
From this definition, it follows that if the external factor is the same as the portfolio risk, then Y=X and CVaR=CRCVaR.
The oil CRCVaR95 of a portfolio is the average portfolio return during the steepest 5% of annual oil price declines. It provides a link between the performance of this specific factor and its implications for the performance of the portfolio as a whole. The concept of the oil CRCVaR is further illustrated in Figure 2, in which a hypothetical portfolio’s returns are plotted against the returns to oil. Figure 2 shows diagrammatically how to define the portfolio’s CRCVaR. The solid vertical line shows the cut-off point for the largest 5% of falls in the oil price, whereas the solid horizontal line shows the cut-off point for the largest 5% of falls in the value of the portfolio. Each represents a figure for the 5% VaR. The dashed lines show the average values of the points to the left of and below the respective solid lines, in other words the CVaR95. The fine dashed line shows the average portfolio return for the largest 5% of falls in the oil price, in other words the oil CRCVaR95.
Illustration of the CRCVaR concept. Source: Authors; for illustration only. VaR, value at risk; CVaR, conditional value at risk; CRCVaR, cross-return conditional value at risk.

Like VaR and CVaR, CRCVaR has the attraction that it can be applied to any number of underlying variables. In particular, it can be used to measure the risk in terms of investment return on the portfolio, in terms of the funded status (the ratio of plan assets to liabilities) or to surplus (the difference between plan assets and liabilities).
4. Integrating Sponsor and Plan Risk
CRCVaR allows for the consideration of the risk posed by joint plan and sponsor stress. The business of a pension plan sponsor, whose financial health is positively linked to the returns on a particular asset, is likely to slump under periods of low returns for the asset. It would be undesirable if the assets of the pension plan also performed badly at this time, or its funded status was otherwise adversely impacted, as the confluence of underperformance in both the sponsor’s business and the plan’s assets would restrict the ability of the sponsor to address any funding shortfall, precisely when the need for pension contributions would be heightened.
5. The Choice of Factor to Represent the Risk to the Sponsor
In this paper, we take the example of the pension fund of an oil company. We assume that the sponsoring company will be most at risk and therefore least able to support the pension fund when the price of oil drops unexpectedly. We therefore select the price of oil as an appropriate proxy for the economic risk facing the sponsoring company.
The most difficult aspect of this analysis is the selection of the appropriate risk factor. As we explain in section 1, taking the sponsoring company’s stock price as a proxy for sponsor risk is not appropriate, as the stock price captures the idiosyncratic characteristics of the sponsor and is unsuitable as a proxy for economic risk to the sponsor. In the case of a company that is reliant on a particular commodity for its source of revenue, this commodity’s price is often a suitable proxy: an aluminium company’s pension fund trustees will be concerned about the price of aluminium, and a company that exports cocoa beans will be exposed to the risk that the price of cocoa beans changes.
The problem becomes more complex for companies that do not have a single, well-defined risk factor for which it is straightforward to find a proxy. Even a simple case of having to take into account exchange rate risk can pose a challenge, as does the case of a sponsor that is subject to more than one risk factor. In these cases, one possibility is to define the risk factor as a linear combination of constituent factors.
Although it is possible to apply the framework described in this paper to complex risk factors, it is most adapted to simple cases where the sponsoring company is exposed to a single, readily measured risk factor.
6. Protecting a Long-Term Portfolio Against Asset Price Risk
This section shows how the CRCVaR measure of factor-specific risk can be integrated into the process of making asset allocation decisions. We continue with our example of a firm subject to the risk of falling oil prices. We first consider whether it is possible to minimise the portfolio’s CVaR. We then consider the equity allocation independently from the rest of the portfolio, before looking at whether it is possible to achieve the same portfolio return and portfolio CVaR while reducing the oil CRCVaR. Our analysis is based upon 10,000 simulations of the non-normality model, on a 1-year basis. Similar results should apply to a longer investment time frame.
Table 1 shows in its first column the asset portfolio of a representative pension plan, with a 55% allocation to equities, a 30% allocation to fixed income and a 15% allocation to alternative asset classes. The funded status is calculated as the ratio of the pension plan assets to the liabilities, with long Treasury bonds being used as a proxy for liabilities. The assumed starting funded status is 100% for ease of comparison. Below the portfolio allocations in Table 1, the portfolio’s expected return is reported, along with the portfolio CVaR95 (the expected return of the portfolio in the worst 5% of portfolio returns), and the portfolio oil CRCVaR95 (the expected return of the portfolio in the worst 5% of years for oil prices).
Reallocation between asset classes to strengthen downside protection.

The benchmark portfolio, as shown in the first column, maintains a positive oil CRCVaR95 of 0.6%. The 0.6% return suggests that a fall in oil prices would be detrimental to the portfolio, as it is markedly lower than the portfolio’s 4.6% expected return. Using the oil CRCVaR framework, we can consider whether it is possible to increase the portfolio’s oil CRCVaR95 while maintaining the portfolio’s current expected return. For investors who are also concerned about a portfolio’s CVaR, it is helpful to define the portfolio’s efficiency as being the expected return, divided by the CVaR:
 $${\rm portfolio}\,{\rm efficiency=}{{{\rm portfolio}\,{\rm expected }\,{\rm return}} \over {{\rm portfolio}\,{\rm CVaR95}}}$$
In this case, the framework allows us to consider whether it is possible to increase the portfolio’s oil CRCVaR while maintaining the portfolio’s efficiency, as defined above.
The second column reallocates the benchmark portfolio; the objective here is to increase the oil CRCVaR95, subject to the constraint that the expected return should not be less than the expected return of the benchmark portfolio. This second portfolio exhibits a reduction in the exposure to developed world equity and an increased exposure to emerging market equity and debt, US debt and several alternative asset classes. This reallocation maintains reasonable relative portfolio efficiency (as defined above), with a stable expected return and an increase in portfolio CVaR95 of 1.3 percentage points. Importantly, the oil CRCVaR95-funded status shows that the plan’s funded status would have improved during periods of low oil prices, increasing by 2.4 percentage points, from 96.9% to 99.3%.
6.1. Using an alternative equity benchmark to protect against economic exposure
A high exposure to oil CRCVaR risk would suggest that we could improve the performance of the portfolio not just by reallocation away from equities, as in Table 1, but by altering the allocation to the underlying sectoral exposure to the S&P 500Footnote 2. In this example, we consider a standalone portfolio of the S&P 500 Index, with no liabilities. Table 2 shows the market value weighting of each of the sectors within the S&P 500.
Market value weighting of the S&P 500 Index.

Source: Thomson Reuters.
6.2. Reverse optimisation procedure for sectoral expected returns
To ensure that our analysis in this section is forward looking, we rely on J.P. Morgan’s forward-looking Long-Term Capital Market Assumptions for each broad asset class. When modelling returns for the sectoral constituents of the equity index, however, it is unrealistic to assume that each sector’s expected return will match that of the index. Some equity sectors are more volatile than others or more highly correlated to others. We allow for this difference among the equity sectors by drawing on a framework first described by Sharpe (Reference Sharpe1974), which combines expected broad market returns based on long-term market views with observed asset class volatilities, plus correlations and market weights, shown in Table 2, to obtain expected returns for each individual asset class or, in this case, equity sector.
Let X i denote the relative market value weighting of sector i, for i=1, … , 10 and let E i denote the expected return on sector i. In addition, let C ij denote the covariance between returns on equity subsectors i and j. In this example, E i are the unknown variables, whereas E p represents the expected return on the S&P 500 Equity Index, as given by the J.P. Morgan Long-Term Capital Market Assumptions, and C ij represents the historical covariance between the S&P 500 subsector returns.
To solve for E i, we begin by assuming that the X i, i=1, … , N are selected in such a way as to maximise
 $$E_{p} {\,\minus\,}\lambda V_{p} \quad {\rm where}\,\lambda \,{\rm is}\,{\rm a}\,{\rm constant}$$
subject to M linear constraints:
 $$\mathop \sum\limits_{j\,=\,1}^N a_{{kj}} X_{j} =b_{k} {\rm }$$
for k=1, … , M and N=10, where
 $$E_{P} =\mathop \sum\limits_{i\,=\,1}^N X_{i} E_{i} $$
and
 $$V_{P} =\mathop \scale135%\sum\limits_{i\,=\,1}^N \mathop \sum\limits_{j\,=\,1}^N X_{i} X_{j} C_{{ij}} $$
The Lagrangian function of this maximisation problem is defined as
 $$Z=E_{P} {\,\minus\,}\lambda V_{P} {\plus}\mathop \scale135%\sum\limits_{k\,=\,1}^M \lambda _{k} \,\left( {b_{k} {\minus}\mathop \sum\limits_{j\,=\,1}^N a_{{kj}} X_{j} } \right)$$
Setting derivatives to 0 for i=1, … , N, we obtain
 $$\eqalignno{ {{\partial Z} \over {\partial X_{i} }} & =E_{i} {\minus}{{\partial V_{P} } \over {\partial X_{i} }}\lambda {\,\minus}\mathop \sum\limits_{k\,=\,1}^M a_{{ki}} \lambda _{k} =0 \cr &\Leftrightarrow E_{i} {\minus}{{\partial V_{P} } \over {\partial X_{i} }}\lambda =\mathop \sum\limits_{k=1}^M a_{{ki}} \lambda _{k} $$
Finally, the expected return for each subsector i is given by
 $$E_{i} ={{\partial V_{P} } \over {\partial X_{i} }}\lambda {\plus}\mathop \sum\limits_{k\,=\,1}^M a_{{ki}} \lambda _{k} $$
The net effect of this process is that more volatile sectors tend to have higher risk premia, as do those with a higher correlation to other asset classes (as lower correlation – and therefore greater diversification – is a reward in itself).
The return performance on the market-weighted portfolio, detailed in the first column of Table 3, is influenced by the weightings in sectors that exhibit a strong relationship with oil. Even a re-weighting among the equity sectors, detailed in the second column, can have a marked effect on the oil CRCVaR95, raising it from 5.1% to 11.0%, albeit with an increase in tail risk. This re-weighting has increased expected return by 0.4%, while increasing the risk of loss, the portfolio CVaR95 by 3.8%. In other words, it is possible to reduce oil price exposure by an investment in US equity without significantly sacrificing expected return, or dramatically increasing overall risk taken.
Reallocation of equity sectors to strengthen downside protection.

We now consider the impact of replacing the allocation to the S&P 500 Index in the portfolios in Table 1 with the reallocation of the sector weightings shown in Table 3. Table 4 shows in the first column the same representative benchmark US pension plan as used in the above analysis. (Note that the allocation to US equity sectors is equivalent to a total allocation of 40%, using the market value weights stated above). The next column displays a portfolio with the same equity reallocation used in Table 3. It also reduces the total equity allocation to 35%, redistributing the balance to emerging market assets. This portfolio demonstrates modifications to the benchmark asset allocation that strengthen downside protection, with an increase in oil CRCVaR95-funded status of 4.4%, while providing attractive relative portfolio efficiency, with an increase in expected return of 0.1% and a decrease in portfolio-funded status of CVaR95 of 0.2%.
Reallocation with the US equity allocation to strengthen downside protection.

That the oil CRCVaR95-funded status of the benchmark portfolio was lower than 100% demonstrates that the benchmark portfolio was poorly protected against declines in the oil price. The two targeted portfolios provide an example of the application of the framework to understand and mitigate funding risk in the face of joint plan and sponsor stress. Through this approach, portfolio return has been maintained at roughly equivalent levels, whereas portfolio CVaR95 and oil CRCVaR95-funded statuses have both been increased.
7. Extending the Framework
The framework can be applied to examine further implications of joint plan and sponsor stress. In the following section, two applications are briefly explored: exposures to an upside move in an asset and exposures to other resource or non-resource asset classes, or another economic variable.
7.1. Exposure to upside moves in an asset class
The CRCVaR measure can be easily adapted to consider circumstances when the plan sponsor’s business is negatively exposed to changes in asset prices, the opposite question to that posed in our oil case study. For example, the impact of oil prices on a transport company might well be the opposite of their impact on an oil concern. A spike in oil prices, which would benefit the oil concern, could expose the trucker to joint plan/sponsor stress. The CRCVaR measure of interest for the trucker then would be the CRCVaR05, the average portfolio return in the highest 5% of annual oil price increases.
Targeting an oil CRCVaR05 by itself is relatively simple, but of interest is whether the transport company’s plan performance can be improved while maintaining relative portfolio efficiency, relative to CVaR as described earlier. The first column in Table 5 demonstrates the performance of the same benchmark portfolio as used in the oil CRCVaR95 case study on an oil CRCVaR05 basis. The second column shows the performance of the portfolio, which was targeted at improving oil CRCVaR95 and in the third column an adjustment to this portfolio to target oil CRCVaR05.
Reallocation to strengthen upside protection.

The CRCVaR05-targeted portfolio would improve performance when oil prices rose sharply; on the other hand, the CRCVaR95-targeted portfolio, while performing seemingly well in response to large falls in the oil price, would be expected to lag the benchmark if oil prices rose suddenly.
8. Wider Applications
An important point to note about this analysis is that it is intended to demonstrate a framework that can be used in a wide range of situations. The framework can be applied to any asset, or combination of assets, to which a sponsor’s business may be highly exposed. For example, exposure to the price of other resources could be used for pension plans whose sponsors have either a long or short exposure to those resource. Exposure for a commercial or retail bank could be proxied by constructing an asset from a short cash and long corporate bond exposure. Beyond this, the risk associated with changes to macroeconomic variables such as inflation, growth and the interest rate may also be considered.
Nor is the analysis relevant only to pension plans. Sovereign wealth funds created by nations with a significant exposure to a single form of income could benefit from portfolio allocation along these lines – the oil-based example seems particularly pertinent here. The strategy could even be adapted to high net worth individuals with significant exposure to an ongoing holding in a particular sector – technology entrepreneurs are an obvious example.
9. Conclusion: Breaking the Missing Link
In this paper, we show that investors are generally able to construct portfolios that allow them to mitigate the risk of extreme adverse movements in a key variable – the impact of oil prices on oil producers and consumers was our example – without sacrificing expected return or portfolio efficiency.
Beyond this, we develop a framework to measure how resilient an existing pension plan portfolio is to extreme adverse moves in a variable of concern and we present an approach to portfolio construction that aims to reduce economic exposure risk without reducing portfolio returns or portfolio efficiency. Importantly, this framework – both in terms of the metric used to measure risk and the ways in which risk can be improved – has broad applicability across investors and their exposures.
Acknowledgements
The authors would like to thank two anonymous referees for helpful comments and suggestions that improved an earlier version of the paper. Any opinions, findings, conclusions or recommendations expressed in this article are those of the authors.
Appendix: The asset allocation framework
The asset allocation framework we employ in this analysis addresses three characteristics of historical asset returns:
1. Serial correlation in historical asset returns which occur from stale pricing.
2. Negative skewness and leptokurtosis resulting from the non-normal shape of marginal distributions of historical asset returns.
3. The convergence of correlations between asset returns. This correlation convergence occurs during periods of high market volatility.
We begin with time series of monthly total returns for each of the asset classes under consideration. In the examples shown in the article, we consider the following indices:

Our analysis comprises three stages.
Stage 1: Correcting for serial correlation
For each of these asset classes, we begin by correcting the time series of historical total returns for serial correlation to prevent the bias in volatility estimates that typically results from serial correlation.
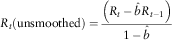
The adjustment we apply to each time series of historical total returns is a variation of Fisher–Geltner–Webb’s “unsmoothing” approach (Fisher et al., Reference Fisher, Geltner and Webb1994), which is a two-step procedure:
∙ Step 1: Estimate coefficient b in the following regression:
where R t is the return at time t. $$R_{t} =a{\plus}bR_{{t{\minus}1}} {\rm }$$
∙ Step 2: The unsmoothed time series are then defined as
where
$$R_{t} ({\rm unsmoothed})={{\left( {R_{t} {\,\minus\,}\hat{b}R_{{t{\minus}1}} } \right)} \over {1{\,\minus\,}\hat{b}}}$$
$$\hat{b}$$
is the ordinary least squares estimator of b. The resulting time series exhibits no significant serial correlation and exhibit the same expected return as the starting time series. The correlation structure is also preserved.


Stage 2: Assuming a non-normal distribution of asset returns
To capture the skewness and kurtosis of the data-generating process for each asset class, we assume that returns follow a Student’s t-distribution (Azzalini & Capitanio, Reference Azzalini and Capitanio2003). Its probability density function is defined as
 $$f\left( x \right)={{{\rm \Gamma }\left( {{{\gamma {\plus}1} \over 2}} \right)} \over {\beta \sqrt {\pi \gamma }\, {\rm \Gamma }\left( {{\gamma \over 2}} \right)}}\left[ {1{\plus}{1 \over \gamma }\left( {{{x{\minus}\alpha } \over \beta }} \right)^{2} } \right]^{{{\minus}{{\gamma {\plus}1} \over 2}}} $$
where
 $${\rm \Gamma }\left( y \right)=\mathop \int \nolimits_0^\infty s^{{y{\minus}1}} e^{{{\minus}s}} ds$$
where α, β and γ are location, scale and shape parameters, respectively. The parameters of the fitted distribution are estimated by maximum likelihood. The time series used to calibrate the distribution is the unsmoothed historical returns series resulting from stage 1 above.
Stage 3: Addressing the convergence of correlations
To address the fact that correlations between asset class returns tend to converge during periods of market stress, we make use of copulas (Nelsen, 1999). Instead of a normal copula, which can only be parameterised by the linear correlation coefficient, we use Student’s t-copula, which is also defined by the degrees of freedom used. The multinomial t-copula is defined as
 $$_{t} C_{{v,\,R}} \,\left( {F\left( {x_{1} } \right),\,F\left( {x_{2} } \right),\:\,\ldots\,\:,\,F\,\left( {x_{N} } \right)} \right)=t_{{v,\,R}} \left[ {t_{v}^{{{\minus}1}} \left( {F\left( {x_{1} } \right)} \right),\,t_{v}^{{{\minus}1}} \left( {F\left( {x_{2} } \right)} \right),\:\,\ldots\,\:,\,t_{v}^{{{\minus}1}} \left( {F\left( {x_{N} } \right)} \right)} \right]$$
where
∙
$$t_{v}^{{{\minus}1}} \left( {F\left( {x_{i} } \right)} \right)$$
is the inverse cumulative distribution function for Student’s t-distribution with v d.f. at the probabilities given by F(x i), for i=1, 2, … , N; and∙ t r,R is the joint cumulative t-distribution with γ d.f. and R the correlation matrix at
$$t_{v}^{{{\minus}1}} \left( {F\left( {x_{1} } \right)} \right),\,t_{v}^{{{\minus}1}} \left( {F\left( {x_{2} } \right)} \right),\:\,\ldots\,\:,\,t_{v}^{{{\minus}1}} \left( {F\left( {x_{N} } \right)} \right)$$
.


Incorporating serial correlation, Student’s t-marginal distributions and Student’s t-copulas into the asset allocation framework
We generate 10,000 Monte Carlo simulations that exhibit the characteristics described above, while maintaining the correlation structure of the underlying historical time series.



