





1 Introduction
Historically, mirror research has prioritized the main issues with mirror confinement: stabilizing the interchange instability, stabilizing velocity-space (loss-cone-driven) instabilities and minimizing axial electron heat losses. Nevertheless, cross-field transport remains an important topic in magnetic-confinement fusion reactor development, in both linear and toroidal geometries. Insight into edge-relevant turbulence, and its coupling to interchange and other mirror-driven instabilities, performed in a basic plasma science device may be useful for a mirror-based reactor. Although not at fusion-relevant core temperatures or densities, the Large Plasma Device (LAPD) operates at conditions similar to the edge of fusion devices and can provide insight into the physical processes in that region. Mirror machines are once again rising in prominence as a candidate for commercial fusion reactors with the advent of highly funded commercial ventures and high-field high-temperature superconducting magnets (Endrizzi et al. Reference Endrizzi2023; Forest et al. Reference Forest2024), so development of a functional understanding of cross-field transport in mirrors is imperative. A characterization of edge fluctuations has been undertaken, with emphasis on interpreting these fluctuations within the context of a mirror.
Non-classical cross-field particle transport is often caused by low-frequency, large-amplitude fluctuations. These fluctuations are the result of various instabilities. One such process is the ‘universal’ drift instability, which appears in the presence of a density gradient and finite resistivity. Drift-wave turbulence and the effect on transport has been extensively studied in the past (Horton Reference Horton1999; Tynan, Fujisawa & McKee Reference Tynan, Fujisawa and McKee2009). In the presence of sufficiently high rotation or sheared flow, rotational interchange and the Kelvin–Helmholtz instabilities also contribute or couple to these fluctuations.
Various gradient-, rotation- and shear-driven instabilities (and suppression of such) have been studied previously in the LAPD experimentally (Schaffner et al. Reference Schaffner, Carter, Rossi, Guice, Maggs, Vincena and Friedman2012, Reference Schaffner, Carter, Rossi, Guice, Maggs, Vincena and Friedman2013; Schaffner Reference Schaffner2013) and in simulations using BOUT, a three-dimensional fluid turbulence code, and an eigenvalue solver (Popovich et al. Reference Popovich, Umansky, Carter and Friedman2010). The LAPD has a sufficiently high spontaneous rotation rate that rotation-driven instabilities may be excited without artificial drive. Simulations using BOUT++ (Friedman et al. Reference Friedman, Carter, Umansky, Schaffner and Joseph2013) have also suggested that a rapidly growing nonlinear instability may dominate over all other linear instabilities.
Imposing a magnetic mirror configuration introduces magnetic curvature. The alignment
of the curvature vector with a pressure gradient vector component causes the
flute-like interchange instability if no stabilization mechanism is present. This
interchange mode could couple to finite parallel wavenumber,
$k_\parallel$
 drift waves. The coupling of drift waves to
curvature-induced interchange modes has been studied in toroidal devices such as
TORPEX (Fasoli et al.
Reference Fasoli, Labit, McGrath, Müller, Plyushchev, Podestà and Poli2006; Poli et al.
Reference Poli, Brunner, Diallo, Fasoli, Furno, Labit, Müller, Plyushchev and Podestà2006), where curvature was seen as the
driving component for the unstable drift-interchange modes. Drift-like fluctuations
have also been observed in the GAMMA-10 mirror (Mase et al.
Reference Mase, Itakura, Inutake, Ishii, Jeong, Hattori and Miyoshi1991; Yoshikawa
et al.
Reference Yoshikawa2010). Flute-like modes and drift waves
have been studied in other linear devices, such as Mirabelle (Brochard, Gravier
& Bonhomme Reference Brochard, Gravier and Bonhomme2005), where the
appearance of flute-like modes or drift waves were controlled by varying the field
and limiter diameter.
The rotational interchange and curvature interchange can both be flute-like modes. Rotational interchange (also called the ‘centrifugal instability’) is driven by the aligned centrifugal force and pressure gradient vectors, but curvature-driven interchange is instead driven by magnetic curvature and is typically referred to as simply the ‘flute’ or ‘interchange’ instability. Rotational interchange (Jassby Reference Jassby1972) has been observed in the LAPD in the past (Schaffner et al. Reference Schaffner, Carter, Rossi, Guice, Maggs, Vincena and Friedman2012; Schaffner Reference Schaffner2013), and the curvature-driven interchange instability has been observed in many other mirror machines (Wickham & Vandegrift Reference Wickham and Vandegrift1982; Ferron et al. Reference Ferron, Wong, Dimonte and Leikind1983; Post Reference Post1987).
Biasing or modifying the electrical connection of the plasma with the end wall has proven to be a important actuator in many mirror machines such as TMX-U (Hooper et al. Reference Hooper, Baldwin, Fowler, Kane and Turner1984), GAMMA-10 (Mase et al. Reference Mase, Itakura, Inutake, Ishii, Jeong, Hattori and Miyoshi1991) and GDT (Bagryansky et al. Reference Bagryansky, Lizunov, Zuev, Kolesnikov and Solomachin2003; Bagryansky, Beklemishev & Soldatkina Reference Bagryansky, Beklemishev and Soldatkina2007; Beklemishev et al. Reference Beklemishev, Bagryansky, Chaschin and Soldatkina2010), and will be utilized on WHAM (Endrizzi et al. Reference Endrizzi2023). Active biasing was not attempted in this study, but the intrinsic rotation and strong electrical connection to the source region may provide a useful analogue for edge biasing in other mirror machines.
The LAPD exhibits a high degree of turbulence so it is difficult to identify the dispersion relation of the modes that are present. Nevertheless, the LAPD has good coverage of perpendicular spectra using correlation-plane techniques, and some measure of parallel spectra using the correlation between two axially separated probes. A space–time spectral characterization of the many instabilities present in this low beta (ratio of plasma pressure to magnetic pressure), moderate aspect ratio, gas-dynamic trap regime is attempted.
This goal of this study was to investigate the changes to turbulence and transport in
LAPD mirror configurations. Of particular interest were the potential coupling of
the interchange instability with drift waves or other modes, and the effect of the
mirror geometry on cross-field particle flux. Presented is a characterization of the
observed modes and the effect of introducing a mirror geometry. This paper is
organized as follows. Section 2 discusses the
configuration of the LAPD and the diagnostics used. Section 3 covers the changes seen when imposing a magnetic mirror
configuration on profiles, particle flux, drift waves, turbulence and magnetic
fluctuations. Section 4 explores the changes
in two dimensions (
$x\unicode{x2013}y$
 plane) structure. Section 5 discusses the active and expected instabilities and reasons
for their modification. Section 6 summarizes
the study and discusses the requirements for a deeper investigation.
2 Device configuration
2.1 The Large Plasma Device
The LAPD is a 20 m long, 1 m diameter basic plasma device at UCLA
(Gekelman et al.
Reference Gekelman2016). The LAPD has a variable magnetic
field, from 250 G to 1.6 kG and can be varied axially. Probes
inserted into the plasma can collect high-resolution, temporal information on
density, temperature, potential and magnetic field fluctuations. In this study,
the plasma was formed using an emissive, 72 cm diameter barium-oxide
(BaO) cathode (mapped to 60 cm in a flat field) and a 72 cm
diameter, 50 % transparent molybdenum anode that accelerate
electrons across a configurable 40–70 V potential; voltages of
$60$
 and 63 V were used in this study.
The source has since been upgraded to a lanthanum hexaboride (LaB6) cathode
(Qian et al.
Reference Qian2023) that enables access to
higher-density, higher-temperature regimes, but all the data in this study are
from plasma formed by a BaO cathode.
The flexible magnetic geometry of the LAPD was used to construct a variety of
magnetic mirror configurations. The discharge current, fill pressure and other
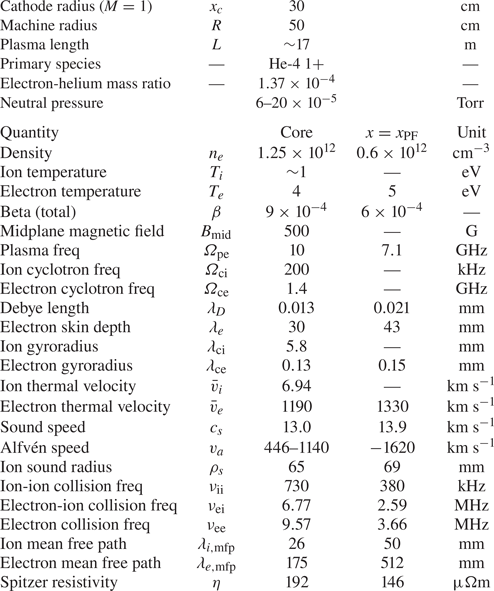
machine parameters were held constant. The typical plasma parameters observed in
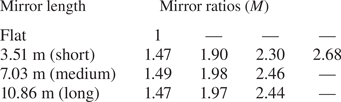
this study can be seen in table 2. Data at several mirror ratios and lengths were
collected (see table 1) but
emphasis is placed on the short cell because the highest mirror ratio possible (
$M=2.68$
 ) with a
$500$
 Gauss midplane field could be
accessed and probes were able to be placed outside of the mirror cell. An
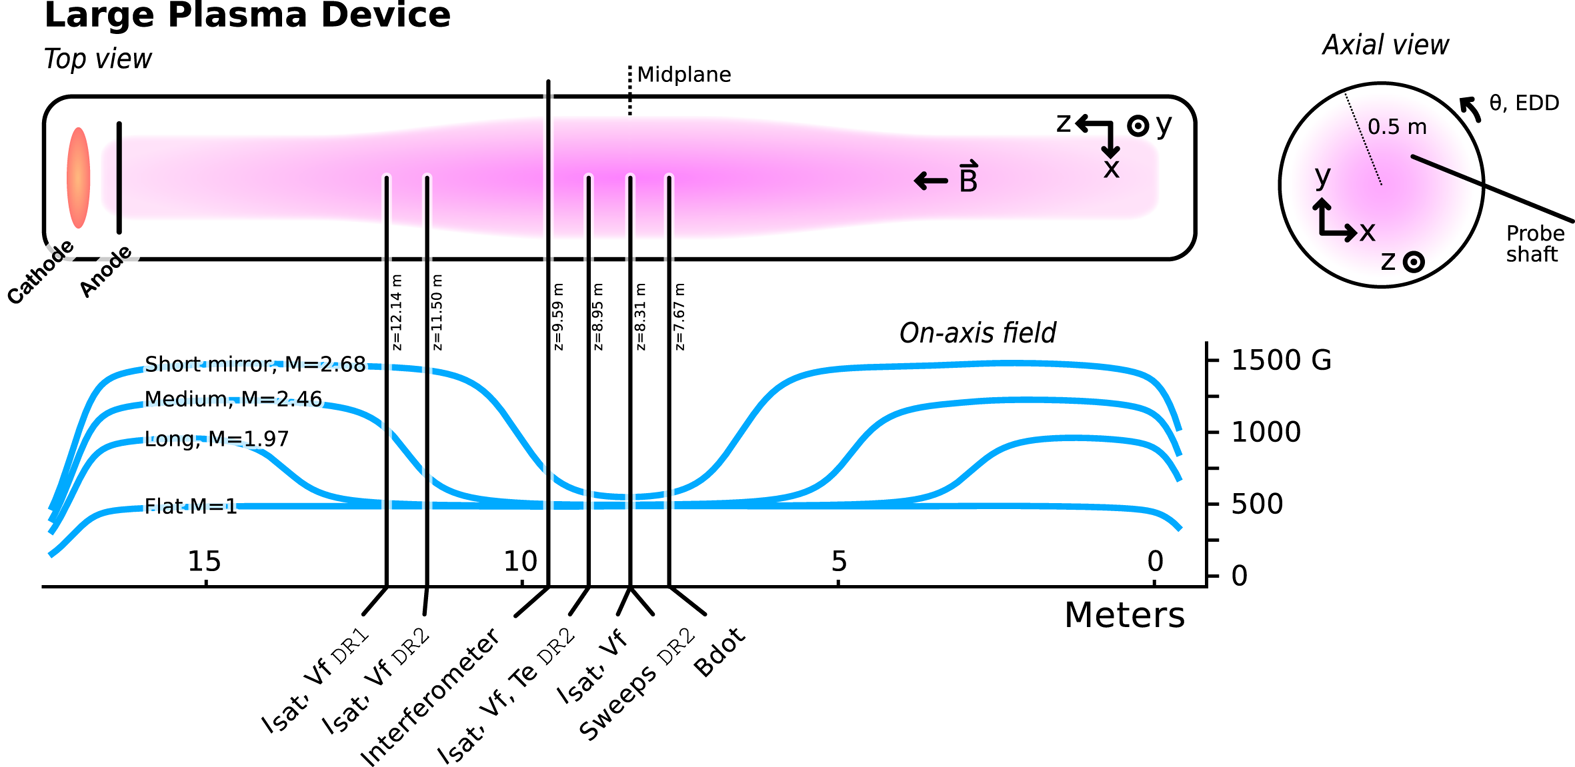
overview of the axial magnetic field for the short mirror configurations and
probe locations can be seen in figure 1. The 2- or 3-cell mirror configurations were also
explored but are not examined in this study. All results presented below are
from the short mirror-cell configuration unless otherwise specified.
Magnetic mirror lengths and ratios. The lengths are measured where
the curvature changes sign and the ratio is the maximum divided by
the minimum. Approximately
$3.5$
 m must be added to the
length if the good-curvature region is included. In the case of
small asymmetries, the field strengths were averaged before
calculation of the mirror ratio.

The LAPD machine information and plasma parameters in the core and
peak-fluctuation region (
$x=x_\text {PF}$
 ) at the midplane in this study.
Dashed quantities are assumed to be identical to core
quantities.

Cartoon of the LAPD and the coordinate system used. Only four of the eleven mirror configurations studied are plotted for clarity (mirrors of the same length have similar shapes and simply scale with mirror ratio). Diagnostic set varied by datarun; unlabelled diagnostics were used in both dataruns.

2.2 Diagnostics
All diagnostics were recorded with an effective sampling rate of 6.25 MHz
(16-sample average at 100 Msps) and a spatial resolution of
0.5 cm. When necessary, averaging over time is done in the approximate
steady-state period of the plasma discharge (
$4.8$
 to
$11.2$
 ms from the 1 kA trigger
signal). Unless otherwise noted, all data presented will be from probes inside
the mirror region (
$z \approx 7$
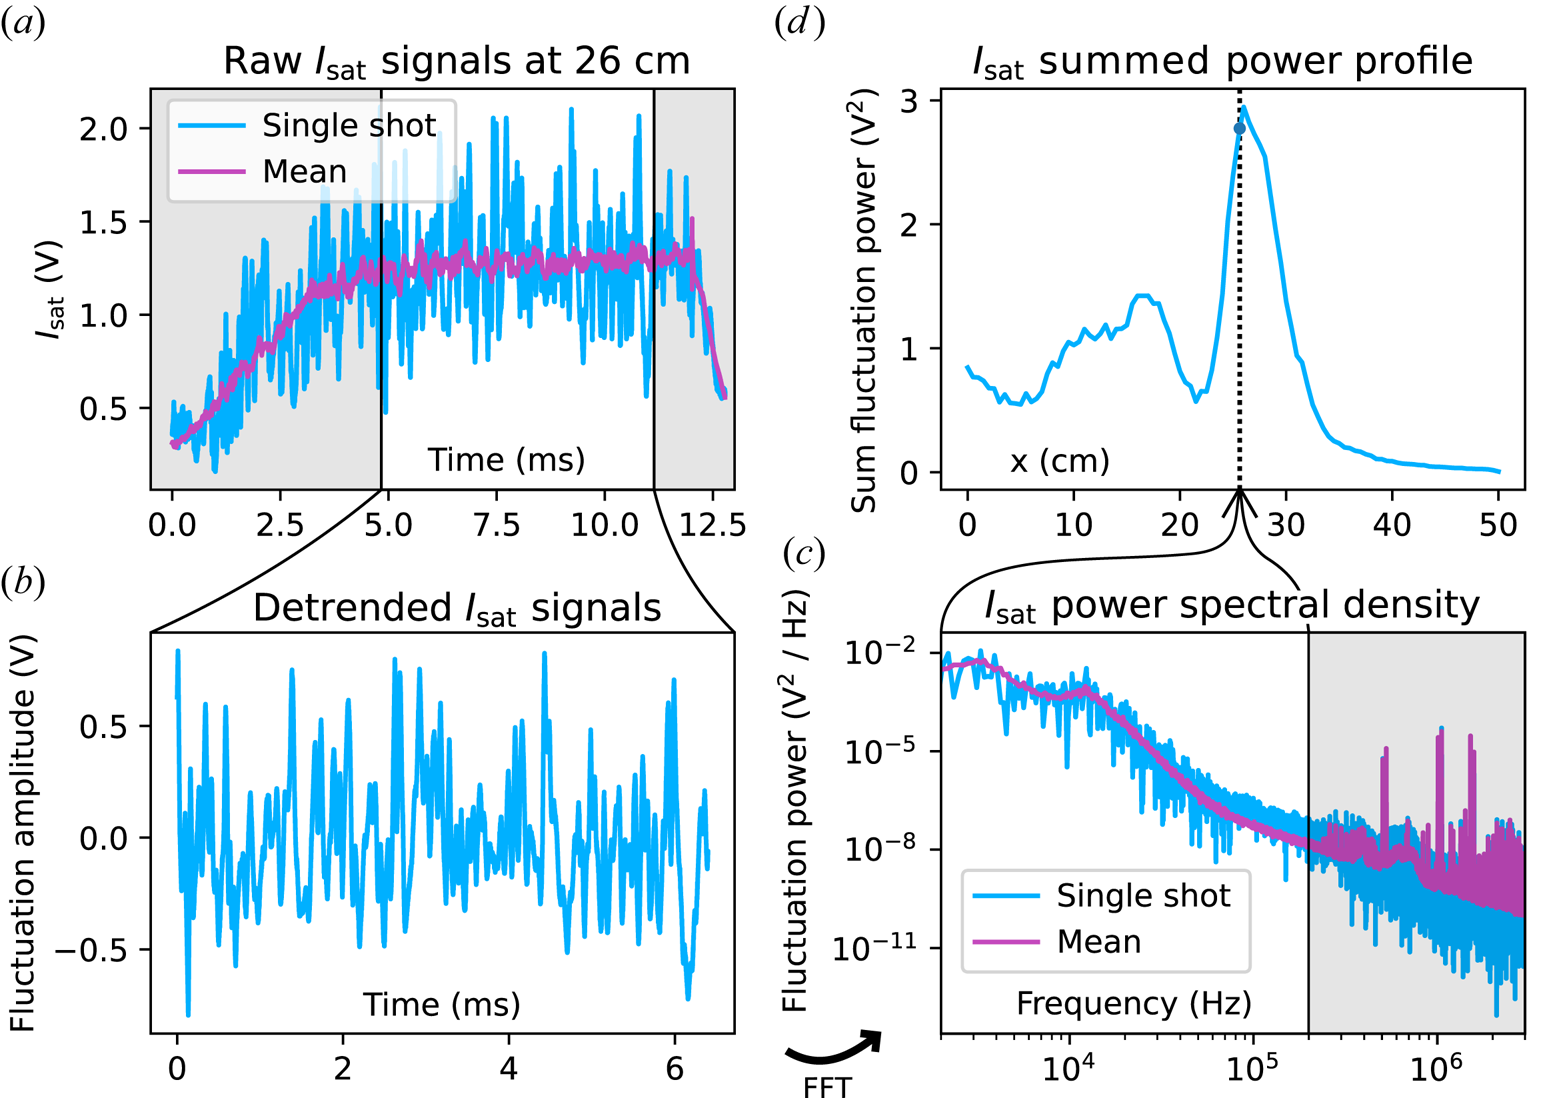
 m). An example of a raw ion
saturation current –
$I_\text {sat}=0.6 S n_e e \frac{\sqrt{T_e}}{m_i}$
 , where
$S$
 is effective area,
$n_e$
 electron density,
$e$
 elementary charge,
$T_e$
 electron temperature, and
$m_i$
 ion mass – signal and processing
steps can be seen in figure 2.
The raw signals are detrended by subtracting the mean across shots to obtain the
fluctuations only. Fast Fourier transformations are then taken of
these fluctuations for calculating power spectra and cross-correlated
quantities. Frequencies above 200 kHz are dominated by electronics and
instrumentation noise and thus are also ignored. Fluctuation power profiles can
then be constructed.
Raw data and basic processing steps for LAPD probe diagnostics as
demonstrated by an
$I_\text {sat}$
 trace from a
DR1,
$M=1$
 mirror at 26 cm. Data
are truncated from 4.8 to 11.2 ms (
$a$
 ) and detrended (
$b$
 ). Power spectral density is
calculated (
$c$
 ), and a power profiles can be
constructed (
$d$
 ). The shaded regions are
excluded from this analysis.

The data presented were collected in two phases. The first phase
(‘datarun’), DR1, collected Langmuir probe (
$I_\text {sat}$
 and Vf – floating potential)
and magnetic fluctuation (‘Bdot’) (Everson
et al.
Reference Everson, Pribyl, Constantin, Zylstra, Schaeffer, Kugland and Niemann2009) traces. Fifty shots were taken at
each position for every configuration. The second phase,
DR2, was conducted with a similar set of diagnostics
focused on temperature measurements (swept and triple probe) and the
two-dimensional
$x$
 –
$y$
 structure. Fifteen shots were taken at each
position, except for Langmuir sweeps with 64 shots. When appropriate, all data
for each position were shot averaged. The parameter ‘
$I_\text {sat}$
 ’ will be used interchangeably with
‘density’ and be presented with units of density (assuming a
flat electron temperature
$T_e = 4.5$
 eV profile).
3 Mirror-induced changes
3.1 Profile modification
Because the field at the plasma source increases with
$M$
 , the midplane plasma expands by a factor of
$\sqrt {M}$
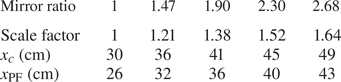
 . The physical locations of the
peak-fluctuation region –
$x_{\rm PF}$
 (maximum gradient) – and the cathode
radius
$x_c$
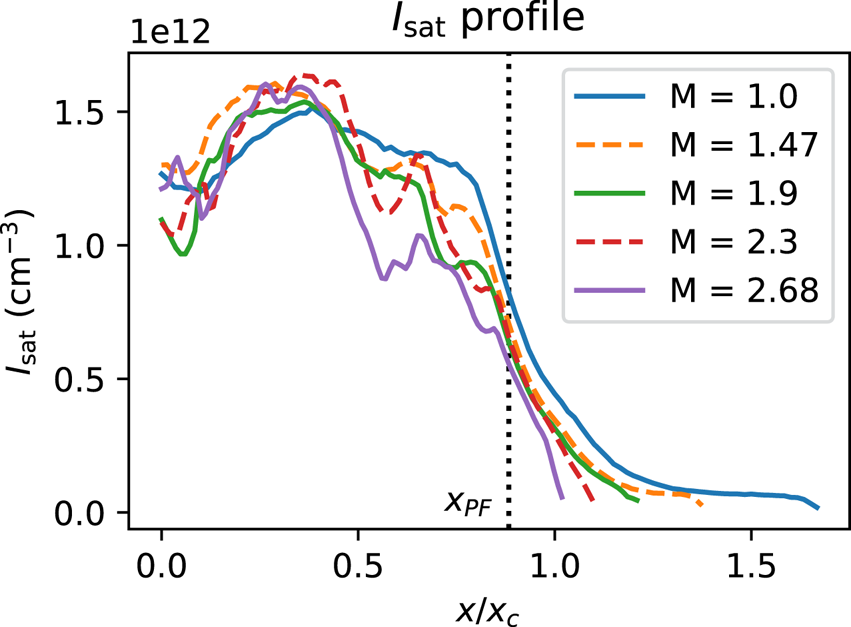
 can be seen in table 3. This expansion leads to broader plasma
profiles and decreased core density but these profiles are similar in the
core and at
$x_{\rm PF}$
 when magnetically mapped to the cathode
radius
$x_c$
 , as seen in figure 3. Dips between the core (
$x/x_c=0)$
 and the peak-fluctuation region (
$x=x_{\rm PF})$
 are seen, but fluctuation power from this
region (
$x/x_c = 0.5$
 to
$0.7$
 ) is not significant (figure 7) so this region is not the focus of this
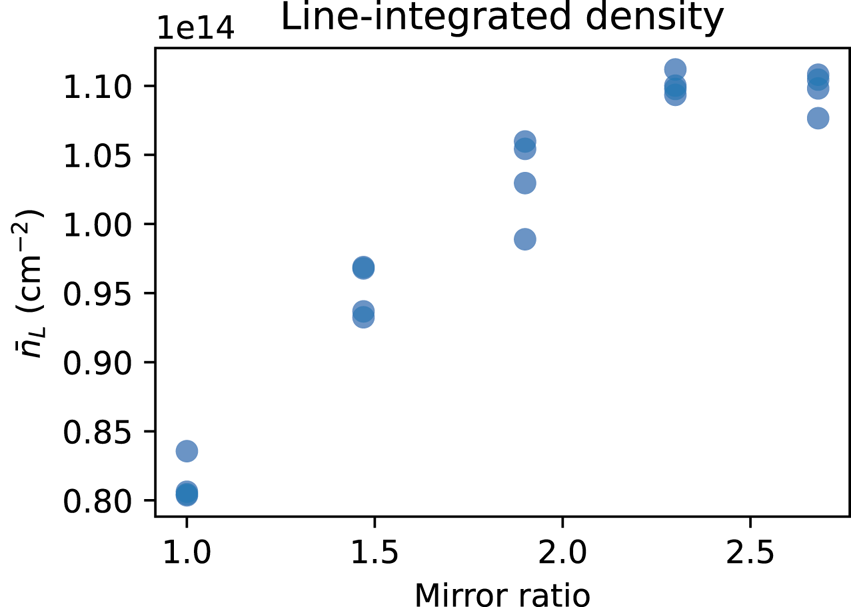
study. The line-integrated density as measured by a 56 GHz heterodyne
interferometer increases up to
${\sim }35\,\%$
 from the
$M=1$
 case of
${\approx }8 \times 10^{13}\ {\rm cm}^{-2}$
 (figure 4) but does not increase past a mirror ratio of
2.3. Discharge power increases only slightly (
$3\,\%$
 ) at higher mirror ratios, suggesting
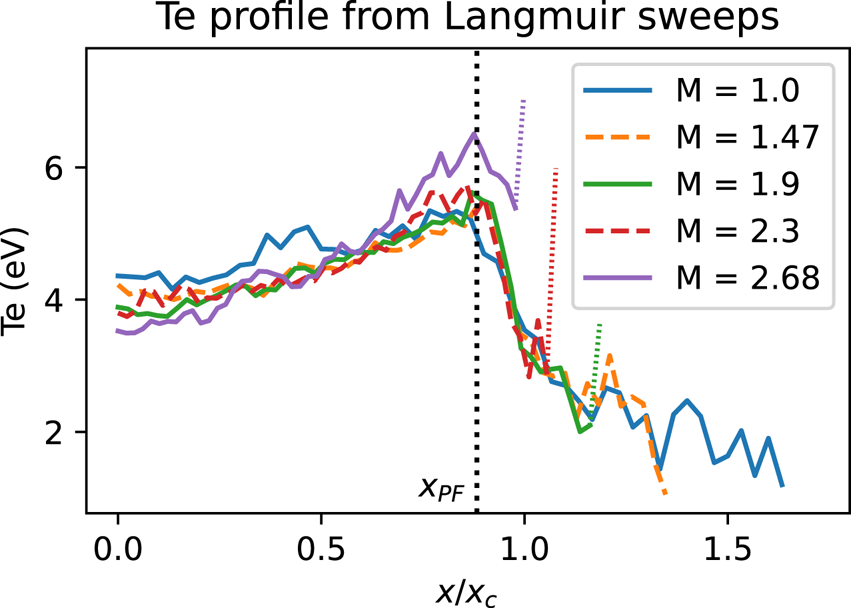
negligible impact on density. Langmuir sweeps and triple probe measurements of
$T_e$
 (DR2) show slightly
(less than 25 %) depressed core and slightly elevated edge
$T_e$
 with increasing mirror ratio (figure 5) but otherwise remains
unaffected. The temperature affects
$I_\text {sat}$
 measurements through the
$\sqrt {T_e}$
 term so small changes are insignificant.
The low temperatures indicate that the plasma is collisional given the length
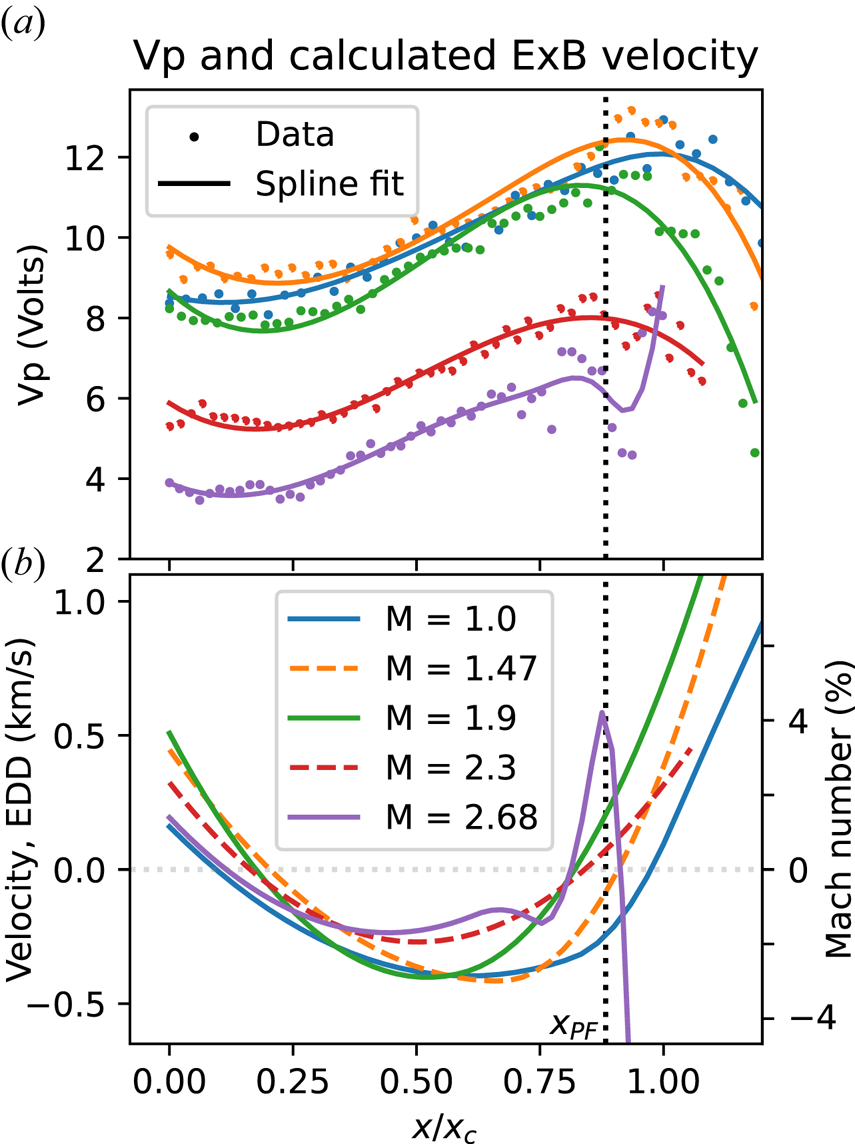
scales of the system (as seen in table 2) and isotropic. Plasma potential decreases across the
plasma (figure 6) when the mirror
ratio exceeds 1.9. This drop in plasma potential may be caused by the grounding
of the anode to the wall, which should begin at
$M=1.93$
 given the 72 cm anode and
100 cm vessel diameters. The reason for the local minimum in the
$M=2.68$
 is unknown. This potential profile creates
a sheared
$\boldsymbol {E} \boldsymbol {\times } \boldsymbol {B}$
 velocity profile (figure 6) limited to
$500\ {\rm m}\ {\rm s}^{-1}$
 in the core and exceeding
${\sim }3\ {\rm km}\ {\rm s}^{-1}$
 at the far edge. The flow does not exceed
4 % of the sound speed (table 2) in the core or gradient (
$x=x_{\rm PF}$
 ) region. The mirror ratio does not appear
to significantly alter azimuthal flow. The floating potential (Vf) profile also
exhibits similar behaviour to the plasma potential (figure 6), but is modified by the presence of
primary electrons.
The
$x_c$
 and
$x_{\rm PF}$
 locations for each mirror ratio
when scaled by the expected magnetic expansion.

Midplane
$I_\text {sat}$
 profile, shot averaged and time
averaged from 4.8 to 11.2 ms (we have assumed
$T_e = 4.5$
 eV based on triple probe
and Langmuir sweep measurements). Effective area was calibrated
using a nearby interferometer. Profile shape remains similar in the
core and gradient region when mapped to the cathode radius
$x_c$
 . The dips in profiles at higher
$M$
 below
$x=x_\text {PF}$
 are of unknown origin and are
not the focus of this study. Shot-to-shot variation is less than
5 % for
$x \leqslant 0.95 x_c$
 and less than 9 %
for
$x \leqslant 1.4 x_c$
 for all cases.

Line-integrated density as measured by a 56 GHz heterodyne interferometer as a function of mirror ratio, taken from four discharges for each mirror configuration. Density increases up to a mirror ratio of 2.3, where it appears to level off. The interferometer is located in the mirror-cell bad-curvature region at 9.59 m, 1.3 m closer to the cathode from the midplane.

The value of
$T_e$
 from Langmuir sweeps
(DR2) at the midplane. Triple probe
results are nearly identical. The increased temperatures directly at
the plasma edge, indicated by dotted portions of the curves, are
likely artefacts caused by sheath expansion in lower densities.
Changes in mirror ratio lead to at most a 25 % change
in
$T_e$
 . The plasma is collisional and
isotropic.

Plasma potential Vp (
$a$
 ) and derived
$\boldsymbol {E}\boldsymbol {\times }\boldsymbol {B}$
 velocity profiles (
$b$
 ) from Langmuir sweeps at the
midplane. The range
$x/x_c > 1.2$
 has been excluded from the
graph for greater clarity in the core and gradient region. The
electric field was calculated by taking the gradient of the
spline-smoothed plasma potential profile. The Mach number (in per
cent) is calculated using the approximate sound speed evaluated at
$x=x_{\rm PF}$
 (table 2). The overall structure of the
flows does not appreciably change when mirror ratio is varied.

3.2 Reduced particle flux
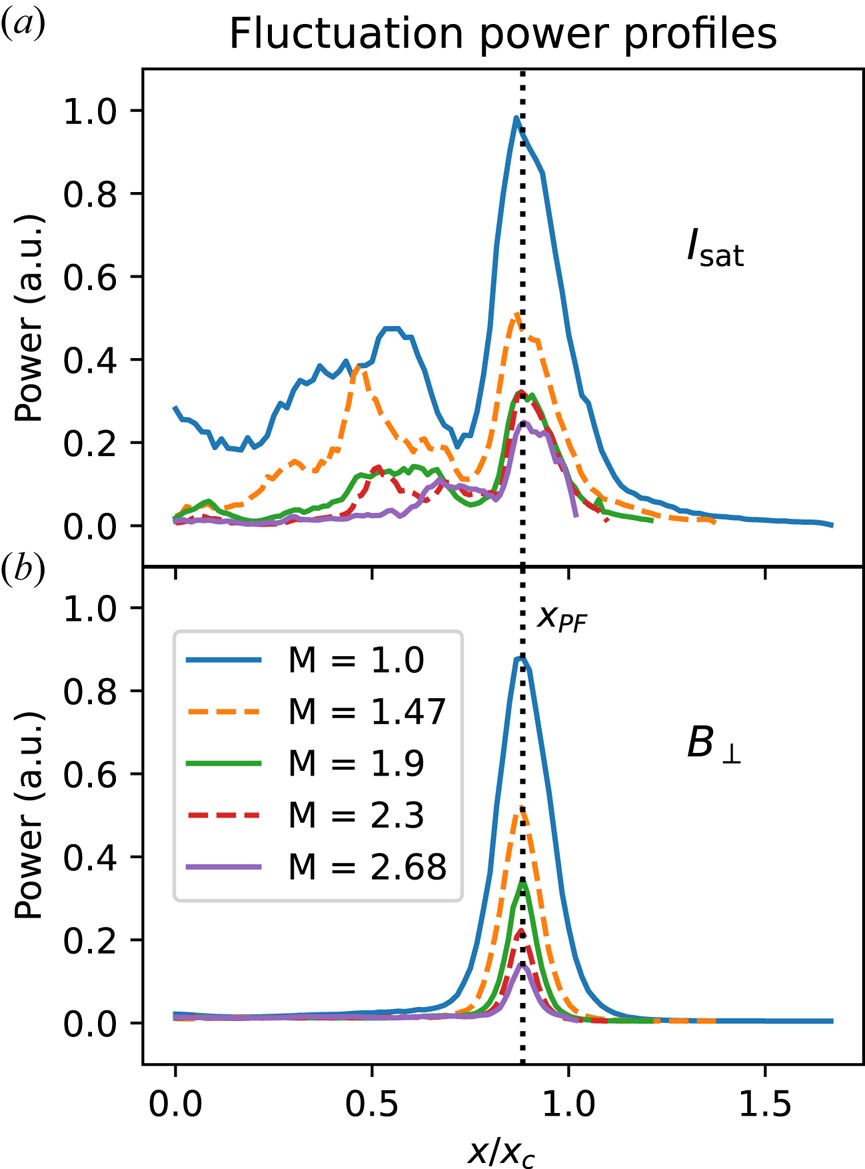
The density fluctuation power peaks at the steepest gradient region (
$x_{\rm PF} = x/x_c \sim 0.88)$
 as expected, as seen in figure 7. Here,
$x_{\rm PF}$
 occurs at nearly the same magnetically
mapped coordinate for each mirror ratio. These density fluctuations are a large
driver of changes in the cross-field particle flux (3.1). The Vf fluctuations also
peak at the same location, but the total power across mirror ratios is similar
and, relative to density fluctuations, much lower in the core. Core density
fluctuations below 2 kHz are substantial in the core at lower mirror
ratios, possibly caused by hollow profiles, non-uniform cathode emissivity or
probe perturbations, but are outside the scope of this study.
The
$I_\text {sat}$
 (
$a$
 ) and
$B_\perp$
 (
$b$
 ) fluctuation power profiles for
signals 2 kHz and up at
$z=8.3$
 m (midplane) and
$z=7.7$
 m, respectively. The
lower-frequency components in
$I_\text {sat}$
 are associated with bulk
profile evolution, dominate the core region and are not the focus of
this study.

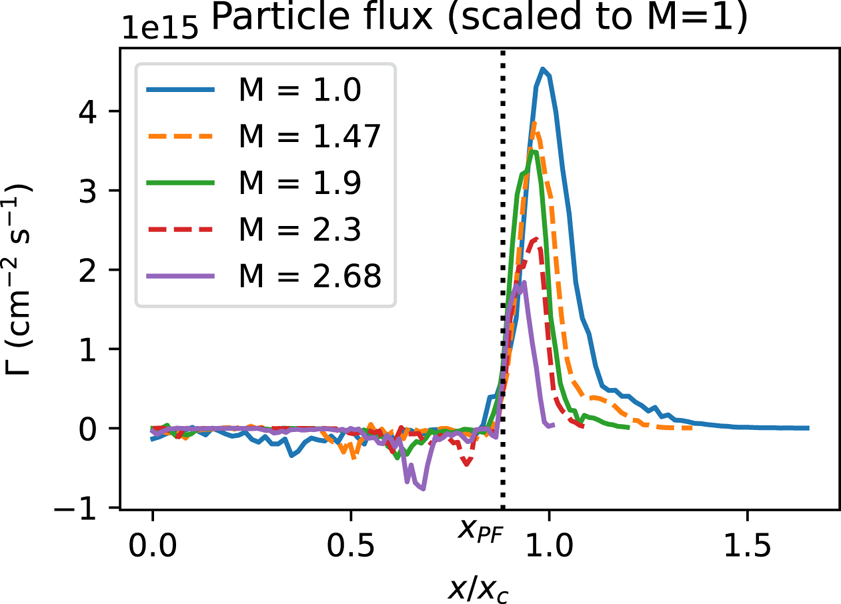
A spectral decomposition technique is used to calculate the time-averaged particle flux (Powers Reference Powers1974) as seen in figure 8

where
$k$
 is the azimuthal
wavenumber component,
$\gamma$
 is the coherency,
$\alpha$
 is the cross-phase,
$P$
 is the power spectrum and
$\omega$
 is the frequency. This method is more
robust than the naive time integration of
$n (t ) \tilde {E} ( t )$
 because it accounts for the coherency of
the density-potential fluctuations. This representation also enables inspection
of each contributing term in the event of surprising or problematic results. A
plot of the
$I_\text {sat}$
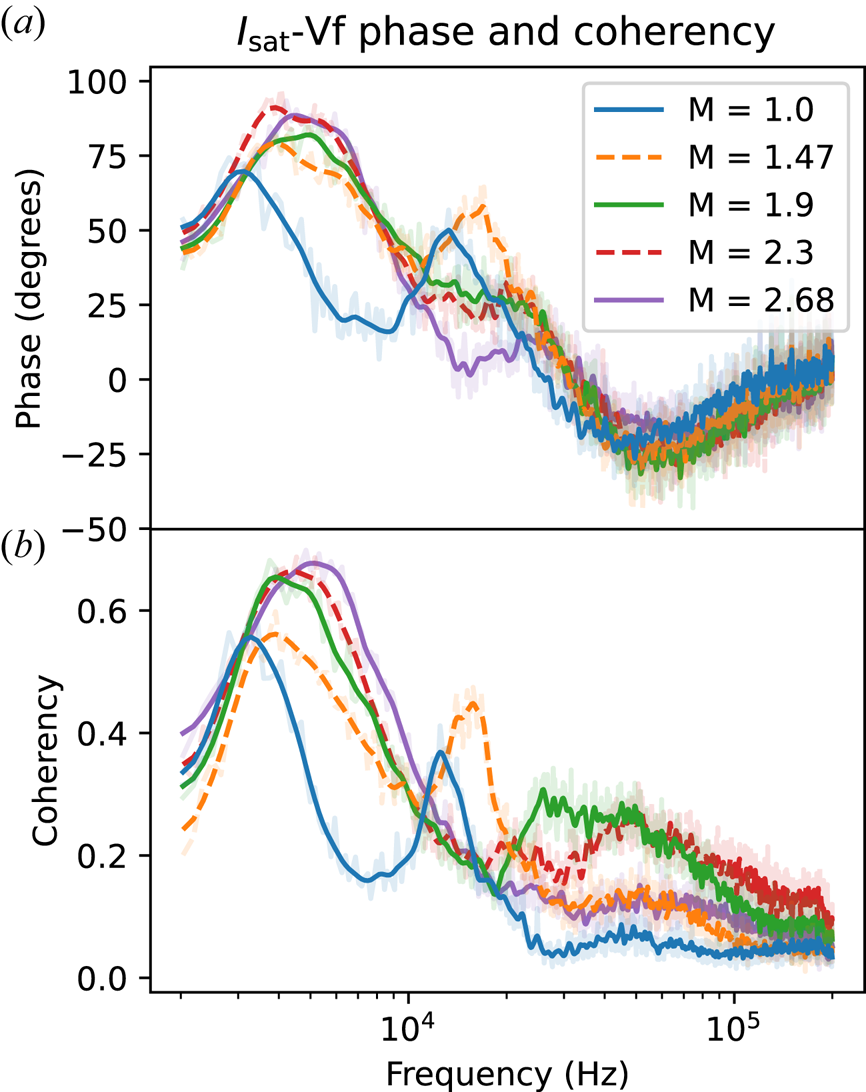
 -Vf phase can be seen in figure 9. The flattened particle
flux in the core is likely caused by primary electrons emitted by the cathode.
These electrons have long mean free paths (greater than a few metres) and sample
fluctuations along the length of the machine, mixing the phases of these
fluctuations. Since the floating potential is set by the hotter electron
population, the measured Vf fluctuations are no longer related to the local
plasma potential fluctuations of a wave by bulk
$T_e$
 (Carter & Maggs Reference Carter and Maggs2009). These primary electrons have a
significant effect in the core within the region mapped to the cathode
$x \lesssim x_c$
 . The
$I_\text {sat}$
 fluctuations are not affected.
Cross-field,
$\tilde {E_y} \times B$
 fluctuation-based particle flux
(calculated using (3.1)) with respect to mirror ratio. A monotonic decrease
in particle flux is observed with increasing mirror ratio at the
midplane. Particle flux is normalized by plasma circumference to the
$M=1$
 case to account for the
geometry-induced decrease in particle flux caused by a
larger-diameter plasma.

Phase (
$a$
 ) and coherency (
$b$
 ) of
$I_\text {sat}$
 current and Vf near
$x_{\rm PF}$
 at the midplane, smoothed.
Positive phase means
$I_\text {sat}$
 leads Vf. Peaks in coherency
occur between 3 and 5 kHz and at the drift-Alvén wave
peaks between 12 and 25 kHz. These coherency peaks tend to
have larger phase shifts than other nearby frequencies.

Azimuthal wavenumber is measured by two Vf probe tips
$0.5$
 cm apart. This wavenumber estimation
technique yields good agreement with correlation-plane measurements (figure 17). Note that
$\tilde {E}$
 is not directly measured – it is
instead calculated through the
$k(\omega ) \sqrt {P_{\phi \phi } (\omega )}$
 terms.
The
$\tilde {E} \times B$
 particle flux clearly decreases with mirror
ratio; most of this decrease is attributed to the decrease in density
fluctuation power. The particle flux for each mirror ratio was normalized to the
$M=1$
 case via the plasma circumference to
compensate for the increased plasma surface area at the same magnetically mapped
coordinate
$x/x_c$
 . This particle flux is of the order of Bohm
diffusion
$D_B = \frac {1}{16} {T_e}/{B} \approx 6.25 \ \text {m}^{2}\ \text {s}^{-1}$
 , as observed in other transport studies
(Maggs, Carter & Taylor Reference Maggs, Carter and Taylor2007).
The
$T_e$
 profiles and fluctuations may affect
particle fluxes but measurements of both were not taken in the same datarun;
nevertheless, a quantification of the effect of
$T_e$
 on particle flux is attempted. The
$T_e$
 fluctuations affect
$I_\text {sat}$
 -based density measurements through the
$T_e^{-1/2}$
 term, and triple probe and Langmuir sweep
$T_e$
 measurements suggest that temperature
gradients have a negligible impact. A naive incorporation of temperature
fluctuation data from DR2 into particle fluxes from
DR1 suggests that cross-field particle flux may be
underestimated by up to
$50\,\%$
 via the
$I_\text {sat}$
 temperature term, but the trend and
relative fluxes across mirror ratios remain unchanged. Such a naive
incorporation should be treated with suspicion because of the sensitive nature
of the flux with respect to the gradient and the differences in profiles between
DR1 and DR2. These difference
in profiles may be caused by the cathode condition, deposits on the anode or a
different gas mix and are difficult to account for.
3.3 Drift waves
The
$I_\text {sat}$
 fluctuation power spectra in the region of
peak power
$x \sim x_\text {PF}$
 , also where the density gradient is
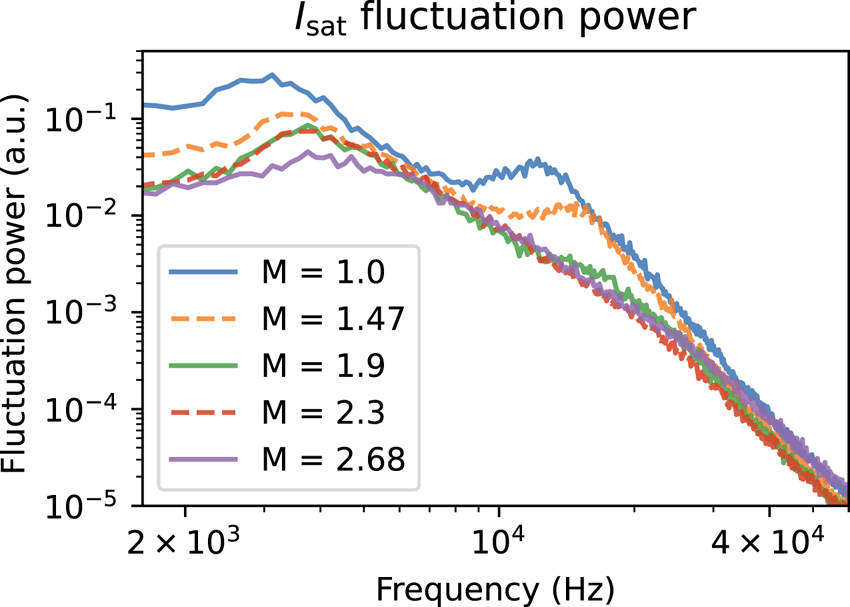
strongest, can be seen in figure 10. Notably, the fluctuation peaks shift to higher
frequencies and decrease in total fluctuation power. The shift in frequency may
be the Doppler shift caused by the change in
$\boldsymbol {E}\boldsymbol {\times }\boldsymbol {B}$
 plasma rotation seen in figure 6 at the location
$x/x_c \approx x_\text {PF}$
 . The shift in frequency is somewhat smaller
than what would be expected from the field line-averaged increase in
Alfvén speed at the longest possible wavelength. The phase angle
of
$I_\text {sat}$
 and Vf provides insight into the nature of
the driving instability. Including a non-zero resistivity
$\eta$
 in the drift wave leads to a small phase
shift
$\delta$
 between the density and potential. This
phase shift
$\delta$
 in a collisional plasmas is of the order of
$\delta \approx \omega \nu _e / k_\parallel ^2 \bar {v}_e^2$
 (Horton Reference Horton1999). Estimating this quantity using measured and typical values (
$k_\parallel = 0.18\ {\rm rad}\ {\rm m}^{-1}$
 ,
$\bar {v}_e = 1300\ {\rm km}\ {\rm s}^{-1}$
 ,
$\nu _e = 3.7$
 MHz,
$\omega = 12$
 kHz) yields a substantial phase
shift of
$\delta \approx 46^\circ$
 , which roughly agrees with the phase shifts
in figure 9, although the implied
increased phase shift at higher frequencies does not agree with measurements.
The
$I_\text {sat}$
 (density) fluctuation power
averaged over a 1 cm region around
$x_\text {PF}$
 at the midplane. The
fluctuation power is largely featureless below 2 kHz and
beyond 40 kHz aside from electronics noise.

As seen in figure 9, the phase
shift between
$I_\text {sat}$
 and Vf fluctuations is larger below
10 kHz, implying the presence of additional modes beyond or significant
modification of resistive drift-wave fluctuations. The phase difference
between two Vf probes,
$3.83$
 m apart, was used to calculate the
parallel wavelength
${2 {\rm \pi}}/{\lambda } = k_\parallel = \phi _{\text {Vf1}, \text {Vf2}} / \Delta z$
 assuming the wavelengths are greater than
7.66 m. The two probes mapped to the same field line only in the
$M=1$
 configuration, so parallel wavenumbers are
available only for the flat case. Parallel wavenumbers are theoretically
calculable from two-dimensional correlation planes but the coherency dropped
dramatically when a mirror geometry was introduced.
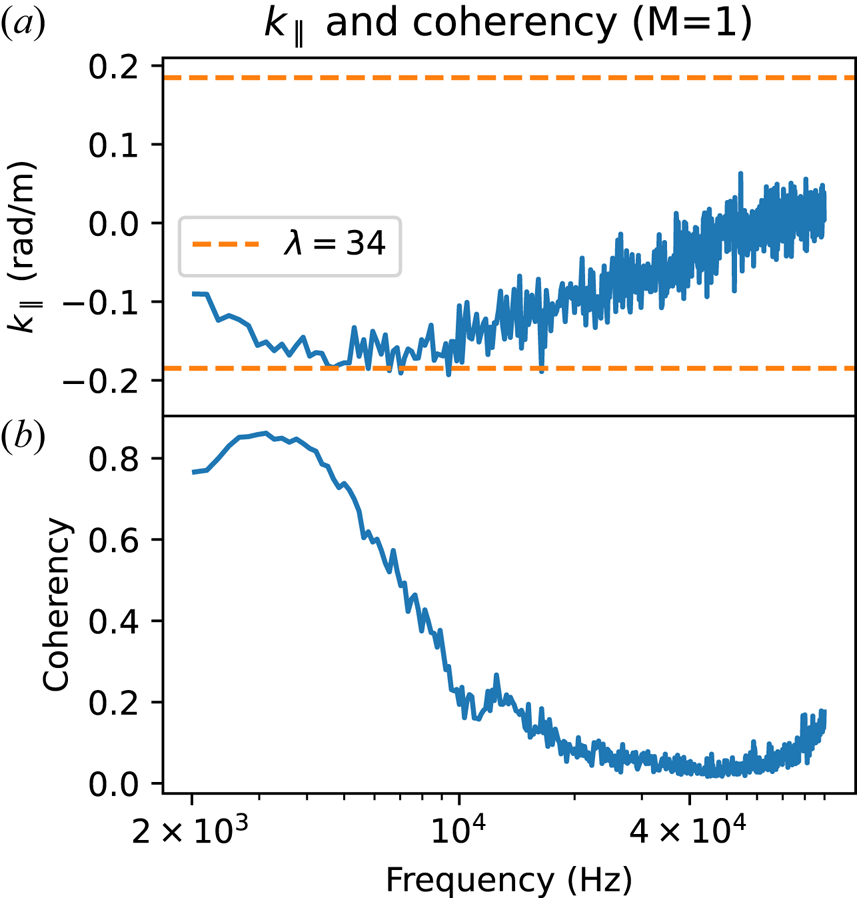
A 34 m wavelength mode likely contributes to the measured
$k_\parallel$
 from
$3$
 to
${\gtrsim }10$
 kHz (figure 11). Drift waves are long-wavelength modes
so coherent density and potential fluctuations along the flux tube are expected.
The coherency is a measure of similarity of the spectral content of two signals,
in this case Vf probes 1 and 2. The coherency is defined as
$\gamma = {|\langle P_{1,2} \rangle |}/{\langle |P_{1,1}|^2 \rangle \langle |P_{2,2}|^2 \rangle }$
 , where
$P_{x,y}$
 is the cross-spectrum between signals
$x$
 and
$y$
 and the angle brackets
$\langle \rangle$
 denote the mean over shots. The coherency
between the two Vf probes drops off with increasing frequency, with a slight
bump at around 12 kHz. There are several candidates for the driving
mechanism of the 3–5 kHz mode, but the 12 kHz mode is most
likely a drift-Alfvén wave.
Values of
$k_\parallel$
 (
$a$
 ) and coherency
$\gamma$
 (
$b$
 ) as a function of frequency.
Only results from the
$M=1$
 case are available, but it is
clear that there are long (
${\gtrsim }34$
 m) wavelength modes at 3
and 12 kHz. The probes used for calculating
$k_\parallel$
 were located at the midplane (
$z=8.31$
 ) and
$z=12.14$
 m, 3.83 m
apart.

3.4 Turbulence modification
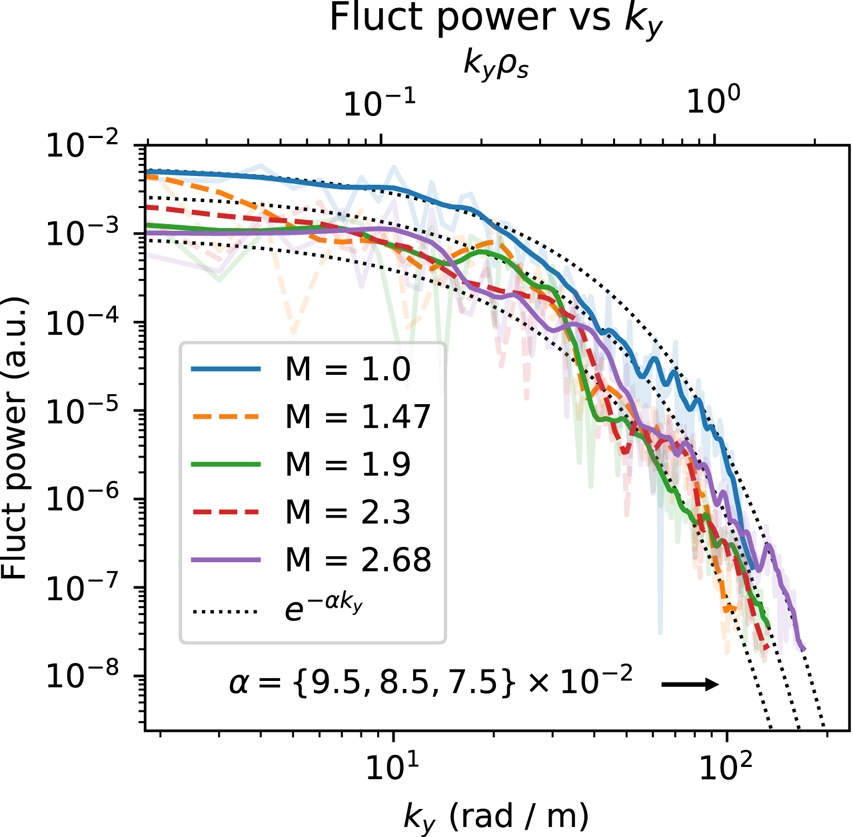
The wavenumber–power relation in figure 12 shows decreased fluctuation power when a mirror
configuration is introduced. However, there is no discernible trend when the
mirror ratio is increased further. The exponential nature of the curve also
remains unchanged. The greatest decrease in fluctuation power occurred at low
and high
$k_y$
 values, around
$10$
 and
$70\ {\rm rad}\ {\rm m}^{-1}$
 . The shape of the power-
$k_y$
 curves follow an exponential distribution,
and is inconsistent with a two-dimensional drift-wave turbulent cascade
(Wakatani Hasegawa
$k^{-3}$
 ) (Wakatani & Hasegawa Reference Wakatani and Hasegawa1984). The steep dropoff in fluctuation
power with
$k_y$
 suggests that higher-wavenumber
fluctuations do not have a significant effect on transport.
Fluctuation power summed for each
$k_y$
 for frequencies up to
100 kHz, smoothed. The contribution to fluctuation power is
negligible past 100 kHz. The fluctuation power decreases
substantially when a mirror configuration is introduced, but no
trend is seen otherwise and the
$k_y$
 spectra remain exponential.
Note the logarithmic scale.

Previous simulations in a flat field (Friedman Reference Friedman2013) predicted frequency and wavenumber spectra that can be fit with many power laws or exponentials, but the data presented here (figures 10, 13, 12) appear to follow an exponential relationship within measurement variation.
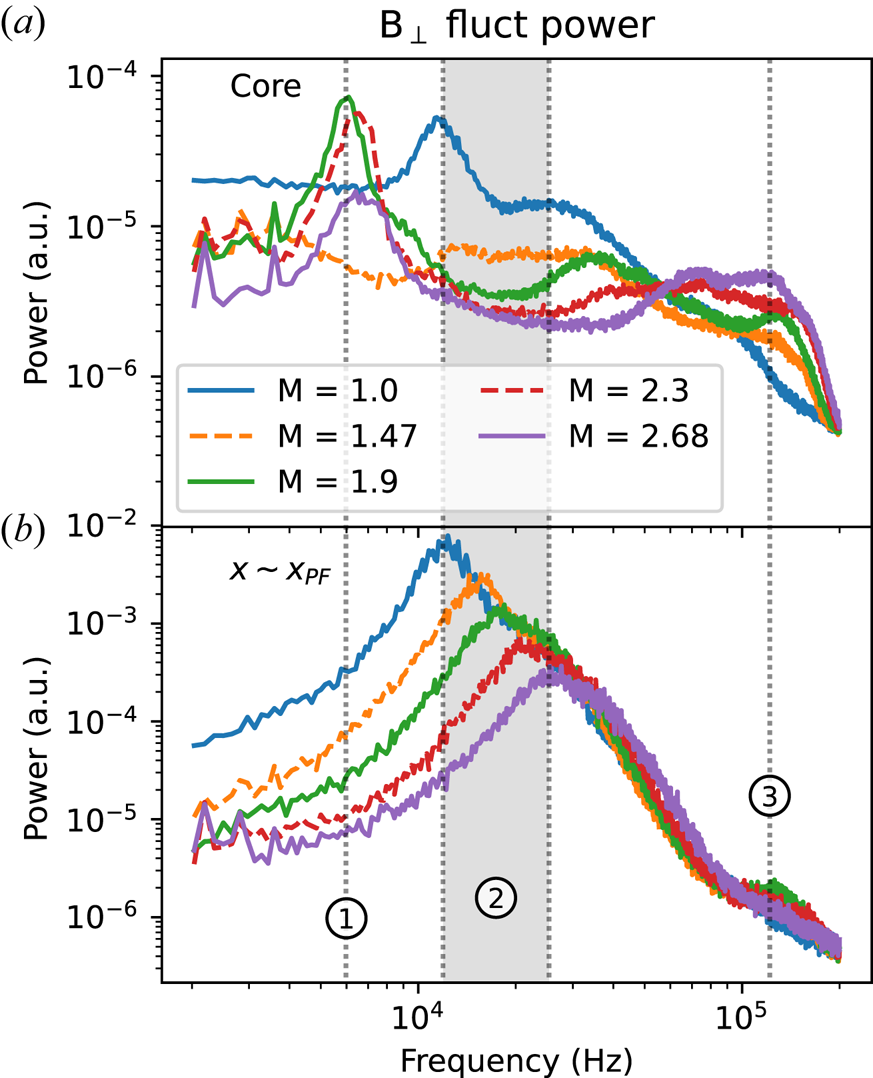
The
$B_\perp$
 fluctuation power averaged at
the core from 0 to 3 cm (
$a$
 ) and around the
peak-fluctuation point
$(x \sim x_{\rm PF})$
 (
$b$
 ). Fluctuation power decreases
across the board with mirror ratio except for core frequencies close
to
$\varOmega _{\rm ci}$
 . Peaks around
10–30 kHz at
$x_{\rm PF}$
 are consistent (region 2) with
drift-Alfvén waves and the near-cyclotron frequency features
in the core may be resonating Alfvén waves created by the
magnetic mirror. Frequencies below 2 kHz are dominated by
instrumentation noise and thus excluded.

Turbulence measurements can be directly compared with theoretical predictions and
other devices, as summarized by Liewer (Reference Liewer1985). For saturated drift-wave turbulence, one expects the
normalized fluctuation level
$\tilde {n}/n \sim 1/\langle k_\perp \rangle L_n$
 , where
$k_\perp$
 is some typical wavenumber. The
power-weighted
$k_y$
 (calculated from figure 12) was approximately
$15\ {\rm rad}\ {\rm m}^{-1}$
 , which is an order of magnitude too small
to satisfy this relationship. The
$\tilde {n}/n$
 scaling with
$\rho _s / L_n$
 , however, is roughly consistent with
drift-wave turbulence level saturation: the latter is
${\approx }3$
 times larger. These comparisons suggest
that the large, low-frequency fluctuations (
${\sim }3$
 kHz, which had even smaller
$k_y$
 ) may have a drift-wave turbulence component
but are dominantly driven by other instabilities. No trend is seen in
$\rho _s / L_n$
 and
$1/k_y L_n$
 when the mirror ratio is varied.
Core fluctuations appear to decrease dramatically, as seen in the
$I_\text {sat}$
 fluctuation power (figure 7). The
$I_\text {sat}$
 decorrelation time increases from
${\sim }0.7$
 ms for
$M=1$
 to
${\sim }2.5$
 ms for
$M=2.68$
 . At
$x=x_{\rm PF}$
 , decorrelation times for all mirror ratios
remained at
$0.2$
 ms.
3.5 Magnetic fluctuations
The perpendicular magnetic fluctuation (
$B_\perp$
 ) component of the drift-Alfvén wave
can be seen in figure 13. These
$B_\perp$
 fluctuations are spatially and spectrally
coincident with the electrostatic fluctuations (figure 10). Drift-Alfvén waves have been studied in
the LAPD in the past (Maggs & Morales Reference Maggs and Morales1997; Vincena & Gekelman Reference Vincena and Gekelman2006); strong coupling is observed for
$\beta _e > m_e / m_i$
 (the electron-ion mass ratio), which
is satisfied in this study. The Alfvén speed
$\omega / k_\parallel = v_A = B/\sqrt {4 {\rm \pi}n M}$
 (given
$\omega \ll \varOmega _{\rm ci}$
 ) when averaged over the entire column
ranges from
${\sim }450$
 to
${\sim }1600\ {\rm km}\ {\rm s}^{-1}$
 . A
$k_\parallel$
 corresponding to a wavelength
$\lambda = 34$
 m roughly falls within the bound
established by the kinetic and inertial Alfvén wave dispersion relations
at the frequency peaks observed at
$x \sim x_{\rm PF}$
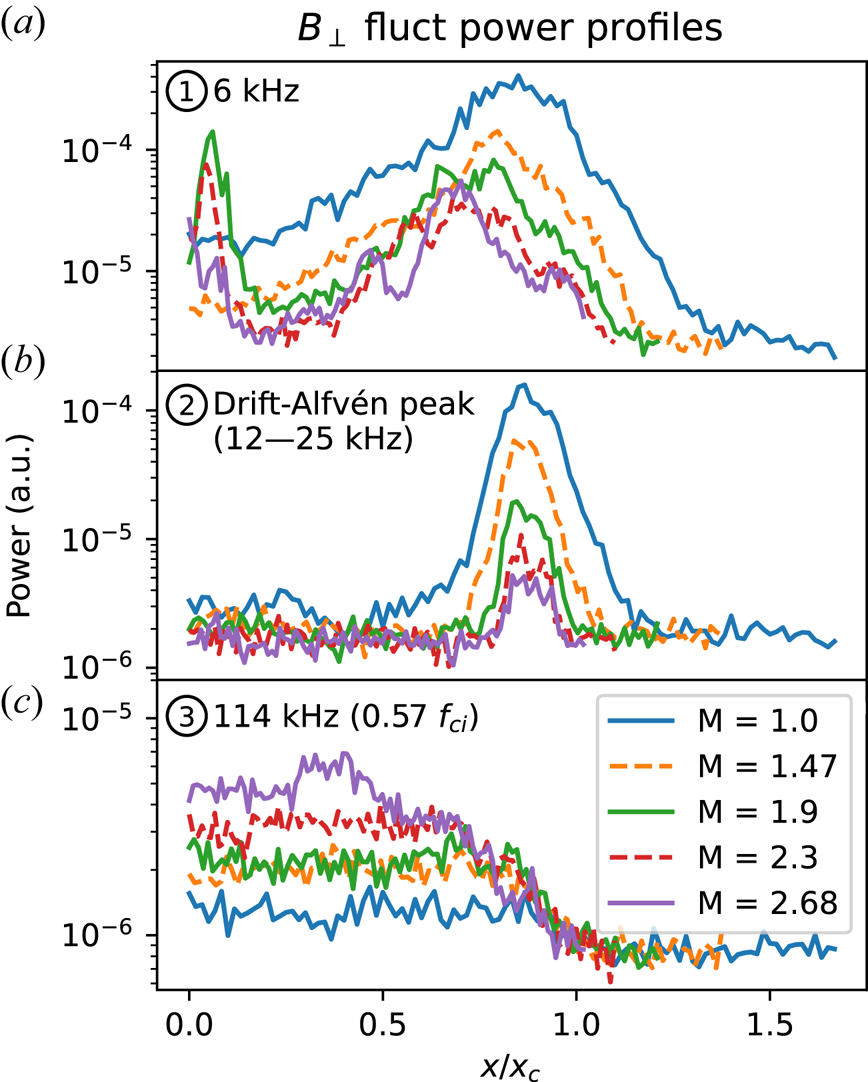
 seen in figure 13. The lengthening of field lines caused by curvature
accounts for at most
$10\,\%$
 of the change in frequency.
The spatial extent of the
$B_\perp$
 features identified in figure 13 are plotted in figure 14. Feature 1 at
${\approx }6$
 kHz shows increased fluctuation
amplitudes at
$x=0$
 for mirror ratios 1.9 and above, but for
$M=1$
 and
$M=1.47$
 there is no increase in fluctuation power.
A similar feature, but at a much smaller level, is observed in the
$I_\text {sat}$
 fluctuation power in the core as well. This
core feature may be caused by the hole in the core seen in the
$I_\text {sat}$
 profile (figure 3) driving low-amplitude waves or instabilities.
Feature 2 in figure 14 is the
magnetic component of the drift-Alfvén wave. The fluctuation power peaks
at the gradient region and corresponds with the peak in density fluctuations
(figure 7).
The
$B_\perp$
 fluctuation power profiles for
the three regions shown in figure 13: region 1 (6 kHz) (
$a$
 ), region 2, where frequencies
are taken from the peaks of the drift-Alfvén waves for each
mirror ratio, (
$b$
 ) and region 3 (114 kHz) (
$c$
 ).

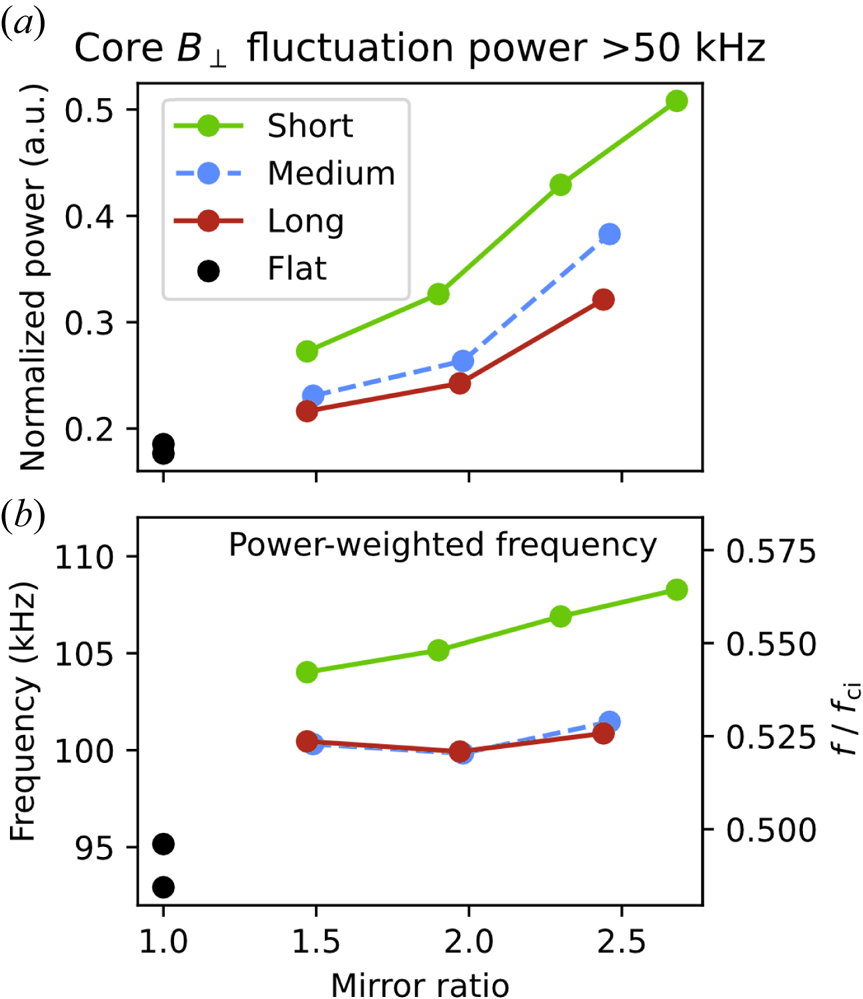
Feature 3 is particularly interesting because this the only fluctuating quantity
to increase with mirror ratio, seen in figure 15. This feature may be broad evanescent
Alfvénic fluctuations from the plasma source. These fluctuations have
been observed in the LAPD in the source region alongside an Alfvén wave
maser (Maggs, Morales & Carter Reference Maggs, Morales and Carter2005). Note that the Alfvén maser cannot enter the mirror
cell at mirror ratios greater than 1.75 because the Alfvén maser
resonates at 0.57
$f_{\rm ci}$
 but the midplane is always at or near
500 G.
Summed fluctuation power of
$B_\perp$
 in the core (
$x/x_c \leqslant 0.3$
 ) as a function of mirror length
and ratio. (
$a$
 ) The fluctuation power is
normalized by the sum of the full-spectrum summed power. (
$b$
 ) The frequency of the power
distribution >50 kHz weighted by the fluctuation
power.

The sub-
$2$
 kHz modes in
$B_\perp$
 and the harmonics of these modes are
nearly constant in power across the entire plasma; these features are likely
perturbations from the magnet power supplies and thus ignored. The lack of
radial, azimuthal and axial structure in these magnetic signals below
2 kHz and narrow bandwidth indicate a non-plasma origin. Significant
radial and azimuthal structure in
$B_\perp$
 fluctuation power starts to appear in
frequencies larger than 4 kHz.
4 Two-dimensional structure
The perpendicular magnetic field structure is measured by collecting
$x\unicode{x2013}y$
 planar Bdot (
${\rm d}B_{\{x, y, z \} } / {\rm d}t$
 ) data alongside a stationary, axially separated
$I_\text {sat}$
 reference probe (DR2).
This probe provides a phase reference for the magnetic field fluctuations, allowing
a two-dimensional map of relative phase to be constructed over many shots. Only the
region around
$x_{\rm PF}$
 was measured because of constraints on probe
movement. The amplitude and phases for each magnetic field component are then used
to reconstruct the local magnetic fluctuation vector
$\boldsymbol {B}$
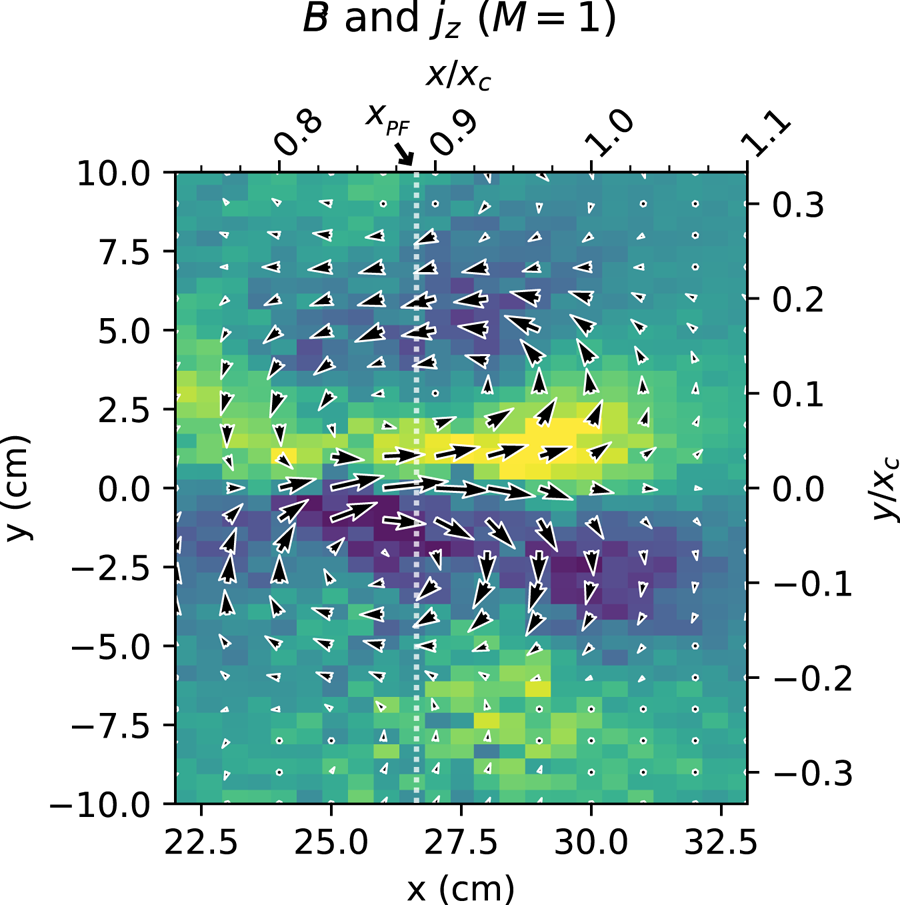
 . The axial current density structure,
$j_z$
 , can be derived from this vector field.
$\boldsymbol {B}$
 and the corresponding
$j_z$
 for the flat-field (
$M=1$
 ) case can be seen in figure 16. Two main current channels can be seen with
the magnetic fields circulating around them. This structure quickly decoheres in
time as expected in a turbulent plasma. At higher mirror ratios, the field magnitude
and corresponding current density decrease (which was also seen in
DR1: figure 13).
Perpendicular magnetic field and the derived current density for the
flat-field (
$M=1$
 ) case using a Bdot probe with an
axially separated
$I_\text {sat}$
 reference
(DR2). The
$x\unicode{x2013}y$
 plane was centred near
$x_{\rm PF}$
 .

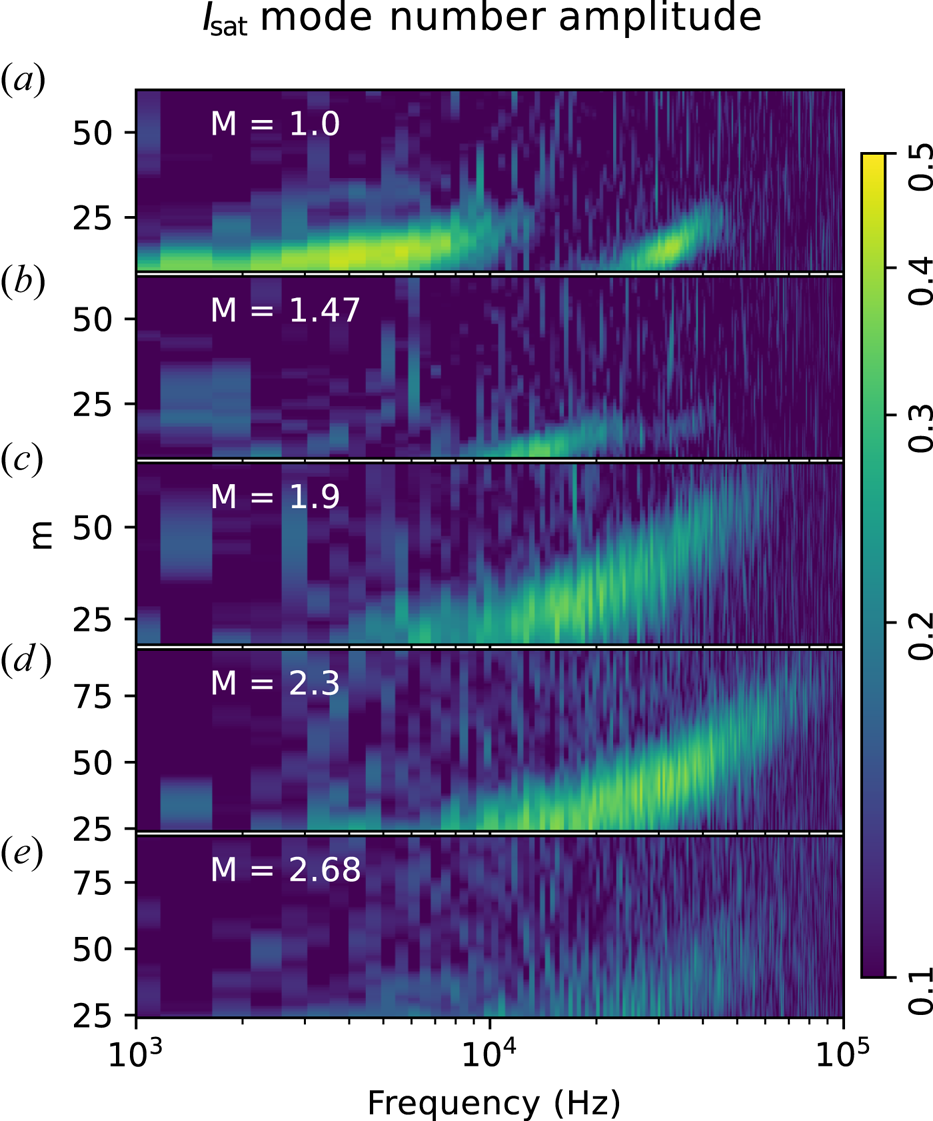
Using two, axially separated, correlated
$I_\text {sat}$
 measurements (DR2), with
one collecting
$x\unicode{x2013}y$
 planar data, the azimuthal mode number
$m$
 (radially integrated) was calculated.
Higher-frequency and higher-
$m$
 features are seen with increasing mirror ratio
(figure 17). The increased
frequencies may be caused by a change in Doppler shift by the
$\boldsymbol {E} \boldsymbol {\times }\boldsymbol {B}$
 flow. This higher-
$m$
 trend suggests that azimuthal structures do not
scale with increased plasma radius but instead remain roughly the same size. The
limited planar probe movement caused an increase in the lower bound on
$m$
 at higher mirror ratios. At mirror ratios 1.47
and higher, the lower-frequency component (<10 kHz) appears to
decrease significantly in amplitude. Calculating
$k_\perp$
 from
$m$
 evaluated at
$x \sim x_c$
 yields similar
$k_y$
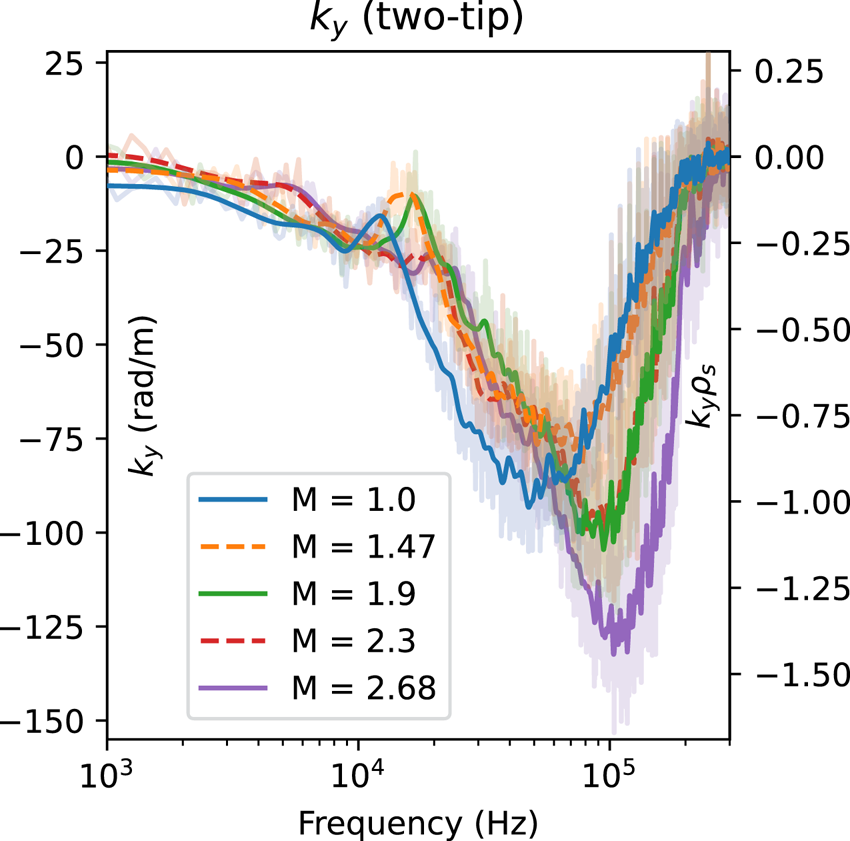
 values as the two-tip technique (figure 18). The average
$k_y$
 for a given frequency can be calculated using
two Vf tips on the same probe by calculating the phase difference and dividing by
the spatial separation of
$5$
 mm:
$k_y = \phi _{\text {vf1},\text {vf2}} / \Delta y$
 (Beall, Kim & Powers Reference Beall, Kim and Powers1982). The maximum
$|k_y|$
 measurable before aliasing is
${\rm \pi} / \Delta y \approx 628\ {\rm rad}\ {\rm m}^{-1}$
 . As seen in figure 18, the
$k_y$
 spectrum remains similar across mirror ratios,
but the wavenumber extends further into higher frequencies with increasing mirror
ratio. These azimuthal mode numbers and gradient scale lengths are consistent
with linear simulations using the three-dimensional fluid code
BOUT (Popovich et al.
Reference Popovich, Umansky, Carter and Friedman2010) in the flat, unbiased case.
Azimuthal mode number
$m$
 amplitudes calculated from two
axially separated, correlated,
$I_\text {sat}$
 probes. Increasing mirror ratio (
$a$
 –
$e$
 ) leads to increased
$m$
 at higher frequencies.
(DR2).

The value of
$k_y$
 averaged about
$x_{\rm PF}$
 and smoothed for each mirror ratio
calculated using two vertically separated Vf tips on the same probe.
Little change is seen in
$k_y$
 at lower frequencies but higher
frequencies tend towards larger
$k_y$
 at higher mirror ratios.

5 Discussion
5.1 Lack of mirror-driven instabilities
No evidence is seen for mirror-driven instabilities – curvature, loss cone or otherwise. Given the LAPD parameters in this study (tables 1 and 2), the collision frequencies are sufficiently high such that the mirror is in the gas-dynamic regime: losses out of the mirror throat are governed by gas-dynamic equations rather than free streaming through the loss cone. To be in the gas-dynamic regime, the mirror length must exceed the mean free path of the ions (Ivanov & Prikhodko Reference Ivanov and Prikhodko2013)

where
$L$
 is the mirror length,
$\lambda _{\rm ii}$
 is the ion mean free path and
$M$
 is the mirror ratio. These collisions
populate the loss cone and maintain a (cold) Maxwellian distribution,
eliminating the possibility of loss-cone-, ion-driven instabilities like
the Alfvén-ion cyclotron (AIC) (Casper & Smith Reference Casper and Smith1982) or drift-cyclotron loss-cone
(DCLC) (Simonen Reference Simonen1976; Kanaev Reference Kanaev1979) instabilities that have been
observed in other (historic) devices.
The paraxial, approximate interchange growth rate is (Post Reference Post1987; Ryutov et al. Reference Ryutov, Berk, Cohen, Molvik and Simonen2011)

which yields
$\varGamma _0 \approx 1.2$
 kHz using
$L_M \approx 7$
 m and
$L_P = 17$
 m. Here,
$c_s$
 is used instead of
$\overline {v_i}$
 because
$T_i \ll T_e$
 and the mirror length
$L$
 is split to distinguish between the
contributions of the plasma length and mirror length to inertia and to curvature
drive, respectively. Interchange is not visible, in part because the aspect
ratio of these mirrors is quite large, limiting the growth rate of interchange.
The length of the mirror (3.5 m), radius of curvature
(6–7 m) and plasma column (17 m) are much larger than the
radius of the plasma (0.5 m maximum), so the plasma inertia is large
relative to the instability drivers. Line tying to the cathode may further lower
the growth rate. The hot cathode used for plasma formation could function as a
thermionic endplate that can supply current to short out the flute-like
interchange perturbations. Line tying has been seen in flux rope experiments on
the LAPD using a hotter, denser source (Van Compernolle
et al.
Reference Van Compernolle, Gekelman, Pribyl and Cooper2011), also in other devices (Fornaca,
Kiwamoto & Rynn Reference Fornaca, Kiwamoto and Rynn1979), and is
why interchange was not seen in the earliest mirror machines (Post Reference Post1987). Note that the plasma terminates on
the cathode or end plates before the magnetic field flares out, so there is no
contribution to stability from an expander tank as seen in other GDTs (Ryutov
et al.
Reference Ryutov, Berk, Cohen, Molvik and Simonen2011; Ivanov & Prikhodko Reference Ivanov and Prikhodko2013). Finite Larmor radius (FLR)
effects may provide a stabilizing effect for larger azimuthal mode numbers. At
the highest mirror ratio, assuming a plasma radius of
$a_0 =\sqrt {2.68} * x_{\rm PF}=43$
 cm, the FLR stability criterion
$({m}/{2})({\rho _i L}/{a_0^2}) > 1$
 (Ryutov et al.
Reference Ryutov, Berk, Cohen, Molvik and Simonen2011) suggests a stabilizing effect may
be present for azimuthal mode numbers
$m > 4$
 .
If the curvature-induced interchange instability were observable, then
introducing a mirror configuration would lead to new features in
$I_\text {sat}$
 and Bdot fluctuations. In particular,
low-frequency mode(s) – likely less than 10 kHz given the low
$m$
 number and plasma rotation rates –
would be observed growing from the pressure gradient region. For onset of the
interchange instability, the mirror curvature or plasma pressure would need to
be increased but the precise conditions required for this onset are not yet
known for the LAPD.
Interchange could also be at least partially stabilized by the continuous
production of electrons in the core that are electrostatically trapped by the
ambipolar potential (Guest & Harris Reference Guest and Harris1971). The intuition behind this stabilization mechanism is as
follows: electrons are continuously produced via ionization of neutrals, and any
change in the local potential will cause more or fewer electrons to be lost out
the ends of the device along that field line, counteracting the potential
change. This stabilization mechanism has been experimentally demonstrated to
completely suppress interchange when the ambipolar potential
$\varPhi \gtrsim 6T_e$
 (Komori et al.
Reference Komori, Higuchi, Suetsugu, Yonesu and Kawai1987).
The
$\boldsymbol {E} \boldsymbol {\times } \boldsymbol {B}$
 shear flow present (figure 6) may also make a contribution to the
stabilization of interchange (Bagryansky et al.
Reference Bagryansky, Lizunov, Zuev, Kolesnikov and Solomachin2003, Reference Bagryansky, Beklemishev and Soldatkina2007; Beklemishev et al.
Reference Beklemishev, Bagryansky, Chaschin and Soldatkina2010; Ryutov
et al.
Reference Ryutov, Berk, Cohen, Molvik and Simonen2011). The estimated shearing rate is
between 3 and 10 kHz, which is greater than the estimated
${\approx }1.2$
 kHz growth rate of the interchange
mode.
5.2 Instabilities driving turbulence
Rotational interchange can be significant driver of the broadband turbulence spectrum in the LAPD, particularly when a biased limiter is installed. This observation has been confirmed by both linear simulations (Popovich et al. Reference Popovich, Umansky, Carter and Friedman2010) and biasing experiments (Schaffner Reference Schaffner2013).
This rotational interchange mode has the following attributes, as summarized by
Jassby (Reference Jassby1972): flute-like (
$k_\parallel =0)$
 ,
$|e\tilde {\phi }/T_e|/|\tilde {n}/n| \gtrsim 1$
 , radial potential phase variation
$45$
 to
$90^\circ$
 , maximum possible
$|e\tilde {\phi }/T_e| < 1$
 . All of these attributes are seen for the
lower-frequency (3 kHz) mode. The Vf radial phase variation when
$M>1$
 is not clearly seen because the coherency
is dramatically reduced along the field line. The rotational interchange mode
could couple with the drift wave at
$k_\parallel = {\rm \pi}/ L \sim 0.37\ {\rm rad}\ {\rm m}^{-1}$
 (
$n=0.5$
 ), which has been observed in the past
(Schaffner Reference Schaffner2013) and likely present
here. Estimates of shearing rate from the
$\boldsymbol {E}\boldsymbol {\times }\boldsymbol {B}$
 flow velocity profile (figure 6), calculated fluctuation ratios and
radial phase shift variation suggest that Kelvin–Helmholtz-driven
turbulence is not significant, if present at all. Historically, biasing a
limiter has been required to clearly observe the Kelvin–Helmholtz
instability (Horton et al.
Reference Horton, Perez, Carter and Bengtson2005; Schaffner
et al.
Reference Schaffner, Carter, Rossi, Guice, Maggs, Vincena and Friedman2012; Schaffner Reference Schaffner2013).
Low-frequency density fluctuations may also be driven by a flute-like
conducting-wall temperature-gradient instability which only requires an electron
temperature gradient to grow (even with straight field lines) (Berk, Ryutov
& Tsidulko Reference Berk, Ryutov and Tsidulko1991). Simulations of
turbulence in the LAPD suggest the possible presence of these conducting-wall
modes (CWMs) which have the highest growth rate for
$m \leqslant 20$
 (Friedman et al.
Reference Friedman, Carter, Umansky, Schaffner and Joseph2013). This lower-
$m$
 mode could be responsible for the peak
around
$3$
 kHz in the
$M=1$
 $I_\text {sat}$
 fluctuation (figure 10) and azimuthal mode numbers (figure 17) and for the
low-frequency low-
$k_\parallel$
 or flute-like behaviour (figure 11). This CWM may also be
responsible for flatter electron temperature profiles seen in previous studies
(Schaffner Reference Schaffner2013; Perks
et al.
Reference Perks, Mordijck, Carter, Van Compernolle, Vincena, Rossi and Schaffner2022) (figure 5).
These linearly unstable modes may be outgrown by a rapidly growing nonlinear
instability that couples to drift-like modes, as suggested by simulations
(Friedman et al.
Reference Friedman, Carter, Umansky, Schaffner and Joseph2013). This nonlinear instability is
driven by the density gradient at an axial mode number of
$n=0$
 and nonlinearly transfers energy to
$n \neq 0$
 fluctuations.
The CWM and nonlinear instability may be present in these mirror experiments but the spectra are adequately explained by linearly unstable modes. Precise identification these modes requires further study; neither of these instabilities have been directly observed in the LAPD.
5.3 Causes of particle flux reduction
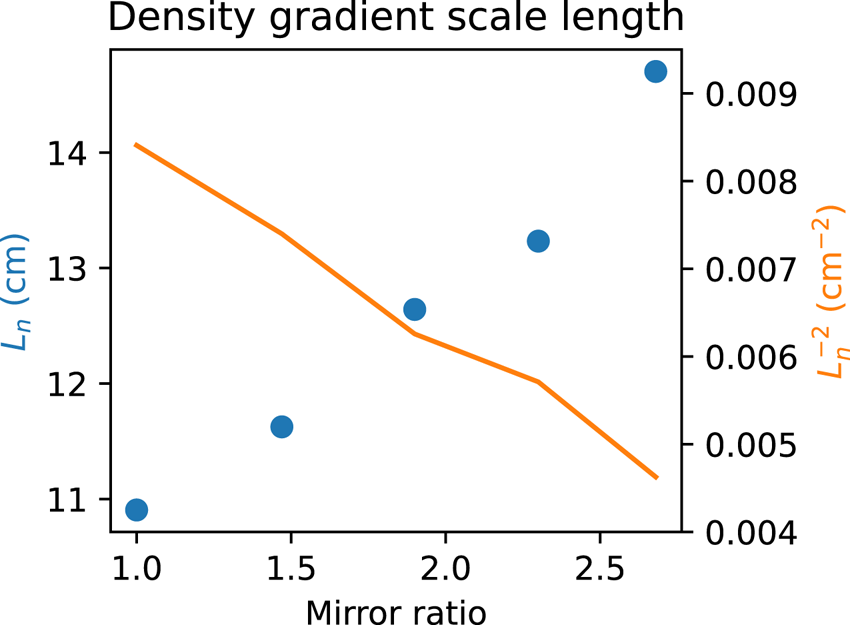
The reduction in particle flux explained by a reduction in density fluctuations
likely caused by a increased gradient scale length
$L_n = {n}/{\boldsymbol {\nabla } n }$
 (figure 19), decreasing the linear drift-wave growth rate and
saturation level seen in § 3.4. This gradient length reduction may also reduce the growth rate
of the rotational interchange instability, which may be the dominate driver for
the low-frequency large-amplitude density fluctuations.
Gradient scale length
$L_n$
 and the associated term in the
drift-wave growth rate
$L_n^{-2}$
 . This scale length was
calculated over a 3 cm region around
$x_\text {PF}$
 (peak-fluctuation region) at
the midplane. Increasing the mirror ratio increases the gradient
scale length, which suggests weakening of the underlying instability
driver.

The decorrelation time of
$I_\text {sat}$
 time series data is around 0.15 ms
at
$x_\text {PF}$
 . An estimate of the
$\boldsymbol {E \times B}$
 flow shear from figure 6 (DR2) yields a
shearing time between 0.1 and 0.3 ms at
$x_\text {PF}$
 . These times suggest that spontaneous flow
shear may be important for suppressing turbulence, as seen in other studies (Cho
et al.
Reference Cho2005; Schaffner
et al.
Reference Schaffner, Carter, Rossi, Guice, Maggs, Vincena and Friedman2013), at all mirror ratios. However,
no clear trend in shearing strength is seen with mirror ratio.
It is important to note that the electron thermal diffusion time along the field
line is very long compared with the frequency of the drift wave (
$\omega \gtrsim k_\parallel \bar {v}_e^2 / \nu _{\rm ei}$
 ) (Goldston Reference Goldston1995) so the electron temperature along the field line
may not be constant on the drift-wave time scale. This factor is not taken into
account in this analysis but may have substantial impact on interpretations of
the measured phase shift.
6 Conclusions and future work
Turbulence and transport were studied in mirrors with varying lengths and ratios using the flexible magnetic geometry of the LAPD. Particle flux and fluctuation amplitudes decreased up to a factor of two when the mirror ratio was increased. The primary drivers of turbulence were identified as the rotational interchange mode, caused by spontaneous rotation, and unstable drift-Alfvén waves driven by the density gradient. The decrease in density fluctuation amplitudes can be attributed to an increase in the gradient scale length caused by the dimensionally wider plasma at the mirror midplane. Despite imposing a mirror configuration, no signs of mirror-driven instabilities were observed. The highly collisional, GDT-like plasma produced suppressed any velocity space instabilities. The interchange growth rate was likely suppressed to an undetectable level by line tying, in-cell electron production and shear flow.
Future experiments in hotter regimes with the new LaB6 cathode (Qian
et al.
Reference Qian2023) will need to be performed to evaluate
the robustness of these results, particularly concerning the stabilization of
curvature-induced interchange. Additionally, the source field should be matched to
the mirror midplane field so that the plasma remains at the same radius to isolate
geometric effects. Simultaneous measurements using flux and/or vorticity probes and
$I_\text {sat}$
 are needed to concretely determine if azimuthal
flow shear is modified by the mirror field, and to quantify the effect of flows on
rotational interchange and drift-wave instability drive in general. Multiple
simultaneous axial measurements of potential would enable better understanding of
the axial wavenumber and identification of possible modes.
Acknowledgements
Editor Cary Forest thanks the referees for their advice in evaluating this article.
Funding
This work was performed at the Basic Plasma Science Facility, which is a DOE Office of Science, FES collaborative user facility and is funded by DOE (DE-FC02-07ER54918) and the National Science Foundation (NSF-PHY 1036140). The authors would like to thank Dr G. Rossi and Dr S. Vincena for probe set-up and assistance with data collection, and Dr M. Abler, Professor W. Gekelman and Professor G. Morales for insightful discussion.
Declaration of interests
The authors report no conflict of interest.
Data availability
The data and code supporting this study are available from the corresponding author upon reasonable request.






































 Open access

