1. Introduction
The concept of Alaskan-type intrusions was first reported and named by Taylor and Noble (Reference Taylor and Noble1960) and Irvine (Reference Irvine1974). These intrusions are mafic–ultramafic in composition and characterized by concentric zoning, an abundance of olivine, clinopyroxene and hornblende, and a lack of orthopyroxene and plagioclase (Moores, Reference Moores1973; Snoke et al. Reference Snoke, Sharp, Wright and Saleeby1982). It is well accepted that Alaskan-type intrusions form at convergent plate margins and represent arc magmas or arc-root complexes (Irvine, Reference Irvine1974; Brügmann et al. Reference Brügmann, Drommer, Reichl and Boge1997; Abd El-Rahman et al. Reference Abd El-Rahman, Helmy, Shibata, Yoshikawa, Arai and Tamura2012; Su et al. Reference Su, Qin, Sakyi, Malaviarachchi, Liu, Tang, Xiao, Sun, Ma and Mao2012, Reference Su, Qin, Santosh, Sun and Tang2013; Khedr and Arai, Reference Khedr and Arai2016). Furthermore, these types of intrusions are important for studying the evolution of orogens (Irvine, Reference Irvine1974; Himmelberg and Loney, Reference Himmelberg and Loney1995; Brügmann et al. Reference Brügmann, Drommer, Reichl and Boge1997; Helmy and Mogessie, Reference Helmy and Mogessie2001; Helmy and El Mahallawi, Reference Helmy and El Mahallawi2003; Pertsev and Savelieva, Reference Pertsev and Savelieva2005; Krause et al. Reference Krause, Brugmann and Pushkarev2011; Su et al. Reference Su, Qin, Sakyi, Malaviarachchi, Liu, Tang, Xiao, Sun, Ma and Mao2012). Alaskan-type intrusions have been reported in many locations (e.g. British Columbia, Canada; Russian Far East; New Zealand; California, USA; New South Wales, Australia; and Abu Hamamid, Egypt (Findlay, Reference Findlay1969; James, Reference James1971; Grapes, Reference Grapes1975; Irvine, Reference Irvine1976; Clark, Reference Clark1980; Snoke et al. Reference Snoke, Quike and Bowman1981, Reference Snoke, Sharp, Wright and Saleeby1982; Johan et al. Reference Johan, Ohnenstetter, Slansky, Barron and Suppel1989; Hammark et al. Reference Hammark, Noxon, Wong and Paterson1990; Elliott and Martin, Reference Elliott and Martin1991; Nixon and Hammack, Reference Nixon and Hammack1991; Batanova et al. Reference Batanova, Pertsev, Kamenetsky, Ariskin, Mochalov and Sobolev2005; Helmy, Reference Helmy2005; Helmy et al. Reference Helmy, Yoshikawa, Shibata, Arai and Kagami2015)). Numerous Alaskan-type intrusions have been recognized in China, including the Jinggu Danxi intrusions of Yunnan (Zhang et al. Reference Zhang, Zhang and Li1992, Reference Zhang, Guo and Wang1997), the Zhamashi intrusions of the Qilian Block in Qinghai Province (Liu et al. Reference Liu, Xiao, Yuan and Yan2005; Tseng et al. Reference Tseng, Zuo, Yang, Yang, Tung and Liu2009), and part of the Central Asian Orogenic Belt in NW China (Su et al. Reference Su, Qin, Santosh, Sun and Tang2013).
The Hudesheng mafic–ultramafic intrusions are located in the Oulongbuluke Block (also called the Quanji Block), to the north of the Qaidam Block. Previous studies of the Oulongbuluke Block focused on the evolution of the Precambrian metamorphic basement (Chen et al. Reference Chen, Wang and Chen2007, Reference Chen, Liao, Wang, Santosh, Sun, Wang and Mustafa2013; Huang et al. Reference Huang, Zhang, Ba, Liao and Chen2011; Yu et al. Reference Yu, Zhang, Li, Sun, Li and Liu2017) and on the granites and volcanic rocks (Wu et al. Reference Wu, Gao, Wu, Chen, Wooden, Mazadab and Mattinson2008, Reference Wu, Lei, Wu and Li2016; Feng et al. Reference Feng, Qin, Fu and Liu2015). Some studies suggested that the mafic–ultramafic intrusions in the Oulongbuluke Block were formed in a post-collisional extensional environment (Zhou et al. Reference Zhou, Du, Du, Song, Ling and Xia2014, Reference Zhou, Xia, Wu, Du, Wang, Xia, Song and Song2015). The ultrahigh-pressure metamorphic belt located between the Oulongbuluke and Qaidam blocks, where eclogites have been identified, records a number of Neoproterozoic – early Palaeozoic geological events (Yang et al. Reference Yang, Song, Xu and Wu2001; Chen et al. Reference Chen, Wang and Chen2007; Zhang et al. Reference Zhang, Song, Zhang and Niu2008a, b, Reference Zhang, Ellis, Christy, Zhang, Niu and Song2009a, b, c). Despite the many studies that have focused on this area, there is still controversy concerning (1) the time span of subduction and (2) the role of continent–continent collision. However, some studies have concluded that ocean closure occurred during the early Palaeozoic (Song et al. Reference Song, Yang, Liou, Wu, Shi and Xu2003; Wu et al. Reference Wu, Yang, Xu and Wooden2004, Reference Wu, Gao, Wu, Chen, Wooden, Mazadab and Mattinson2008). The lack of direct and robust evidence has limited our understanding of the tectonic evolution of the Qaidam and Oulongbuluke blocks. The Hudesheng mafic–ultramafic intrusion can therefore provide valuable geological evidence to help resolve these controversies.
Here we report detailed field observations, petrology, zircon U–Pb ages, Lu–Hf isotope data, whole-rock major- and trace-element geochemistry, and mineral compositions for the Hudesheng intrusions. The primary aims are to (1) petrologically characterize the Hudesheng intrusions and (2) discuss the genesis and the tectonic environment of the intrusions. Furthermore, our results provide valuable age constraints on the evolution of the North Qaidam region.
2. Geological setting
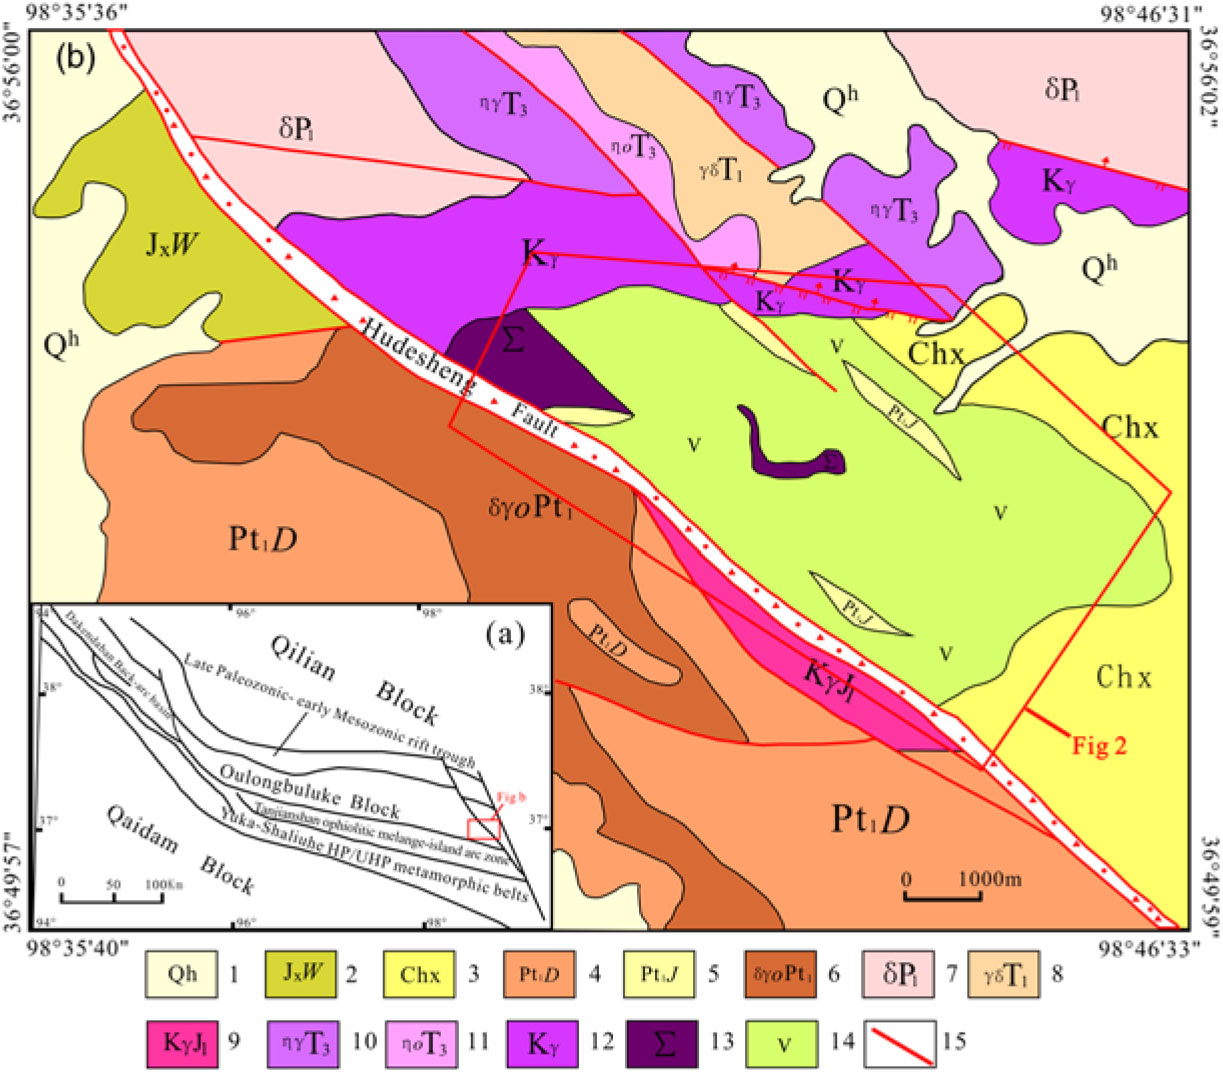
The Oulongbuluke Block is located on the northeastern margin of the Qinghai–Tibet Plateau, and trends WNW–ESE. The Oulongbuluke Block is bordered by the Qilian Block to the north and the Qaidam Block to the south, and is cut by the Altyn Fault in the west. The northern Qaidam Block is divided into the following tectonic units (from north to south): the Zongwu–Longshan rift trough, the Oulongbuluke Block, and the North Qaidam high- to ultrahigh-pressure metamorphic belt (Fig. 1a; Lu et al. Reference Lu, Yu and Zhao2002a; Pan and Li, Reference Pan and Li2002). Few previous studies have focused on the Oulongbuluke Block, and existing data show that this block is composed mainly of Palaeoproterozoic metamorphic basement and overlying Nanhua–Sinian strata (Lu et al. Reference Lu, Yu and Zhao2002a; Xin et al. Reference Xin, Hao and Wang2002; Lu et al. Reference Lu, Li, Chen, Yu and Jin2004; Wang et al. Reference Wang, Lu, Mo, Li and Xin2005; Wang, Reference Wang2006). The Precambrian metamorphic basement of the Oulongbuluke Block is composed of the Delingha complex, Dakendaban Group and Wandonggou Group (Fig. 1b), which are in tectonic contact with each other (Lu et al. Reference Lu and Wang2002 a). The Delingha complex mainly consists of Palaeoproterozoic granitic gneiss, amphibolite and migmatite (Lu et al. Reference Lu and Wang2002a). Previous zircon U–Pb age data show the granitic gneisses formed between 2.47 and 2.35 Ga (Lu et al. Reference Lu and Wang2002 a; Gong et al. Reference Gong, Chen and Wang2012). The Dakendaban Group can be divided into lower and upper sub-groups. The lower Dakendaban sub-group, located in the north of Wulan and Delingha, is composed of a set of high amphibolite-facies volcano-sedimentary rocks (Chen et al. Reference Chen, Zhang, Sun, Wang and Kusky2012), whereas the upper sub-group is mainly exposed in the Delingha region and comprises supracrustal rocks similar to the khondalites (Chen et al. Reference Chen, Zhang, Sun, Wang and Kusky2012). Yu et al. (Reference Yu, Wei and Sun1994) determined that the Wandonggou Group is composed of greenschist-facies metasedimentary rocks and minor mafic metavolcanic rocks with metamorphic age of 1022 ± 64 Ma. Within the study area (Fig. 1b), the Dakendaban Group is composed of marble and biotite–plagioclase gneiss; the Jinshuikou Group is composed of fine-grained marble, plagioclase–amphibole schist and biotite–plagioclase gneiss; and the Wandonggou Group consists of chlorite–albite schist and chlorite schist, interbedded with marble and muscovite schist (Fig. 1b).
(a) Geological sketch map shows the tectonic locality of study area (modified after Lu et al. Reference Lu and Wang2002 a; Chen et al. Reference Chen, Wang and Chen2007). (b) A detailed geological map of the Hudesheng Region (modified after Qinghai Geological Survey of Nuclear Industry). The Hudesheng mafic–ultramafic intrusions are located in the rectangular box and are further enlarged in Figure 2; 1 – Quaternary; 2 – Jixian Period Wandonggou Group; 3 – Changcheng Period Xiaomiao Group; 4 – Palaeoproterozoic Dakendaban Group; 5 – Palaeoproterozoic Jinshuikou Group; 6 – Palaeoproterozoic tonalite gneiss; 7 – Early Permian diorite; 8 – Early Triassic granodiorite; 9 – Early Jurassic K-feldspar granite; 10 – Late Triassic monzonitic granite; 11 – Late Triassic quartz monzonite; 12 – K-feldspar granite; 13 – mafic–ultramafic intrusions; 14 – gabbro; 15 – fault.
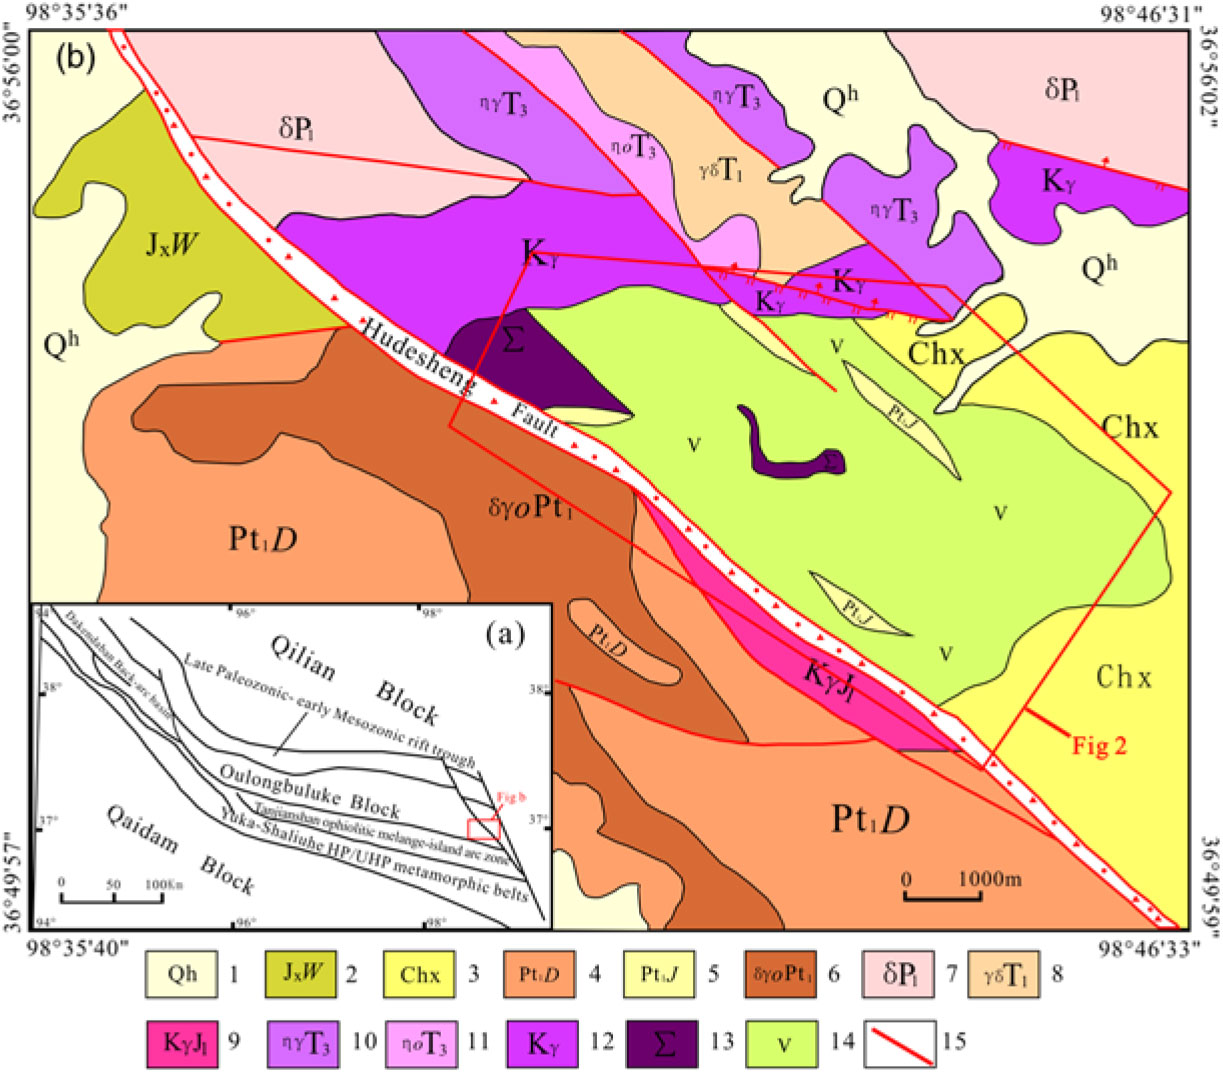
The Hudesheng mafic–ultramafic intrusions are located 30 km to the east of Wulan county and 15 km to the west of Chaka Mohe farm (36° 51′ 55′′–36° 54′ 50′′ N, 98° 39′ 32′′–98° 44′ 31′′ E). A detailed field description of the Hudesheng mafic–ultramafic intrusion is provided in Section 3.a.
3. Geology of the Hudesheng mafic–ultramafic body
3.a. Field observations
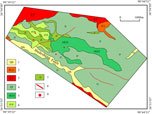
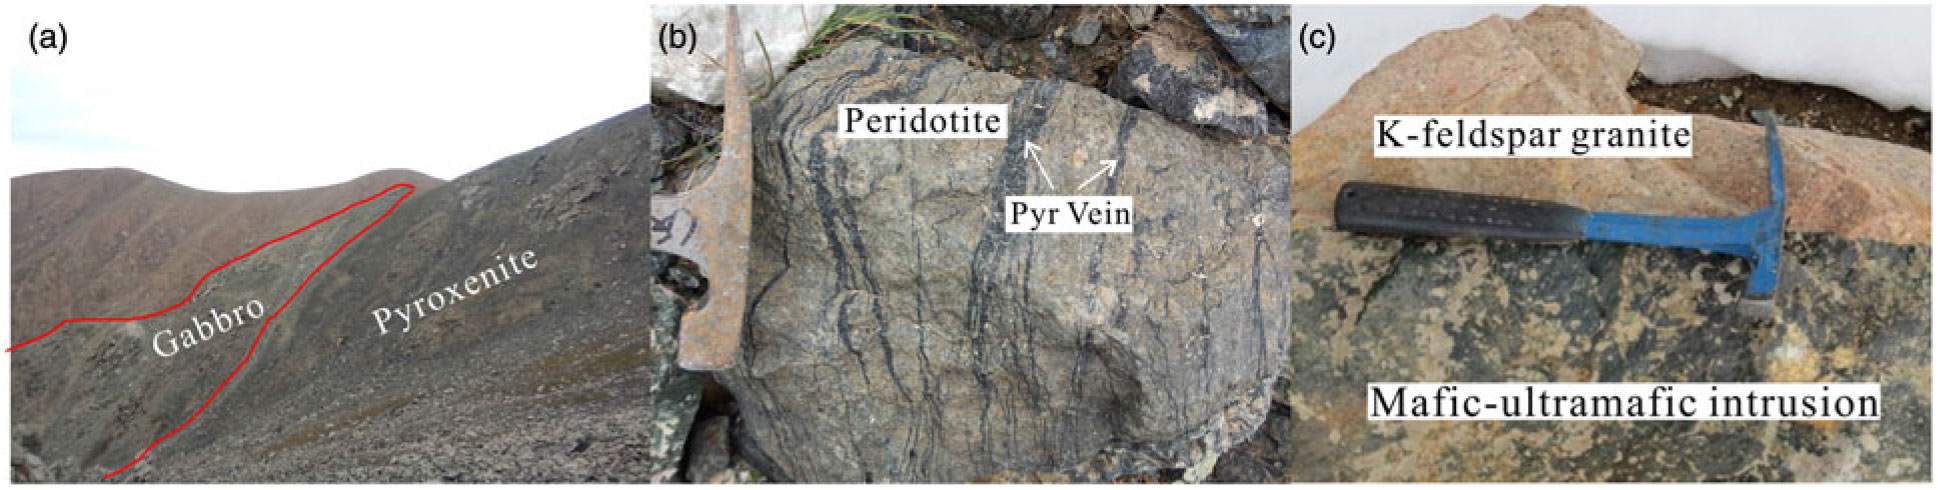
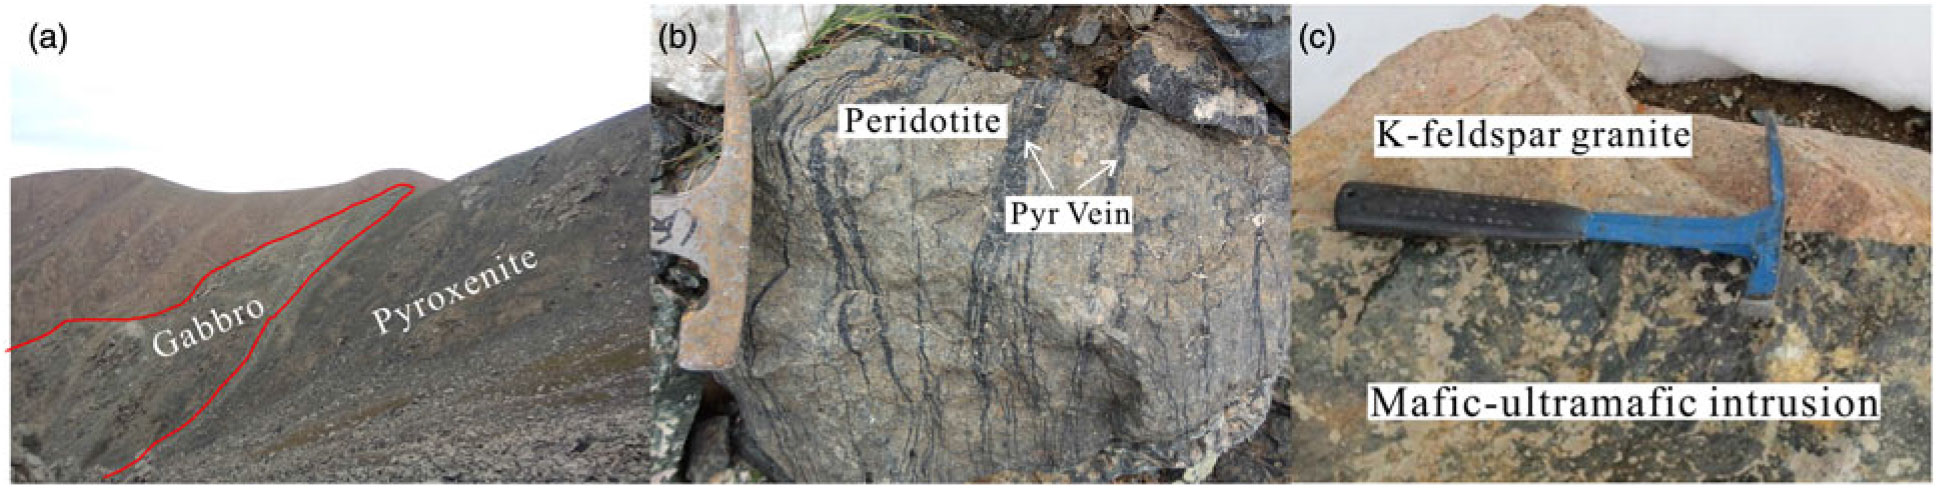
A geological map of the Hudesheng mafic–ultramafic intrusive body is provided in Figure 2. The intrusion consists of an irregular ultramafic core, a smaller olivine–pyroxenite body and a large marginal gabbroic main body. The contact between the ultramafic core and the adjoining gabbroic rocks is steep, sharp and fractured, suggesting a solid- or semi-solid-state intrusive relationship (Figs. 2 and 3a). Peridotites intrusive body outcrop is cut by clinopyroxene-rich veins (Fig. 3b). The areal distribution of ultramafic rocks, pyroxenite and gabbro, and the attitudes of the igneous layering, seemingly indicate distorted and irregular concentric zoning of the Hudesheng mafic–ultramafic intrusive body. The Hudesheng Deep Fracture is the main fault in the study area. It strikes WNW–ESE across the whole area, and controls three subsidiary faults (Fig. 2). The rocks in the fracture zone experience kaolinization, chloritization, malachitization, silicification and ferritization. The Hudesheng intrusions are distributed around the Hudesheng Deep Fracture.
Detailed geological map of Hudesheng mafic–ultramafic intrusions district; 1 – Quaternary; 2 – JinshuiKou Group; 3 – K-feldspar granite; 4 – fine-grained gabbro; 5 – coarse-grained gabbro; 6 – pyroxenite; 7 – peridotite; 8 – fault; 9 – sample location.

Gabbroic rock has intruded schist and gneiss of the Jinshuikou Group along the northern boundary of the Hudesheng intrusive body with a backed contact (Fig. 2). K-feldspar granite intrudes the gabbroic rock at the northwestern boundary of the intrusive body with a straight contact bound, and yields an age of 413 ± 2.8 Ma (our unpublished U–Pb data; Fig. 3c). All these features suggest that the Hudesheng intrusion was emplaced into the Jinshuikou and Dakendaban groups, and is therefore younger than the Jinshuikou Group. The features of the contact zone between the moyite and the mafic–ultramafic intrusive body, in addition to the results of our geochronology study, indicate that the moyite is younger than the intrusive body.
Field photographs of Hudesheng mafic–ultramafic rocks. (a) The contact relationship between gabbro and pyroxenite. (b) Peridotites cut by clinopyroxene-rich vein. (c) Gabbroic rocks cut by K-feldspar granite.
3.b. Petrography
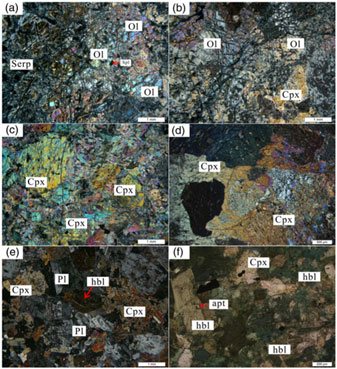
Samples of the mafic–ultramafic rocks were collected mainly from the intrusive complex mapped in Figure 2. These samples include dunites, olivine clinopyroxenites, clinopyroxenites and gabbro. Representative photographs are shown in Figure 4.
Microphotographs of the Hudesheng mafic–ultramafic intrusive rocks. All photos were taken under crossed-polarized light. (a) The anhedral clinopyroxene and spinel are interstitial to olivine in cumulate dunites; (b) olivine crystals in the olivine pyroxenite; (c, d) altered pyroxenite; (e) typical gabbroic textures in the gabbros; (f) apatite in the hornblendite. Abbreviations: Ol = olivine; Cpx = clinopyroxene; Pl = plagioclase; Hbl = horblende; apt = apatite; Spl = spinel.

Dunite:
The green-black dunite has a cumulate texture and is composed of olivine (85–95% in volume), clinopyroxene and amphibole, without orthopyroxene. The anhedral clinopyroxenes are interstitial to olivine (Fig. 4a). The dunites have been partly serpentinized, with some olivine being altered to serpentine, iddingsite and chlorite (Fig. 4a). Part of the olivine is characterized by fissility on the surface. Very small grains of spinel occur interstitially to olivine. Minor magnetites are observed as interstitial grains.
Olivine pyroxenite:
The dark-grey olivine pyroxenite is composed of clinopyroxene (50%–55%), olivine (20–25%), amphibole, biotite (∼5%), metal sulfide (∼3%) and trace plagioclase, and shows euhedral to subhedral granular and cumulate textures. The olivine and clinopyroxene are of variable size (0.2–2.7 and 0.6–4.4 mm, respectively; Fig. 4b). A thin rim of amphibole commonly develops at the contact between olivine and clinopyroxene; this feature is similar to the corona structure usually described from Alaskan-type complexes (e.g. Helmy et al. Reference Helmy, Yoshikawa, Shibata, Arai and Tamura2008).
Pyroxenite:
The grey-brown pyroxenite is composed of clinopyroxene (>90%), olivine, plagioclase, amphibole and minor orthopyroxene (∼10%), showing an adcumulate texture. Clinopyroxenes are partly altered to chlorite and tremolite (Fig. 4c, d).
Gabbro:
The grey gabbro is composed of clinopyroxene (35–40%), plagioclase (40%–50%), orthopyroxene (∼5%), amphibole, biotite and minor apatite (5–8%), showing fine- to medium-grained euhedral granular and gabbroic textures. Plagioclase is characterized by multiple twins and a euhedral tabular crystal form with crystal sizes of 1.2–3.0 mm. Clinopyroxene is altered to chlorite and actinolite, and plagioclase is altered to talc and sericite (Fig. 4e).
In addition, a small hornblendite body occurs at the margin of the gabbro (too small to be shown in Fig. 2). The hornblendite comprises amphibole (>90%) with accessory plagioclase, magnetite and apatite (Fig. 4f).
4. Sampling and analytical methods
4.a. Electron-probe microanalysis
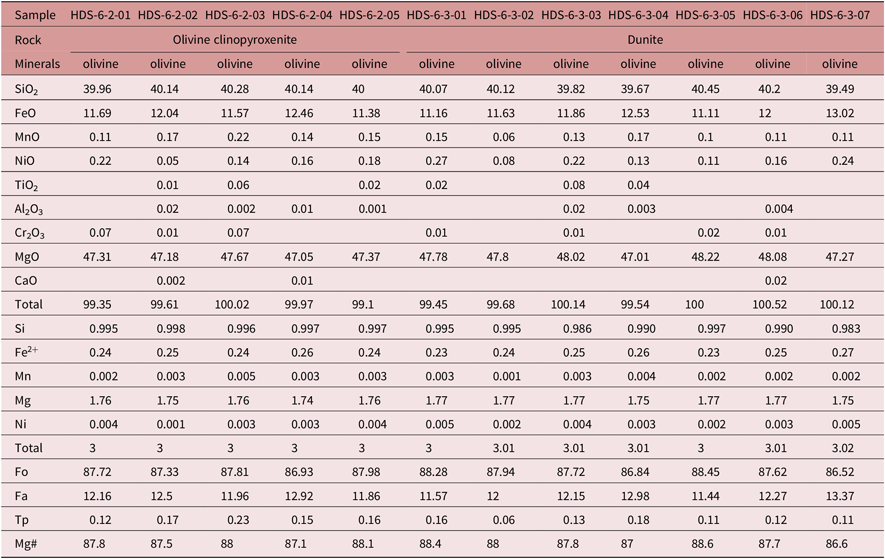
Carbon-coated polished sections were analysed on a JEOL JXA8230 electron probe microanalyser at the MLR Key Laboratory of Metallogeny and Mineral Assessment, Institute of Mineral Resources, Chinese Academy of Geological Sciences. The measurement conditions were accerating voltage of 20 kV and a probe current of 20 nA and 5 um diameter beam size. Counting time was set to 10 s on the peak and 5 s at the background, and all electron-probe microanalysis (EPMA) results are given in Tables 1–3.
EPMA data (wt%) of olivines from mafic–ultramafic complex at Hudesheng

The blank cells indicate elements not analysed; Mg# = 100*Mg/(Mg + Fe)
4.b. Zircon U–Pb dating
Zircons were separated from whole-rock samples using the conventional heavy liquid and magnetic techniques, and then by handpicking under a binocular microscope, at the Langfang Regional Geological Survey, Hebei Province, China. The handpicked zircons were examined under transmitted and reflected light with an optical microscope. To reveal their internal structures, cathodoluminescence (CL) images were obtained using a JEOL scanning electron microscope.
The zircon U–Pb isotope analysis was undertaken at the MLR Key Laboratory of Metallogeny and Mineral Assessment, Institute of Mineral Resources, Chinese Academy of Geosciences, Beijing, China, using a Finnigan Neptune Excel inductively coupled plasma mass spectrometer (ICP-MS) equipped with New Wave UP 213 laser ablation system. A spot diameter of 30 μm was used for the analysis and the ablation rate was 10 Hz. Calibrations for the zircon analyses were carried out using NIST 610 glass as an external standard and Si as internal standard. U–Pb isotope fractionation effects were corrected using zircon 91500 as external standard. Zircon standard GJ-1 is also used as a secondary standard to supervise the deviation of age measurement/calculation. Fifteen analyses of the GJ-1 give a weighted mean 206Pb/238U age of 607.2 ± 0.8 Ma (MSWD = 0.8, n = 15), which agrees well with the recommended 206Pb/238U age of 608.5 ± 0.4 Ma (Jackson et al. Reference Jackson, Pearson, Griffin and Belousova2004) within analytical errors. The analytical procedures are described by Hou et al. (Reference Hou, Li and Tian2009). The data were processed using Isoplot (Ludwig, Reference Ludwig2003; Liu et al. Reference Liu, Gao, Hu, Gao, Zong and Wang2010a).
4.c. Whole-rock geochemistry determination
For geochemical analysis, whole-rock samples, after the removal of altered surfaces, were crushed in an agate mill to ∼200 mesh. X-ray fluorescence (XRF; PW1401/10) using fused-glass discs and ICP-MS (Agilent 7500a with a shield torch) were used to measure the major- and trace-element compositions, respectively, at the Testing Center of Jilin University, after acid digestion of samples in Teflon bombs. The analytical results for the BHVO-1 (basalt), BCR-2 (basalt) and AGV-1 (andesite) standards indicate that the analytical precision for major elements is better than 5%, and for trace elements, generally better than 5% when the content is >10 ppm, and better than 10% when <10ppm.
4.d. Lu–Hf isotope analysis
In situ zircon Hf isotopic analyses were carried out using a Neptune multi-collector ICP-MS equipped with 193 nm laser at the Institute of Geology and Geophysics, Chinese Academy of Sciences, Beijing, China. Hf isotopic analyses were performed using a spot size of 63 μm, a laser repetition rate of 10 Hz and a beam density of 10 J cm−2. For details of the analytical procedures, see Wu et al. (Reference Wu, Yang, Xie, Yang and Xu2006). Raw count rates for 172Yb, 173Yb, 175Lu, 176(Hf + Yb + Lu), 177Hf, 178Hf, 179Hf, 180Hf and 182W were collected, and isobaric interference corrections for 176Lu and 176Yb on 176Hf were determined precisely. 176Lu was calibrated using the 175Lu value, and a correction was made to 176Hf. The 176Yb/172Yb value of 0.5886 and the mean 176Yb value obtained during Hf analysis on the same spot were applied to obtain an interference correction of 176Yb on 176Hf. The measured 176Hf/177Hf ratio of standard zircon 91500 of 0.282295 ± 0.000025 is within error of the commonly accepted value of 0.282284 ± 0.000022 determined using the solution method (Griffin et al. Reference Griffin, Pearson, Belousova and Saeed2006). The measured 176Hf/177Hf and 176Lu/177Hf ratios were used to calculate the initial 176Hf/177Hf ratios, taking the decay constant for 176Lu as 1.865 × 10⁻¹¹ year (Scherer et al. Reference Scherer, Munker and Mezger2001). The present-day chondritic ratios of 176Hf/177Hf = 0.282785 ± 11 and 176Lu/177Hf = 0.0336 ± 1 (Bouvier et al. Reference Bouvier, Vervoort and Patchett2008) were adopted to calculate ɛHf(t) values, and the solution method (Nowell et al. Reference Nowell, Kempton, Noble, Fitton, Saunders, Mahoney and Taylor1998; Amelin et al. Reference Amelin, Lee and Halliday2000) was used to calculate Hf model ages.
4.e. S–Se element analysis
Five samples of pyroxenite from the Hudesheng mafic–ultramafic complex were analysed for S and Se. Sulfur was determined by infrared spectrometry carbon–sulphur analyser (HORIBA EMIA-220 V) according to the method of Bédard et al. (Reference Bédard, Savard and Barnes2008). Selenium was determined by Instrumental Neutron Activation Analysis (INAA) after irradiation for 90 min (neutron flux of 4.63 to 5.58 × 10¹¹ n cm−2 s−1) in the SLOWPOKE reactor at Jilin Institute of Geological Sciences, using the method of Bédard and Barnes (Reference Bédard and Barnes2002).
5. Analytical results
5.a. EPMA results
Olivine
Olivines from the dunite have high Mg# values (86.6–88.6) and low CaO contents (<0.02 wt%). Similarly, olivines from the olivine clinopyroxenite have Mg# values of 87.1–88.1 and CaO contents of <0.01 wt% (Table 1). These high Mg# values and very low contents of MnO (0.06–0.22 wt%) and CaO (<0.01 wt%) are typical of olivines from Alaskan-type intrusions (Irvine, Reference Irvine1974; Snoke et al. Reference Snoke, Quike and Bowman1981). The contents of NiO are <0.4 wt% (0.05–0.27 wt%), lower than those of olivine from mantle peridotite (e.g. Sato, Reference Sato1977).
Clinopyroxene
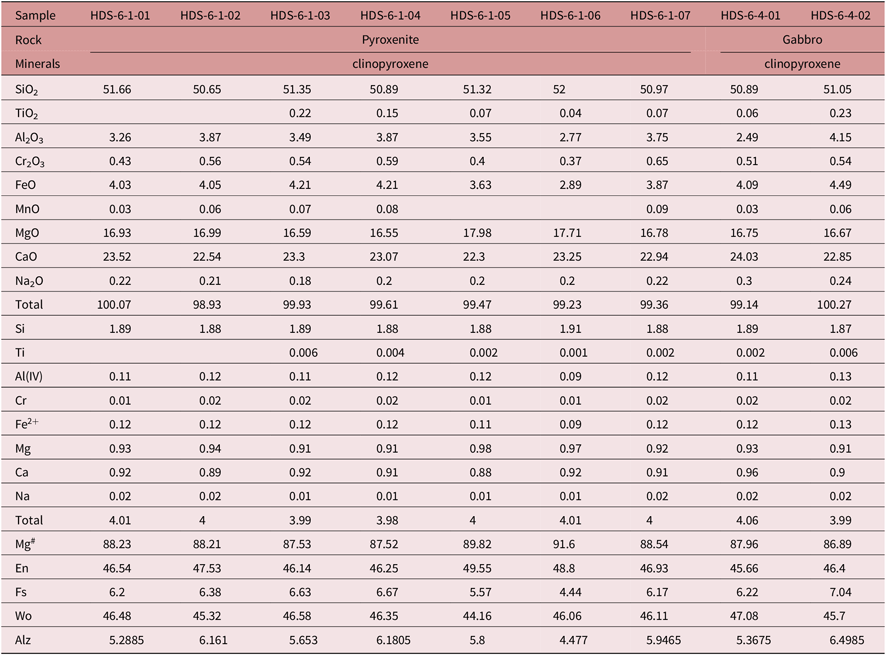
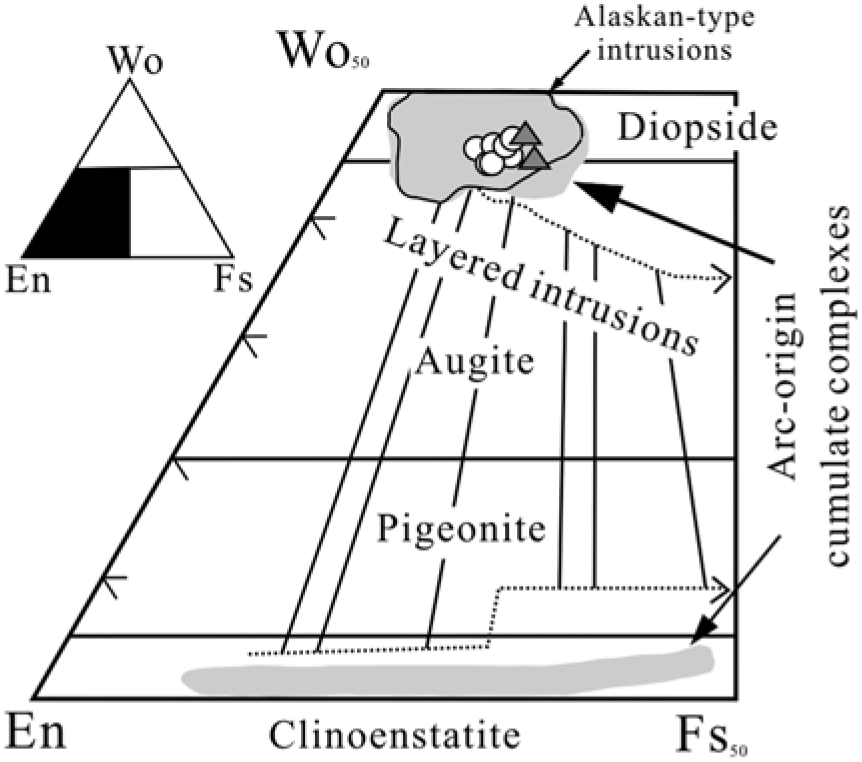
Clinopyroxenes are also abundant in the pyroxenite and gabbro. They are Ca-rich and diopside in composition, with Mg# values of 86.89–91.60 (Mg# values are higher in the pyroxenite than in the gabbro; Table 2). They are also characterized by low Al2O3, TiO2 and Na2O contents (Table 2), with compositions ranging from Wo44.16 to Wo47.08, and fall within the field of Alaskan-type intrusions in a triangular diagram (Table 2; Fig. 5). The high CaO content is typical of clinopyroxenes from Alaskan-type intrusions (Snoke et al. Reference Snoke, Quike and Bowman1981; Helmy and El Mahallawi, Reference Helmy and El Mahallawi2003), in contrast to those from alkaline mafic rocks that are characterized by high TiO2 and Al2O3 contents (Le Bas, Reference Le Bas1962).
EPMA data (wt%) of clinopyroxene from mafic–ultramafic complex at Hudesheng

The blank cells indicate elements not analysed.
Wo–En–Fs diagram showing the compositions of the clinopyroxene from Hudesheng intrusion. The grey fields of Alaskan-type intrusions and arc-origin intrusions are modified from Su et al. (Reference Su, Qin, Santosh, Sun and Tang2013), Himmelberg and Loney (Reference Himmelberg and Loney1995), Spandler et al. (Reference Spandler, Arculus, Eggins, Mavrogenes, Price and Reay2003) and Irvine (Reference Irvine1974).

Amphibole
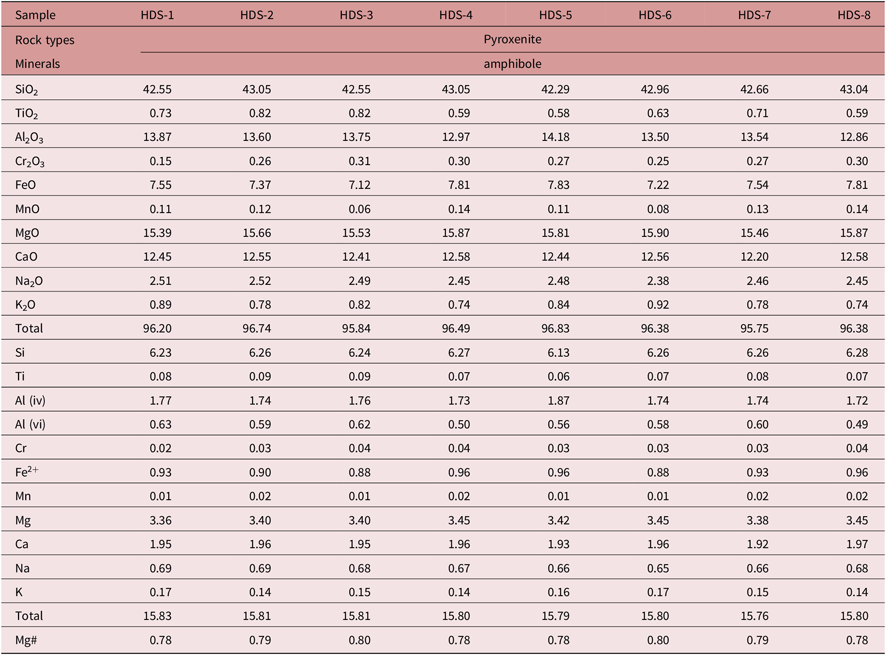
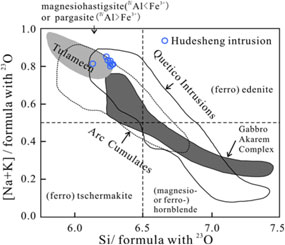
Mineral compositions of representative primary amphiboles are presented in Table 3. The amphibole in the analysed cumulate rocks is mainly pargasitic hornblende and pargasite. These amphiboles are similar in composition to those in Alaskan-type ultramafic–mafic rocks from Bear Mountain (Snoke et al. Reference Snoke, Quike and Bowman1981), Abu Hamamid intrusive complexes (Farahat and Helmy, Reference Farahat and Helmy2006), the Quetico intrusions (Pettigrew and Hattori, Reference Pettigrew and Hattori2006) and the Karayasmak ultramafic–mafic association (Eyuboglu et al. Reference Eyuboglu, Dilek, Bozkurt, Bektas, Rojay and Sen2010). Furthermore, the low alkali- and high Mg numbers (Mg/(Mg + Fe) atomic ratio; range from 78 to 80; Table 3) are similar to those of hornblendes from mafic rocks of typical Alaskan-type complex (e.g. Helmy and El Mahallawi, Reference Helmy and El Mahallawi2003). On the Si (formula with 23O) vs (Na + K) (formula with 23O) diagram, all the samples plot in the area of Alaskan-type intrusions with significant arc affinities (Fig. 6).
EPMA data (wt%) of amphiboles from mafic–ultramafic complex at Hudesheng

Mg# = Mg/(Mg+Fe) atomic ratio.
(Na + K) vs Si in hornblende after Pettigrew and Hattori (Reference Pettigrew and Hattori2006). Arc amphibole field is defined by Beard and Barker (Reference Beard and Barker1989). Data for the Quetico intrusions by Pettigrew and Hattori (Reference Pettigrew and Hattori2006); the Tulameen Complex by VJ Rublee (unpub. M.Sc. thesis, Univ. Ottawa, 1994); and the gabbro Akarem Complex by Helmy and El Mahallawi (Reference Helmy and El Mahallawi2003). Compositional fields are after Leake et al. (Reference Leake, Wooley, Arps, Birch, Gilbert, Grice, Hawthorne, Kato, Kisch, Krivovichev, Linthout, Laird, Mandarino, Maresch, Nickel, Rock, Schumacher, Smith, Stephenson, Ungaretti, Whittaker and Youzhi1997).

5.b. Zircon U–Pb ages
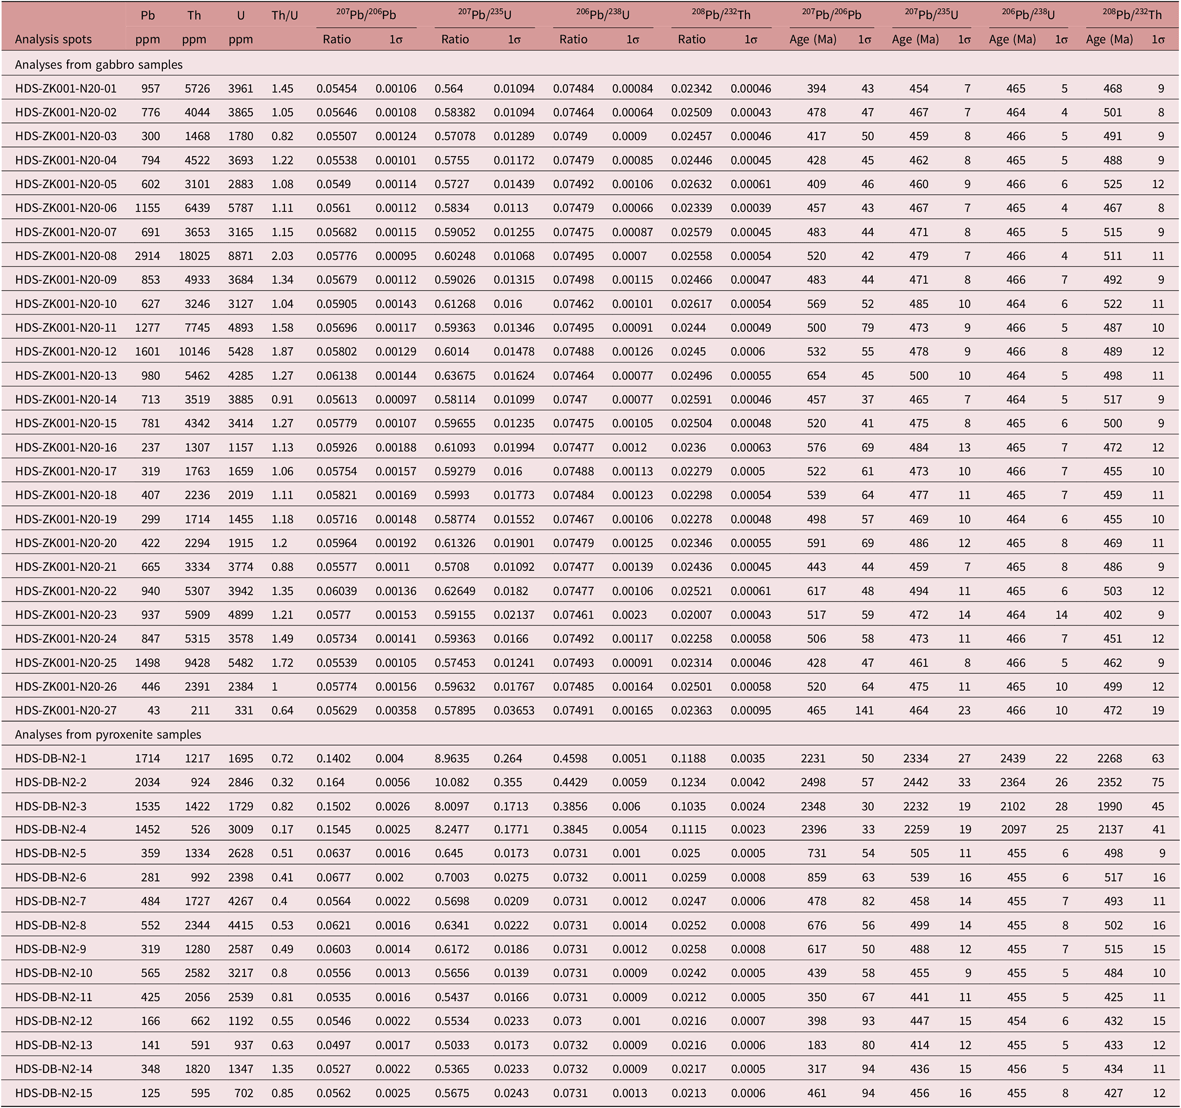
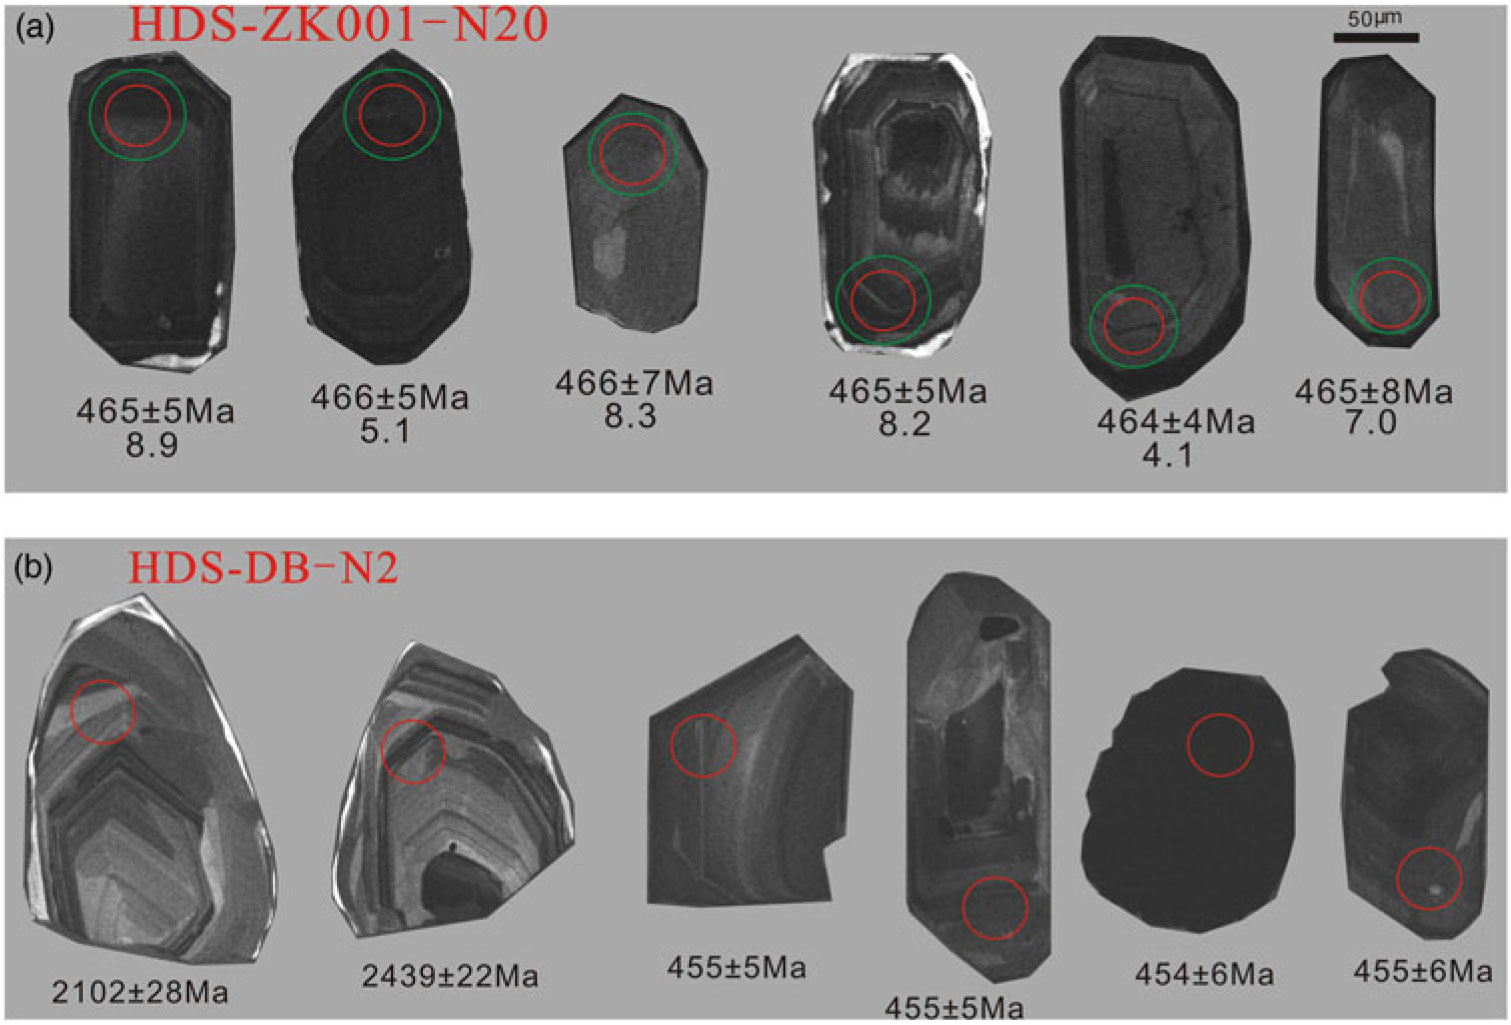
Cathodoluminescence (CL) images of representative zircons are presented in Figure 7. The U–Pb data are listed in Table 4 and concordia diagrams are provided in Figures 8 and 9.
Zircon U-Pb isotopic dating of gabbro and pyroxenite samples from mafic-ultramafic complex at Hudesheng

Cathodoluminescence (CL) images of zircons selected for analysis from gabbros (a) and pyroxenite (b) in the area. The numbers on these images indicate individual analysis spots, and the values below the images show zircon ages and ɛ Hf(t) values. The diameter of the red and green circles in all CL images is 32 μm and 63 μm, respectively.

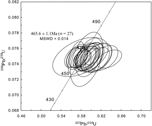
Zircon LA-ICP-MS U–Pb concordia diagrams for gabbros from the Hudesheng area. The weighted mean age and MSWD are shown.

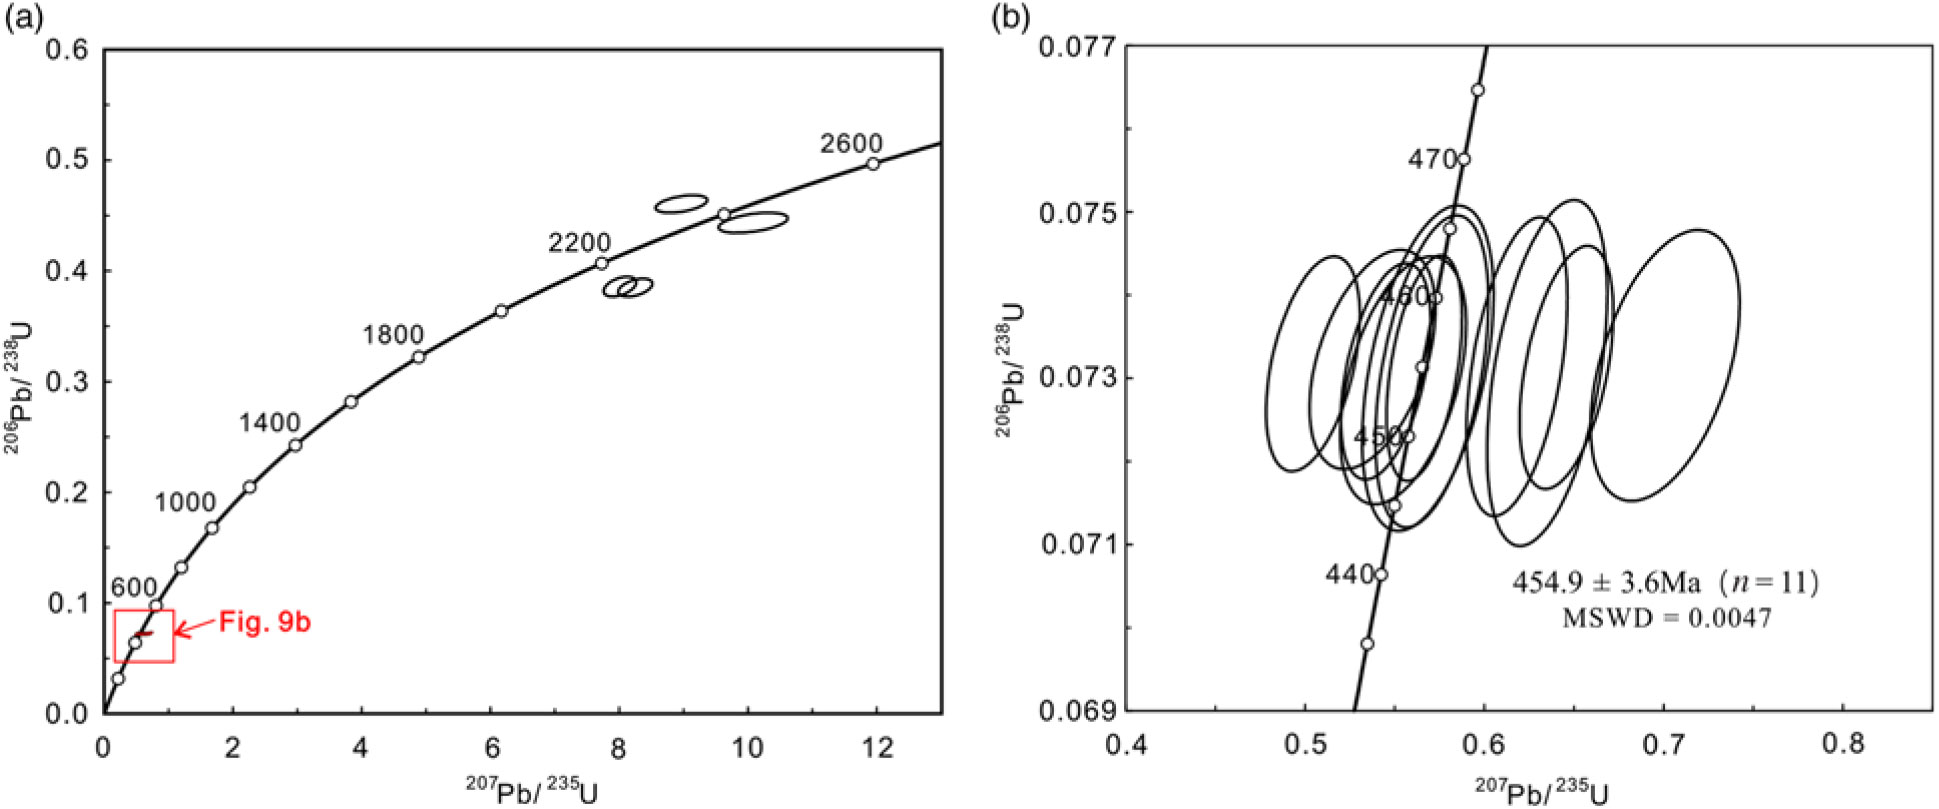
Zircon LA-ICP-MS U–Pb concordia diagrams for pyroxenites from the Hudesheng area. The weighted mean age and MSWD are shown.

The zircons from the gabbro (sample HDS-ZK001-N20) are grey, mostly stubby and columnar in shape, 50–120 μm long, 30–80 μm wide and with length:width ratios of 1:1–2:1. Few zircon rims show a clear stripped texture in CL images (Fig. 7a). Zircon cores are texturally homogeneous without obvious oscillatory zoning, inherited cores and core–rim structure. These features are characteristic of crystallization from mafic magma (Fig. 7a; Belousova et al. Reference Belousova, Griffin, O’Reilly and Fisher2002; Hoskin and Schaltegger, Reference Hoskin and Schaltegger2003). Twenty-seven grains were analysed during a single analytical session (Table 4). The zircon grains have Th/U values of 0.64–2.03 (mean of 1.23) and 206Pb/238U ages of 464–466 Ma. All analyses plot on, or close to, the U–Pb concordia line, and the concordia age obtained from the 206Pb/238U analytical data is 465.6 ± 1.1 Ma (MSWD = 0.014, n = 27; Fig. 8), which represents the crystallization age of the Hudesheng mafic gabbro intrusion (i.e. Middle Ordovician).
The zircons from the pyroxenite (sample HDS-DB-N2) are mostly wide, stubby and columnar in shape (with a few long, columnar and euhedral grains), subhedral to anhedral, 40–80 μm long (with the exception of a few grains 180 μm in length), 20–60 μm wide and with length:width ratios of 1:1–3:1. The zircons show two kinds of features in the CL images, as follows. The first group displays bright CL, fine-scale oscillatory zoning, striped absorption horizons and homogeneous CL of zircon core. The second group is characterized by grey colour in CL, very weak oscillatory zoning and a lack of core–rim structure, which are characteristic of crystallization from mafic magma (Fig. 7b). The zircon grains yield Th/U values of 0.17–1.35 (mean of 0.63), and have characteristics indicative of a magmatic origin (Belousova et al., Reference Belousova, Griffin, O’Reilly and Fisher2002; Corfu et al. Reference Corfu, Hanchar, Hoskin, Kinny, Hanchar and PWO2003). Results from 15 analytical spots yield 206Pb/238U ages of 454–456 Ma (Fig. 9a; with the exception of four zircons from ‘Group 1’ with older ages of 2097, 2102, 2364 and 2439 Ma). Data from the 11 ‘young’ zircons (named ‘Group 2’) plot on, or close to, the U–Pb concordia line and yield a concordia age of 454.9 ± 3.6 Ma (MSWD = 0.0047, n = 11; Fig. 9b). Group 1 zircons are characterized by oscillatory zoning under CL, and their ages are close to those of the plagioclase amphibolites (2366 ± 10 Ma) and monzogranite gneiss (2412 ± 14 Ma) of the Delingha Complex, which is the wall-rock of the Hudesheng intrusion (Lu and Wang, Reference Lu and Wang2002; Xin et al. Reference Xin, Wang and Zhou2006). The four older ages are therefore interpreted as representing the age of xenocrystic zircons from the Delingha Complex, while the youngest age group is interpreted as the age of pyroxenite crystallization (i.e. Late Ordovician).
5.c. Whole-rock geochemistry
5.c.1. Major elements
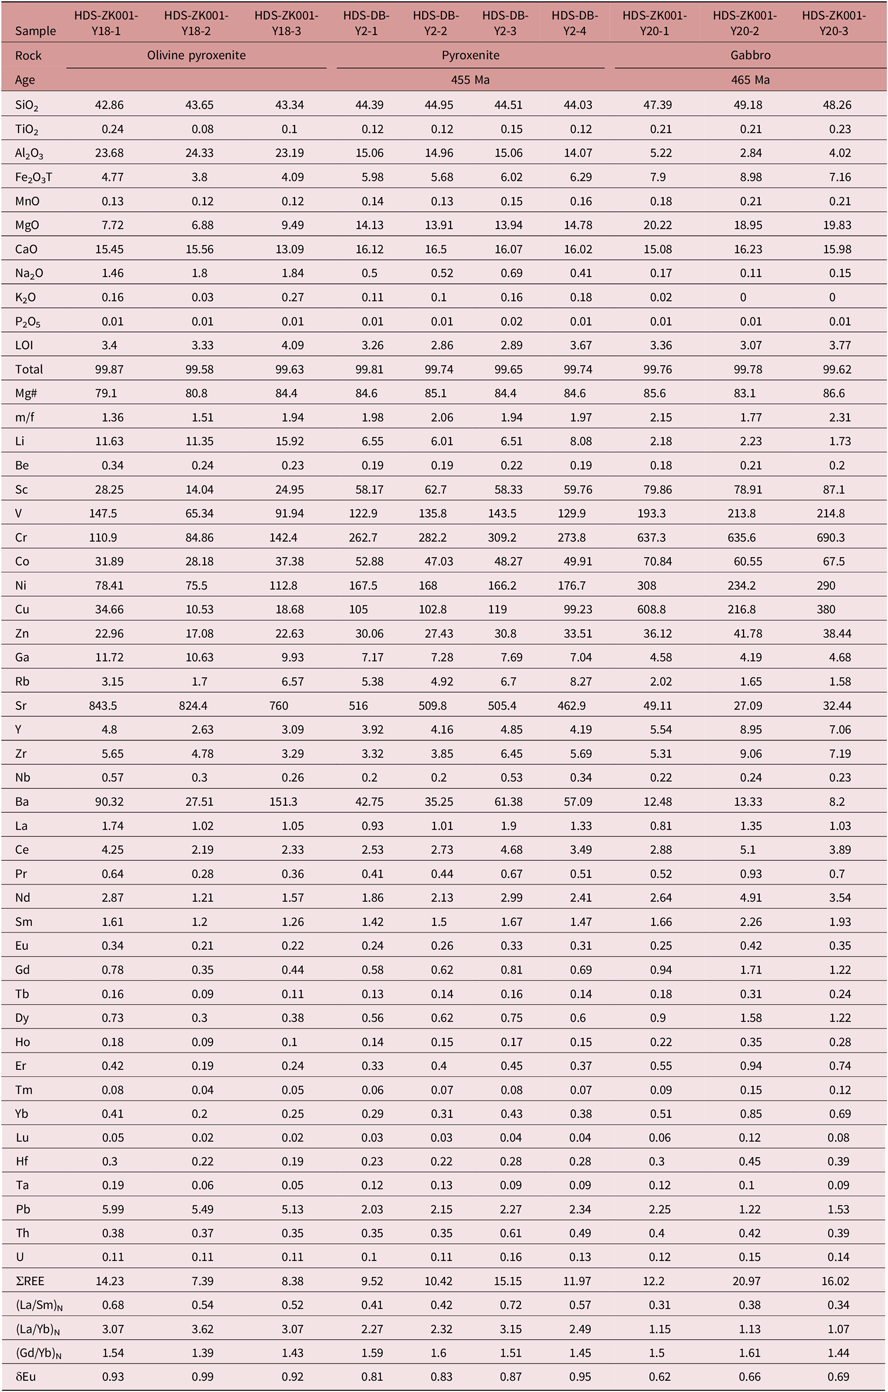
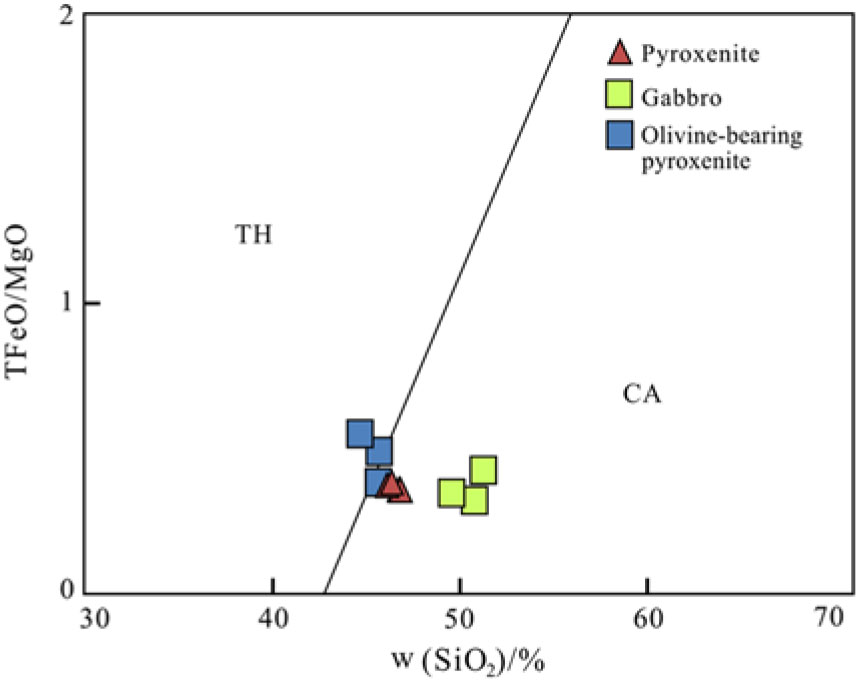
The studied rocks from the Hudesheng mafic–ultramafic intrusions comprise a suite of olivine pyroxenites, pyroxenites and gabbros. The results of whole-rock major- and trace-element analyses for this suite of rocks are listed in Table 5. The major-element geochemistry of these samples is as follows: SiO2 = 44.43–50.85 wt%, TiO2 = 0.08–0.25 wt%, Al2O3 = 2.94–25.27 wt%, total Fe2O3 = 3.95–9.28 wt%, MgO = 7.15–20.98 wt%, CaO = 13.7–17.03 wt%, Na2O + K2O = 0.12–2.20 wt% and P2O5 = <0.02 wt%. The samples have Mg# = 79.1–86.6 and m/f (Mg2+/(TFe2+ + Mn2+); Wu, Reference Wu1963) of 1.36–2.15. The three rock types are therefore rich in MgO and depleted in SiO2, TiO2 and the alkali elements. The pyroxenite and gabbro samples fall in the calc-alkaline field, and the olivine pyroxenite samples fall between the tholeiitic and calc-alkaline fields on the SiO2–TFe/MgO diagram (Fig. 10).
Major (wt%) and trace (ppm) elements for the mafic–ultramafic complex at Hudesheng

Mg# = 100 × [Mg2+/(Mg2+ + TFe2+)]; m/f = Mg2+/(TFe2+ + Mn2+).
SiO2 vs TFeO/MgO diagram of the Hudesheng mafic–ultramafic rocks. (Th = tholeiitic series; CA = calc-alkali series.)

5.c.2. Trace elements
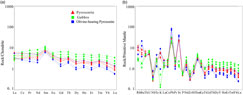
In a chondrite-normalized REE diagram (Fig. 11a; Boynton, Reference Boynton and Henderson1984), the olivine pyroxenites, pyroxenites and gabbros show similar nearly flat REE patterns, and total REE contents show a slight increase from the olivine pyroxenites to the gabbros. These REE patterns indicate that these rocks share a common source. The total REE contents (ΣREE) are 7.39–20.97, with (La/Yb)N = 1.07–3.62, (La/Sm)N = 0.31–0.72, (Gd/Yb)N = 1.39–1.61 and Eu anomalies (Eu/Eu*) = 0.62–0.99.
Chondrite-normalized REE patterns (a) and primitive mantle (PM) normalized trace element (b) diagrams for the Hudesheng mafic–ultramafic intrusions. The values of chondrite and PM are from Boynton (Reference Boynton and Henderson1984) and Sun and McDonough (Reference Sun, McDonough, AD and Norry1989), respectively.

The primitive-mantle-normalized trace-element diagrams (Sun and McDonough, Reference Sun, McDonough, AD and Norry1989) of most of the olivine pyroxenite, pyroxenite and gabbro samples show similar patterns, although there are notable differences in the concentrations of some elements (e.g. Ba, K, Sr; Fig. 11b). All samples are enriched in LILEs (e.g. Rb, Th, U, Pb and Sr; excluding the gabbro samples) and are depleted in HFSEs (e.g. Nb, Zr, Hf, P and Ti).
5.d. Zircon Hf isotopic compositions
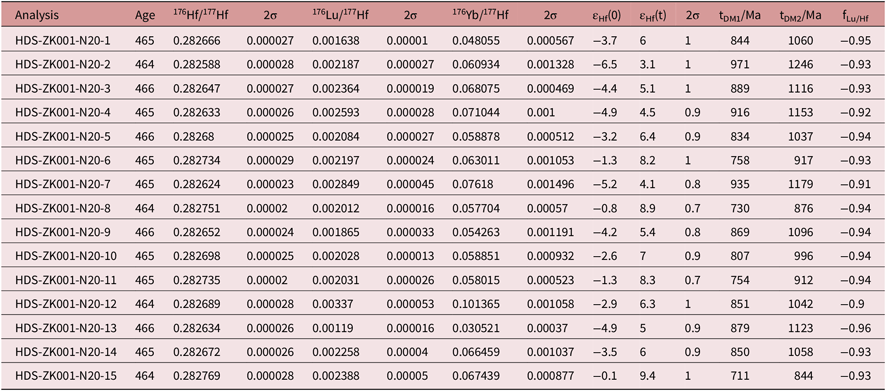
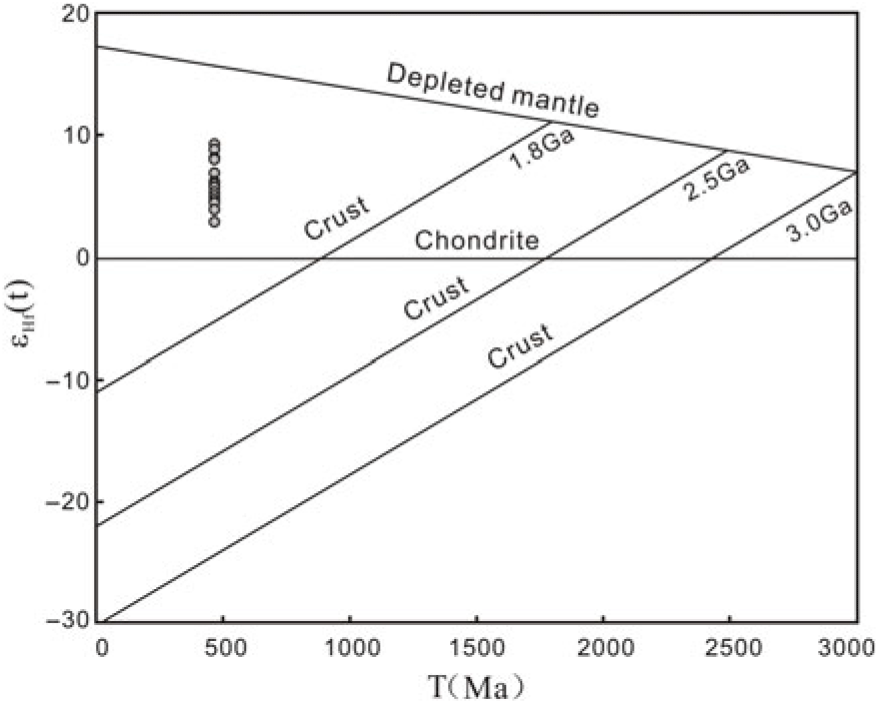
The results of zircon Hf isotopic analyses are given in Table 6 and shown in Figure 12. Fifteen analytical spots were analysed on magmatic zircon grains with Middle Ordovician ages (465 Ma) from gabbro samples. The analysed zircons yield 176Yb/177Hf ratios of 0.030521–0.101365, 176Lu/177Hf ratios of 0.00119–0.00337 and initial 176Hf/177Hf ratios of 0.282588–0.282769. Their corresponding ɛ Hf(t) and zircon Hf model ages (T DM1) values vary from +3.1 to +9.4 (with a weighted mean of 6.2) and 711 to 971 Ma (with a mean of 840 Ma), respectively.
Zircon Lu-Hf isotopic compositions of zircons from gabbro of the Hudesheng intrusions

ɛ Hf(t) vs T diagram of Hudesheng mafic–ultramafic intrusions.

The gabbro samples have positive ɛ Hf(t) values and T DM1 ages that are older than their crystallization ages (465 Ma). Hf isotopic data from the gabbro samples plot between the Hf isotopic evolution lines of chondrite and depleted mantle, although closer to the latter (Fig. 12).
5.e. Bulk rock S/Se ratios
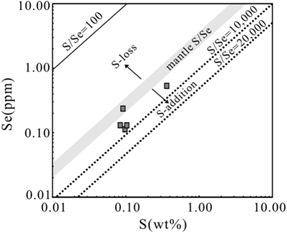
Whole-rock S and Se data are listed in Table 7. The Se and S contents vary from 0.130 to 0.533 ppm and 0.084 to 0.36 wt%, respectively. The samples show a wide range of S/Se ratios (3871–8642).
Whole-rock S and Se data of the Hudesheng mafic–ultramafic intrusions

6. Discussion
6.a. Magma source
As we know, the Mg–Fe partitioning between olivine and liquid (Fe/Mgol–Liq KD = 0.3 ± 0.003; Roeder and Emslie, Reference Roeder and Emslie1970) can indicate the composition of the primitive parental magma. Based on this computational formula, the composition of the most Mg-rich olivine is Fo88.45 and the Mg# value of the liquid is 69.97. The Fo88.45 and high Mg# implies the parent magma is picritic in composition, which is similar to the parental magma of typical Alaskan-type intrusions (Irvine, Reference Irvine1974; Tistl et al. Reference Tistl, Burgath, Hohndorf, Kreuzer, Munoz and Salinas1994; Mues-Schumacher et al. Reference Mues-Schumacher, Keller, Kononova and Suddaby1996). The parental magma of the Hudesheng intrusion is therefore thought to have differentiated from picritic basaltic magma. Through field observation and petrological study, we identified hornblendite containing amphibole and biotite (Fig. 4e, f). Furthermore, the widespread occurrence of amphiboles and biotite in the various rock units and the development of corona structure, which is the result of reactions influenced by late-magmatic fluids (e.g. Helmy et al. Reference Helmy, Yoshikawa, Shibata, Arai and Tamura2008), suggest a hydrous nature of the parent melt. These features indicate that the parental magma was hydrous or influenced by fluid metasomatism, which is similar to the parental magma of most Alaskan-type intrusions (Helmy and El Mahallawi, Reference Helmy and El Mahallawi2003).
The Hf isotopic compositions of zircons from the gabbro samples all have positive ɛ Hf(t) values (+3.1 to +9.4) and 176Hf/177Hf = 0.282588–0.282769, indicating that these rocks were derived from a depleted mantle source. If the parental magma of the zircons came directly from unmodified depleted mantle, the zircon crystallization ages should be roughly the same as the zircon Hf model ages (Wu et al. Reference Wu, Li, Yang and Zheng2007). However, the Hf model ages (T DM1 = 711–971 Ma; mean of 840 Ma) are much older than their crystallization ages (465 Ma). This indicates that the source of the magma was enriched mantle or was influenced by crustal contamination (Wu et al. Reference Wu, Li, Yang and Zheng2007).
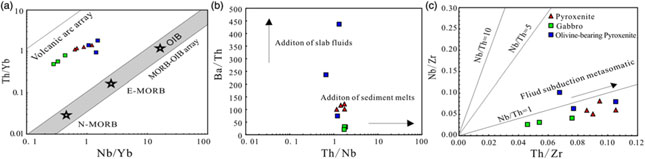
The chondrite-normalized REE diagrams and primitive-mantle-normalized trace-element diagrams (Fig. 11a, b) for the olivine pyroxenites, pyroxenites and gabbros show similar patterns and differ for just a few specific elements (e.g. Ba, K, Sr), indicating that they share a common magma source. The samples of olivine pyroxenites, pyroxenites and gabbros show strong LILE enrichment (e.g. Rb, Th, U, Pb) and HFSE depletion (e.g. Nb, Zr, Hf, P, Ti), which are typical characteristics of arc magma. The strong negative Nb and Zr anomalies, together with the Pb enrichment, suggest that the parent magma was modified by a subduction component (Pearce and Peate, Reference Pearce and Peate1995; Stolz et al. Reference Stolz, Jochum and Spettel1996; Jiao et al. Reference Jiao, Tang and Yan2002). The HFSEs provide valuable clues to the characteristics of the mantle source. On a Nb/Yb vs Th/Yb diagram (Fig. 13a) the samples plot near the volcanic arc array, and they diverge from the mid-ocean-ridge – ocean-island-basalt (MORB–OIB) evolution line, suggesting the influence of subduction components (Pearce and Peate, Reference Pearce and Peate1995). Trace-element ratios (Ba/Th, Th/Nb, Ba/La, Th/Yb, Nb/Zr and Th/Zr) enable the identification of hydrous fluid, subduction zone sediment components or fluid metasomatism during subduction. The samples are characterized by Th/Nb of 0.66–1.84 and Th/Yb of 0.49–1.82. On a Th/Nb vs Ba/Th diagram (Fig. 13b) the samples plot towards the trend of hydrous fluid, and on a Th/Zr vs Nb/Zr diagram (Fig. 13c) they plot towards the trend of fluid metasomatism.
Nb/Yb vs Th/Yb (a), Th/Nb vs Ba/Th (b) and Th/Zr vs Nb/Zr (c) diagrams of Hudesheng mafic–ultramafic intrusions (a) after Pearce (Reference Pearce2008), (b) after Hanyu et al. (Reference Hanyu, Tatsumi, Nakai, Chang, Miyazaki and Sato2006) and (c) after Woodhead et al. (Reference Woodhead, Hergt, Davidson and Eggins2001).

In conclusion, we consider that the magma was derived from a depleted mantle source that had undergone fluid metasomatism, and was hydrous picritic basalt in composition.
6.b. Crustal contamination
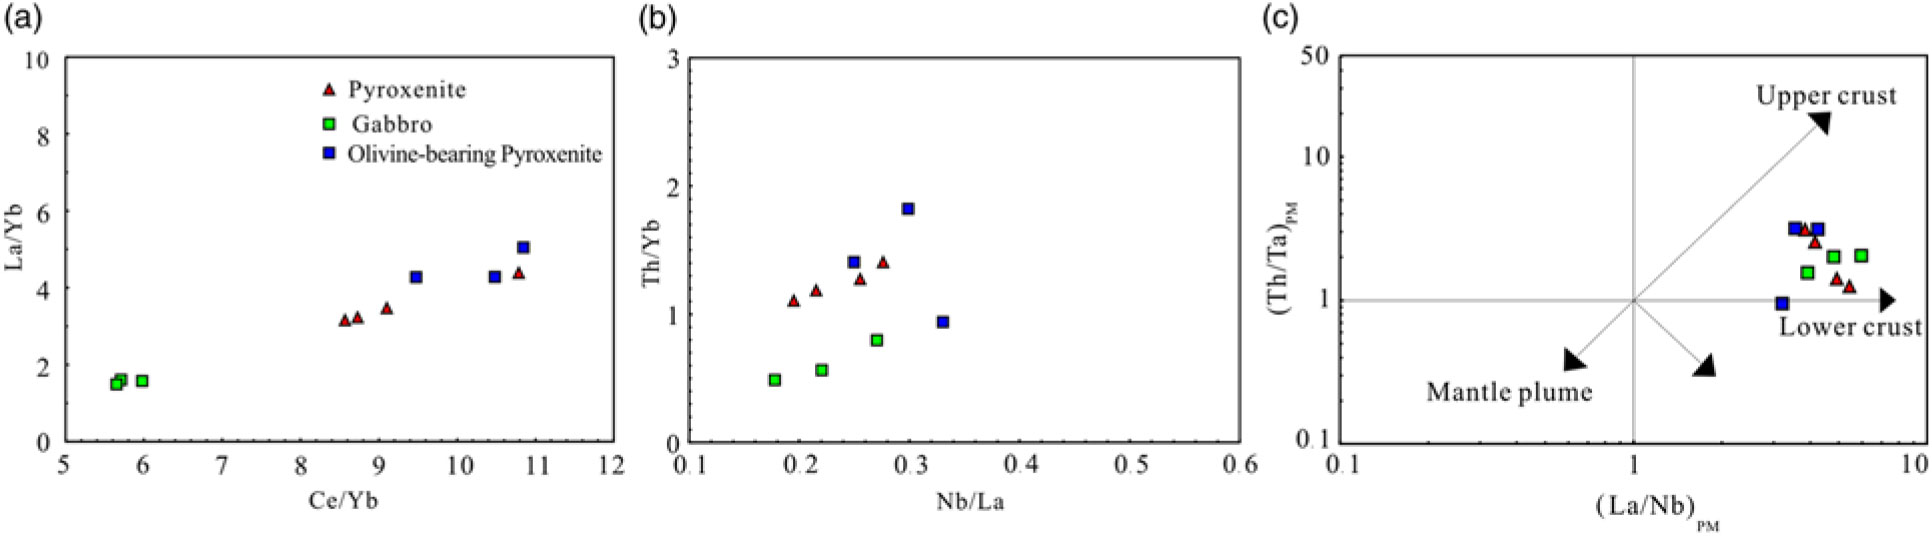
Assimilation–contamination commonly occurs during magma ascent. The presence of xenocrystic zircons derived from the Dakendaban Group basement indicates that the magma experienced crustal contamination during ascent. Various element ratios (e.g. Th/Yb, Zr/Yb, Nb/La, Ce/Pb, Ta/Yb and K2O/P2O5) are sensitive to contamination and can indicate whether assimilation–contamination occurred and the degree of contamination (Campbell and Griffiths, Reference Campbell and Griffiths1993; Baker et al. Reference Baker, Menzies, Thirlwall and Macpherson1997; MacDonald et al. Reference MacDonald, Rogers, Fitton, Black and Smith2001). The samples show positive correlations between Ce/Yb and La/Yb, and between Nb/La and Th/Yb (Fig. 14a, b), which suggest the role of assimilation–contamination. The Nb/U and Ce/Pb ratios do not change during partial melting and magmatic differentiation; their distribution coefficients remain constant and are indicative of their origin. Hofmann (Reference Hofmann1988) considered that MORB and OIB have high Nb/U ratios of 47 ± 10, and Campbell (Reference Campbell2002) considered that continental crust has Nb/U ratios of ∼9.7. The Nb/U ratios of the Hudesheng intrusions are 1.55–5.15, which are closer to the continental crust value. The Ce/Pb ratios are 25 ± 5 for mantle and <15 for continental crust (Furman et al. Reference Furman, Bryce, Karson and Iotti2004). The Ce/Pb ratios of the Hudesheng intrusion are 0.40–4.19, which are also closer to the continental crust value. These observations suggest that the parental magma experienced significant crustal contamination.
(a, b) Plots of selected trace element for checking contamination of Hudesheng mafic–ultramafic intrusions. (c) (La/Nb)PM vs (Th/Ta)PM diagrams for Hudesheng mafic–ultramafic complexes (after Neal et al. Reference Neal, Mahoney and Chazey2002).

S/Se ratios and S isotopes of rocks are commonly used to investigate the source of S and to estimate the degree of crustal contamination (Eckstrand and Cogulu, Reference Eckstrand and Cogulu1986; Eckstrand et al. Reference Eckstrand, Grinenko, Krouse, Paktunc, Schwann and Scoates1989; Peck and Keays, Reference Peck and Keays1990; Ripley, Reference Ripley1990; Holwell et al. Reference Holwell, Boyce and McDonald2007; Sharman et al. Reference Sharman, Penniston-Dorland, Kinnaird, Nex, Brown and Wing2013; Queffurus and Barnes, Reference Queffurus and Barnes2015; Smith et al. Reference Smith, Holwell, McDonald and Boyce2016). Previous empirical work considered that the S/Se ratio of the mantle falls within the range 2850–4350 (Eckstrand and Hulbert, Reference Eckstrand and Hulbert1987), with average values indicated by McDonough and Sun (Reference McDonough and Sun1995), Hattori et al. (Reference Hattori, Arai and Clarke2002) and Lorand et al. (Reference Lorand, Alard, Luguet and Keays2003) of 3333, 3300 and 3150, respectively. The S/Se ratio of chondritic magma is slightly lower than mantle values, with an average value of 2500 ± 270 (Dreibus et al. Reference Dreibus, Palme, Spettek, Zipfel and Wanke1995). Yamamoto (Reference Yamamoto1976) reported S/Se ratios for crustal rocks of 3500–10 000, while δ34S values range from less than −40 ‰ to >30 ‰. The S/Se ratios of the Hudesheng mafic–ultramafic intrusions range from 6422 to 8642 (excluding one sample that yielded 3871), exceeding the ratios of the mantle. Previous studies have shown that the addition or loss of S relative to the mantle S/Se ratio can be explained by the addition of crustal S or post-hydrothermalism alteration, respectively (Yamamoto, Reference Yamamoto1976; Howard, Reference Howard1977; Smith et al. Reference Smith, Holwell, McDonald and Boyce2016). On a diagram of S vs Se (Fig. 15), all samples plot between the mantle and crustal ranges (with the exception of one sample that plots within the mantle range), which provides further evidence for the role of crustal contamination in the formation of the Hudesheng intrusions.
Sulphur in wt% vs Se (ppm) for different sulphide assemblages hosted within the Hudesheng mafic–ultramafic intrusions. Mantle S/Se range is taken from Eckstrand and Hulbert (Reference Eckstrand and Hulbert1987).

The values of (La/Nb)PM and (Th/Ta)PM enable the source of crustal contamination to be distinguished between the upper or lower crust (Neal et al. Reference Neal, Mahoney and Chazey2002). All samples plot near the lower crust line in Figure 14c, indicating that the Hudesheng intrusions were contaminated by lower crustal material during ascent, which explains why the Hf model ages are older than their crystallization ages.
6.c. Type of intrusion and tectonic setting
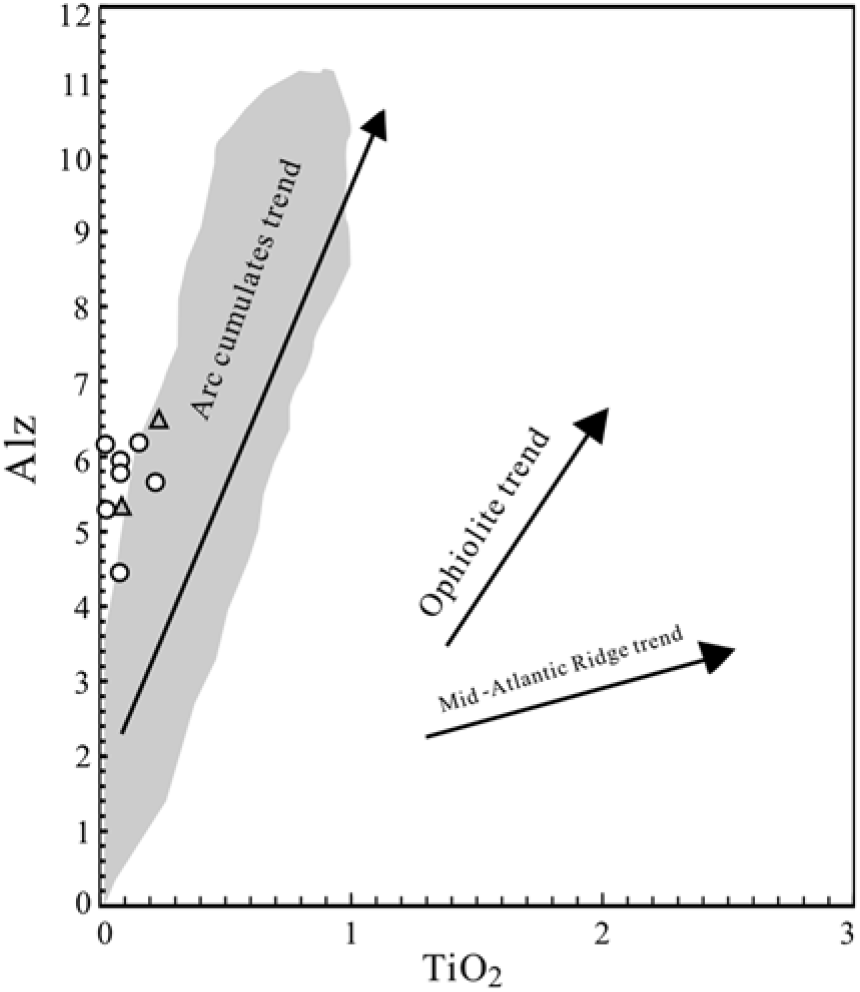
The Alaskan-type complexes are considered to be linked to arc magmatism and a subduction-related tectonic setting, with characteristics of convergent plate margins (Himmelberg and Loney, Reference Himmelberg and Loney1995; Batanova et al. Reference Batanova, Pertsev, Kamenetsky, Ariskin, Mochalov and Sobolev2005; Krause et al. Reference Krause, Brügmann and Pushkarev2007; Polat et al. Reference Polat, Fryer, Samson, Weisener, Appel, Frei and Windley2012; Helmy et al. Reference Helmy, Ab El-Rahman, Yoshikawa, Shibata, Arai, Kagami and Tamura2014). The Hudesheng intrusions have characteristics typical of Alaskan-type intrusions, including: (1) concentric zoning (dunite, olivine pyroxenite, pyroxenite, gabbro and hornblendite from center to margin); (2) location along the Hudesheng Deep Facture zone; (3) cumulate textures; (4) abundant clinopyroxene and lack of orthopyroxene; (5) an abundance of hydrous minerals such as hornblende and biotite; (6) low Ti contents and Al in tetrahedral sites of clinopyroxenes; and (7) all the amphibole samples plot in the typical Alaskan-type complex field (Fig. 6). The characteristics discussed above, together with the high Mg and low alkali further show similarities to the Alaskan-type intursions (Irvine, Reference Irvine1974; Snoke et al. Reference Snoke, Quike and Bowman1981; VJ Rublee (unpub. M.Sc. thesis, Univ. Ottawa, 1994); Fershater et al. Reference Fershater, Montero, Borodina, Pushkarev, Smirnov and Bea1997; Batanova et al. Reference Batanova, Pertsev, Kamenetsky, Ariskin, Mochalov and Sobolev2005; Farahat and Helmy, Reference Farahat and Helmy2006; Pettigrew and Hattori, Reference Pettigrew and Hattori2006). In addition, clinopyroxene compositions all plot in the field of Alaskan-type intrusions (Fig. 5). Whole-rock geochemical data show typical arc affinities (enrichment in LILEs (excluding gabbro samples) and depletion in HFSEs), which prove their genetic relationship to a subduction setting. Moreover, the high CaO value (22.30–24.03 wt%) and low TiO2 content of clinopyroxene, in addition to the depletion of CaO (0–0.02 wt%) in olivine, indicate an affinity to Alaskan-type intrusions. The Al2O3 and TiO2 contents in clinopyroxenes from the gabbro and ultramafic cumulates may help discriminate between ophiolitic and crystallization differentiation from arc magmatism (Loucks, Reference Loucks1990). The clinopyroxene from the Hudesheng intrusion plots close to the trend of arc cumulate and near the field of Alaskan-type intrusions on the TiO2 vs AlZ diagram (Fig. 16), and the amphibole samples also show significant arc affinities (Fig. 6), which further confirms an arc tectonic setting. Furthermore, the Hudesheng intrusions were emplaced into the basement of the Dakendaban and Jinshuikou groups, indicating a continental arc setting. The Hudesheng mafic–ultramafic intrusions therefore formed at an active continental margin, which provides direct evidence for subduction setting between the Oulongbuluke and Qaidam blocks during the Ordovician.
Alz (=Aliv * 100/2) vs TiO2 of clinopyroxene compositions from Hudesheng mafic–ultramafic intrusions. The arc cumulates, Mid-Atlantic ridge and Phanerozoic ophiolite compositional trends are from Loucks (Reference Loucks1990). The grey fields of Alaskan-type intrusions are from Himmelberg and Loney (Reference Himmelberg and Loney1995) and Helmy and El Mahallawi (Reference Helmy and El Mahallawi2003).

The present study area is located in the southeastern part of the Oulongbuluke Block, which is a micro-continent located between the Qilian and Qaidam blocks (Fig. 1). Previous studies focused on the metamorphic basement and Proterozoic tectonic events, the composition of covering strata, and the age and tectonic properties of the Oulongbuluke Block (Lu and Wang, Reference Lu and Wang2002; Lu et al. Reference Lu and Wang2002 a, b, Reference Lu, Li, Zhang and Niu2008; Chen et al. Reference Chen, Liao, Wang, Santosh, Sun, Wang and Mustafa2013). The metamorphic basement consists of the Delingha complex (2400–2360 Ma) and the Dakendaban Group (2470–2430 Ma) (Lu et al. Reference Lu, Li, Zhang and Niu2008; Wang, Reference Wang2008; Chen et al. Reference Chen, Gong, Sun, Li, Xia, Wang, Wu and Xu2009, Reference Chen, Zhang, Sun, Wang and Kusky2012, Reference Chen, Liao, Wang, Santosh, Sun, Wang and Mustafa2013; Gong et al. Reference Gong, Chen and Wang2012). The Qaidam, Oulongbuluke and Qilian blocks were formed after the Neoproterozoic Rodinia rifting event (∼800 Ma) (Lu and Wang, Reference Lu and Wang2002; Li et al. Reference Li, Lu, Wang, Xiang and Zheng2003; Xin et al. Reference Xin, Wang and Zhou2006).
Eclogites are exposed in the Yuka, Luliangshan and Shaliuhe regions. Chronological and geochemical data indicate that there are two types of eclogite: (1) the eclogite protolith was derived from continental crust with an age >750 Ma (Zhang et al. Reference Zhang, Yang, Mattinson, Xu, Meng and Shi2005, Reference Zhang, Mattinson and Yu2010; Chen et al. Reference Chen, Wang and Chen2007, Reference Chen, Gong, Sun, Li, Xia, Wang, Wu and Xu2009; Song et al. Reference Song, Su, Li, Zhang, Niu and Zhang2010); and (2) latest research identified that the eclogites were derived from oceanic crust with a protolith age of 1273 Ma (Ren et al. Reference Ren, Chen, Kelsey, Gong, Liu, Zhu and Yang2018). However, the similar metamorphic age (early Palaeozoic) is indicative of a significant early Palaeozoic tectonic–magmatic event. Shi et al. (Reference Shi, Yang and Wu2003) reported adakite at Luliangshan that yielded a magmatic crystallization age of 514 Ma. An ophiolitic mélange near Luliangshan and Taipinggou shows features typical of a back-arc basin and yields crystallization ages of 496 and 535 Ma (Yuan et al. Reference Yuan, Wang, Li, Hao, Xin, Zhang, Wang and Tian2002; Zhu et al. Reference Zhu, Chen, Liu, Zhao and Zhang2014, Reference Zhu, Chen, Wang, Wang and Liu2015), indicating that subduction occurred before 535 Ma. In addition, many studies have provided evidence for a subduction-related setting for the rock assemblage, which yields age ranges of 535–468 Ma (Han and Peng, Reference Han and Peng2000; Yuan et al. Reference Yuan, Wang, Li, Hao, Xin, Zhang, Wang and Tian2002; Wang et al. Reference Wang, Lu and Yuan2003, Reference Wang, Lu, Mo, Li and Xin2005; Wu et al. Reference Wu, Yang, Xu and Wooden2004, Reference Wu, Gao, Wu, Chen, Wooden, Mazadab and Mattinson2008; Wang, Reference Wang2006; Zhu et al. Reference Zhu, Chen, Liu and Li2010, Reference Zhu, Chen, Liu, Wang, Yang, Cao and Kang2012, Reference Zhu, Chen, Wang, Wang and Liu2015). However, the precise time span of oceanic subduction remains uncertain. The Hudesheng pyroxenite and gabbro yield ages of 455 and 465 Ma (Figs. 8 and 9), respectively, which further confirms that the North Qaidam region experienced long-lived oceanic subduction during the early Palaeozoic until at least 455 Ma.
Previous studies have proposed that the final closure of the ocean between the Qaidam and Oulongbuluke blocks occurred during the Middle Ordovician (450–460 Ma) along an E–W-trending ultra-high-pressure metamorphic belt (Wu et al. Reference Wu, Yang, Xu and Wooden2004, Reference Wu, Gao, Wu, Chen, Wooden, Mazadab and Mattinson2008; Zhu et al. Reference Zhu, Chen, Wang, Wang and Liu2015). However, the Alaskan-type Hudesheng intrusion reported in this paper yields ages of 455–465 Ma, which indicates that the eastern part of the Oulongbuluke Block was still in a subduction setting at this time and that closure of the palaeo-ocean occurred after 455 Ma. Compiled regional data show that collision-related granitic rocks are restricted to the western part of the North Qaidam region, such as the Saishitengshan, Tuanyushan and the Qaidam Mountain sections. No collision-related geological events of the same period have been identified in the eastern part of North Qaidam region. We therefore propose that the palaeo-ocean between the Qaidam and Oulongbuluke blocks closed diachronously from west to east, and the eastern part of the North Qaidam region experienced more long-lived subduction than the western part.
7. Conclusions
(1) The Hudesheng mafic–ultramafic intrusion is considered to be a typical Alaskan-type intrusion, yielding ages of 454.9 ± 3.6 Ma and 465.6 ± 1.1 Ma.
(2) The parental magma of the Hudesheng intrusion was derived from depleted mantle with a composition of hydrous picritic basalt. The magma was modified by subduction-related fluids and experienced significant lower crustal contamination, during either ascent or emplacement.
(3) The recognition of the Hudesheng mafic–ultramafic intrusion as an Alaskan-type intrusion suggests that arc magmatism occurred between the Oulongbuluke and Qaidam blocks. The presence of the Hudesheng Alaskan-type intrusions implies that the North Qaidam region experienced long-lived oceanic subduction during the early Palaeozoic. Furthermore, the palaeo-ocean between the Qaidam and Oulongbuluke blocks closed diachronously from west to east, and the eastern part of the North Qaidam Ocean was closed after 455 Ma.
Acknowledgements
For their help with the analysis we thank the staff of the MLR Key Laboratory of Metallogeny and Mineral Assessment, Institute of Mineral Resources, Chinese Academy of Geological Sciences; the MLR Key Laboratory of Metallogeny and Mineral Assessment, Institute of Mineral Resources, Chinese Academy of Geosciences, Beijing, China; the Testing Center of Jilin University; and Jilin Institute of Geological Sciences. This work was financially supported by the National Natural Science Foundation of China (Grant 41272093), and China geological survey project (Grant 12120114080901).