Biochar is a porous carbonaceous solid produced by thermochemical conversion (pyrolysis) of biomass in a low-oxygen atmosphere. Owing to its intrinsic properties, the application of biochar to soil is expected to sequester carbon and concurrently improve soil functions in sustainable manner (Verheijen et al. Reference Verheijen, Jeffery, Bastos, van der Velde and Diafas2009, Shackley & Sohi Reference Shackley and Sohi2010). The potential of biochar to mitigate global climate change is chiefly due to its highly recalcitrant nature (Cheng et al. Reference Cheng, Lehmann, Thies and Burton2008), which slows down the rate at which photosynthetically-fixed carbon is returned to the atmosphere. The turnover times have been estimated at 900 to 1800 years (Cheng et al. Reference Cheng, Lehmann, Thies and Burton2008; Lehmann et al. Reference Lehmann, Skjemstad, Sohi, Carter, Barson, Falloon, Coleman, Woodbury and Krull2008).
Furthermore, the agricultural use of biochar is claimed to yield several additional benefits, such as increased crop yields (Major et al. Reference Major, Rondon, Molina, Riha and Lehmann2010), reduction of nutrient leaching (Brockhoff et al. Reference Brockhoff, Christians, Killorn, Horton and Davis2010), and reduced N2O emissions from soils (Yanai et al. Reference Yanai, Toyota and Ozakaki2007). These effects may be attributable to increased pH and enhanced activity of micro- and macro-fauna in the soil (Chan et al. Reference Chan, Van Zwieten, Meszaros, Downie and Joseph2008), improved water retention (Brockhoff et al. Reference Brockhoff, Christians, Killorn, Horton and Davis2010) and increased cation exchange capacity of soil (Liang et al. Reference Liang, Lehmann, Solomon, Kinyangi, Grossman, O'Neill, Skjemstad, Thies, Luizao, Petersen and Neves2006). These benefits make biochar application remarkable, and possibly unique, among the possible strategies to reduce atmospheric CO2.
The effect of biochar on microbial activity of soils may be due to its provision of water, nutrients and habitat for microorganisms (Lehmann et al. Reference Lehmann, Da Silva, Steiner, Nehls, Zech and Glaser2003; Warnock et al. Reference Warnock, Lehmann, Kuyper and Rillig2007) and stimulation of the decomposition of soil organic matter (Wardle et al. Reference Wardle, Nilsson and Zackrisson2008). Moreover, the degradation of biochar provides a partly labile C source for microbes (Cheng et al. Reference Cheng, Lehmann, Thies and Burton2008). Although most of the biochar C is held in stable aromatic compounds, many surface functional groups are available for abiotic and microbial-mediated oxidation reactions (Cheng et al. Reference Cheng, Lehmann, Thies and Burton2008; Zimmermann Reference Zimmerman2010). A small fraction (0·26–0·4% of total C) of wood-derived biochars has been shown to be mineralised within the first two months in laboratory conditions (Hamer et al. Reference Hamer, Marschner, Brodowski and Amelung2004; Cheng et al. Reference Cheng, Lehmann, Thies and Burton2008), but the mineralisation rate decreased strongly in a longer-term experiment (Kuzyakov et al. Reference Kuzyakov, Subbotina, Chen, Bogomolova and Xu2009).
Incorporating biochar in agricultural soils not only changes their biology, but is also likely to have a related strong effect on their nitrogen dynamics. As the C/N ratio of biochar is commonly relatively high, the initial mineralisation of its available C would result in a short-term N immobilisation. This has been reported in both pot and field experiments on tropical N-limited soils (reduced plant N uptake and yields (Lehmann et al. Reference Lehmann, Da Silva, Steiner, Nehls, Zech and Glaser2003; Asai et al. Reference Asai, Samson, Stephan, Songyikhangsuthor, Homma, Kiyono, Inoue, Shiraiwa and Horie2009)) as well as in laboratory incubations (Kolb et al. Reference Kolb, Fermanich and Dornbush2009; Novak et al. Reference Novak, Busscher, Watts, Laird, Ahmedna and Niandou2010; Nelson et al. Reference Nelson, Agudelo, Yuan and Gan2011; Bruun et al. Reference Bruun, Ambus, Egsgaard and Hauggaard-Nielsen2012). However, there is lack of knowledge about the duration and mechanisms responsible for the N immobilisation by biochars of different quality and application rates in agricultural soils, and whether the impact depends on the chemical form of fertiliser.
The effects on soil nitrogen dynamics of the applications of biochar alone or in combination with mineral N fertilisers has been the focus of a few recent studies (Kolb et al. Reference Kolb, Fermanich and Dornbush2009; Novak et al. Reference Novak, Busscher, Watts, Laird, Ahmedna and Niandou2010; Nelson et al. Reference Nelson, Agudelo, Yuan and Gan2011; Bruun et al. Reference Bruun, Ambus, Egsgaard and Hauggaard-Nielsen2012). However, there is a gap in the understanding of longer-term biochar effects, as in these studies the incubations were run for less than 70 days, with the exception the 96-day incubation by Kolb et al. (Reference Kolb, Fermanich and Dornbush2009). Furthermore, there is a lack of studies focusing on the effects of biochar application to N dynamics over time when applied together with organic fertilisers. Since the importance of nutrient recycling through increased use of organic fertilisers has been widely recognised (Roy et al. Reference Roy, Misra and Montanez2002; Römer Reference Römer2009), the effects of biochar application on the nutrient dynamics of organic fertilisers in soil are of particular interest.
One of the organic N fertilisers increasingly being used in Europe is meat bone meal (MBM), a by-product of the slaughtering industry. Despite the fact that MBM contains only 8% nitrogen, its low C:N ratio (about 4·5) provides a large potential for N mineralisation (Jeng et al. Reference Jeng, Haraldsen, Vagstad and Gronlund2004). The potential of MBM as an effective organic fertiliser was supported also by the enhancement of the biomass and activity of soil microorganisms in an incubation experiment (Mondini et al. Reference Mondini, Cayuela, Sinicco, Sanchez-Monedero, Bertolone and Bardi2008). In earlier studies on the fertiliser use of meat bone meal, attention has been paid to a variety of characteristics, including the effects on the yields of cereals and grasses (Salomonsson et al. Reference Salomonsson, Jonsson, Salomonsson and Nilsson1994, Reference Salomonsson, Salomonsson, Olofsson and Jonsson1995; Jeng et al. Reference Jeng, Haraldsen, Vagstad and Gronlund2004, Reference Jeng, Haraldsen, Gronlund and Pedersen2006; Chen et al. Reference Chen, Kivelä, Helenius and Kangas2011), the nutrient use efficiencies of N and P by plants (Ylivainio et al. Reference Ylivainio, Uusitalo and Turtola2008; Jeng & Vagstadt Reference Jeng and Vagstadt2009; Ylivainio & Turtola Reference Ylivainio, Turtola, Turtola and Ylivainio2009), as well as the impact on the composition of microbial populations in soil (Mondini et al. Reference Mondini, Cayuela, Sinicco, Sanchez-Monedero, Bertolone and Bardi2008). Yet there have been no studies on the interactive effects of using biochar together with MBM. Knowledge on such interactions is especially important when biochar practices are extended to organic farming systems.
The objective of this study was to determine how biochar application to soil affects the N mineralisation dynamics, and if the effect is dependent on the type or organic source of the N.
1. Materials and methods
1.1. Biochar
Biochar was produced by pyrolising softwood chips made of partially debarked spruce and pine from Southern Finland in a continuously programmable pressurised carboniser (Preseco Oy, Lempäälä. Finland). The temperature of the carboniser was maintained constant at 550–600°C during the whole pyrolysis process. Dried softwood chips were fed into the reactor tube trough via an airtight feed-in system and were then slowly moved by a screw conveyor through the hot region of the reactor tube, where the chips were heated for 10–15 minutes. The biomass was pyrolysed by the heat transferred through the walls of the reactor tube. The pyrolysis process was set up to maximise the carbon content of biochar. The reaction products consisted of approximately 50%, 30% and 20% of biochar, gaseous products and bio-oil, respectively. The biochar was cooled overnight in an airtight silo and moved by a conveyor to a roller mill for grinding. After grinding, the biochar had a particle size of less than 2 mm and was stored in a plastic bag for six months.
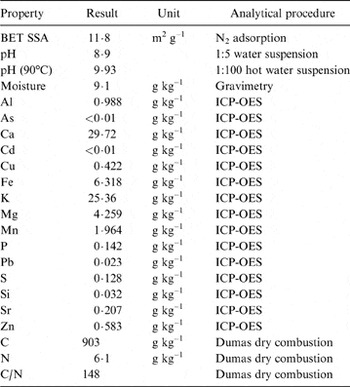
Prior to the experiment, the biochar was first dried at 40°C for 72 hours and then sieved through a 0·2-mm mesh. The gravimetric moisture content of the sieved biochar (w/w) was determined by oven-drying a 4-g portion overnight at 105°C (Table 1). Biochar pH was measured with standard combination electrodes, both from 1:5 (v/v) suspension of biochar in deionised water, and by the method used by Ahmedna et al. (Reference Ahmedna, Johns, Clarke, Marshall and Rao1997). The latter consisted of preparing a 1% (w/w) suspension of biochar in deionised water, heating it to about 90°C and stirring for 20 minutes to allow the dissolution of the soluble biochar components. After cooling to room temperature, the pH of the biochar suspension was measured. Additionally, the liming effect of unsieved biochar was determined by measuring the pH change of suspensions (1·5, w/w) of soil samples incubated for four days with different amounts of biochar added. The liming effect of biochar was negligible compared with CaCO3 (data not shown).
Physicochemical properties of softwood biochar used in the experiment.

ICP-OES=inductively coupled plasma optical emission spectroscopy. Elemental composition analyses were conducted in triplicate for ICP-OES; all other analyses in duplicate.
For total elemental analyses, the biochar was dried and then digested according to the EPA 3052 microwave-assisted acid digestion method (USEPA 1996). The elemental concentrations (Al, As, Ca, Cd, Cu, Fe, K, Mg, Mn, P, Pb, S, Si, Sr and Zn expressed on a dry, w/w, ash-free basis) in the biochar digests were determined using an inductively coupled plasma optical emission spectrometry (ICP-OES) (Thermo-Fisher iCAP3600 MFC Duo, Thermo Fisher Scientific, Bremen, Germany). The total C and N contents of the biochar were determined by dry combustion with a VarioMax CN analyser (Elementar Analysensysteme GmbH, Hanau, Germany). The Brunauer–Emmett–Teller specific surface area (BET SSA) was determined by the Earth and Foundation Structures laboratory of Tampere University of Technology, with a single point (at 0·30 partial pressure) method using samples ground and sieved to pass through a 0·063 mm mesh and pre-heated at 300°C for 30 minutes before analysis. The BET SSA was then determined by using nitrogen adsorption techniques at 77 K with a Micromeritics Flowsorb 2300 gas adsorption analyser (Micromeritics, Norcross, USA).
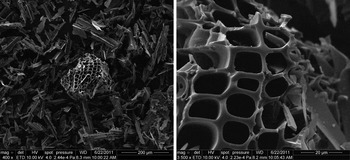
Scanning electron microscopy (SEM) pictures were taken of small samples of biochar that had been prepared by scattering onto double-side scotch tape fixed to an aluminium sample holder and sputter coating with 5 nm of platinum (Quorum Q150TS, Quorum Technologies Ltd., East Grinstead, UK). SEM images of biochar (Fig. 1) were taken using primary electron beam energy of 10 keV with a FEI Quanta 250 Field Emission Gun Scanning Electron Microscope (FEI Co., Philips, Eindhoven, Netherlands). Solid-state magic angle-spinning 13C NMR spectra were obtained on a Bruker Avance spectrometer (Bruker Analytische GmbH, Rheinstetten, Germany) operated at 13C frequency of 150 MHz. The direct excitation 13C NMR spectra of the biochar sample provided evidence that approximately 90% of the biochar-C was in aromatic form (data not shown).
Scanning electron microscope (SEM) images of 0·2 mm sieved biochar particles. SEM images from the same sample were taken at 400× magnification (on left) and at 3500× magnification (on right).

1.2. Soil
The experimental soil was taken with a spade from the upper layer (0–25 cm deep) of a Gleyic Phaeozem (FAO 1998) at a single point location from a field at the Viikki Experimental Farm of the University of Helsinki, Finland (N 60°13′46″, E25°2′33″) in October 2010. In order to ensure the soil homogeneity, the soil was taken from a single point location from a 0·5 m×0·5 m area, mixed and sieved through a 2-mm mesh. Small grain cereals (wheat and barley) had been grown in the field with conventional mouldboard ploughing and mineral fertiliser practices for the preceding six years. Prior to that, the field had been under clover cultivation for four years.
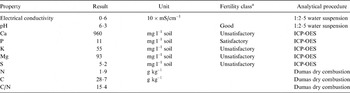
According to the particle size analysis by a pipette method (Elonen Reference Elonen1971), the soil had a loamy sand texture, with 83·2% sand, 15·3% silt and 1·5% clay. Soil chemical analyses were carried out by the Finnish soil testing company Viljavuuspalvelu Oy according to the Finnish soil testing method (Vuorinen & Mäkitie Reference Vuorinen and Mäkitie1955), based on shaking the soil sample in an acid ammonium acetate solution (AAAc, 0·5 M ammonium acetate and 0·5 M acetic acid, solution pH 4·65) using a 1:10 volumetric soil-to-solution ratio. The extracted elements were subsequently determined by ICP-OES (Thermo-Fisher iCAP6500, Thermo Fisher Scientific, Bremen, Germany), except for P that was determined by colourimetry with a molybdenum blue method (Lachat QuikChem 8000, Lachat Instruments, Milwaukee, USA) (Table 2). The electrical conductivity and pH of soil were determined in a 1:2·5 (w/w) soil-to-water mixture (Vuorinen & Mäkitie Reference Vuorinen and Mäkitie1955; MTT 1986). A VarioMax CN analyser was used for the determination of total carbon (C) and nitrogen (N) contents. Soil C was assumed to be organic in nature, because the soil carbonate content in this soil was known to be negligible.
Chemical properties of the soil used in the experiment.

a Based on Finnish guidelines for agricultural soils (Viljavuuspalvelu Oy, Reference Viljavuuspalvelu2008).
1.3. Fertilisers
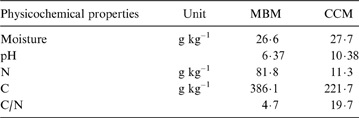
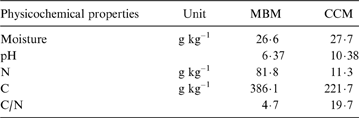
Two organic fertilisers were used in the experiment: a granulated meat bone meal-based fertiliser Aito-Viljo® (MBM) and composted cattle manure (CCM). Aito-Viljo® is a commercial fertiliser produced by Honkajoki Oy, Honkajoki, Finland, comprising approximately 39% C and 8% N, which results in a C/N ratio of 4·7 (Table 3). The composted cattle manure (N content 1·13% and C/N ratio of 19·7) was provided by an organic cattle farm, where straw bedding had been used. Prior to the experiment, the manure had been composted for six months. Both fertilisers were air-dried and ground before experimental use. The moisture content (w/w) of the fertilisers was determined by oven drying a 5-g portion overnight at 105°C, and the pH by using a 1:5 (w/w) fertiliser-to-deionised-water mixture (Vuorinen & Mäkitie, Reference Vuorinen and Mäkitie1955, MTT 1986). Total C and N in the fertilisers were determined by combustion with a VarioMax CN analyser.
Physicochemical properties of organic fertilisers used in the experiment. All analyses were conducted in duplicate.
1.4. Experimental design
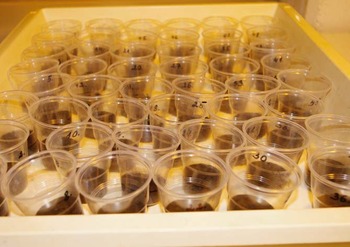
The effects of biochar on the net N mineralisation dynamics of the two organic fertilisers were investigated in a factorial laboratory incubation experiment with time, biochar and fertiliser as experimental factors. The experiment included a total of twelve completely randomised combinations of biochar and fertiliser treatments with four replicates. The biochar treatments were 0, 4·6, 9·1 and 13·6 g kg–1 soil DM (corresponding to 0, 10, 20 and 30 Mg ha–1, assuming a furrow slice of 2200 Mg ha–1). The fertiliser treatments were no fertilisation (control), 1·7 g kg–1 Aito-Viljo® and 12·4 g kg–1 composted cattle manure. The applied rate of both fertilisers corresponded to 139 mg N kg–1 soil (306 kg N ha–1). A total of 288 conical 100-ml, open-top PVC beakers were used as incubation vessels. A 24·3 g portion of fresh soil (20·6 g dry weight) was weighed into each beaker. Six identical batches were destructively analysed on days 0, 14, 28, 56, 84 and 133. The beakers for each extraction time were put randomly on plastic trays so that for each extraction time there was a separate tray (Fig. 2). Biochar and fertilisers were mixed thoroughly into the soil (carefully avoiding any contamination), and the mixtures were slightly compacted to approximately 1·1 Mg m–3.
A set of 48 PVC beakers completely randomised on a plastic tray. Each sampling time corresponded to one tray.

Soils of all treatments were then wetted with sufficient deionised water to obtain the field capacity moisture content (−10 kPa matric potential corresponding to the gravimetric water content of 240 g kg–1). Soil moisture was kept constant at field capacity by weighing the beakers weekly and adding water if necessary. The trays with the beakers were put in separate polyethylene bags to avoid moisture loss. Incubations were carried out in a constant temperature room at 15±1°C. The duration of incubation and the soil temperature and moisture conditions approximated the typical duration of the growing season and the temperature and field capacity of topsoil in the boreal climate of southern Finland.
The contents of soil mineral N (NO3– and NH4+) were determined on the six sampling dates. All the soil in each beaker (20·6 g soil DM) was poured into a 100-ml centrifuge tube, 50 ml of 2 M KCl was added and the tubes were closed with silicon caps. The suspensions were shaken with a low speed reciprocal shaker for two hours (Esala Reference Esala1991). After the suspensions settled for 40 minutes, the supernatant was filtered through an ashless Whatman 589/3 filter (previously washed with 20 ml of 2 M KCl and 20 ml of deionised water to remove possible NH4+ contamination). The ammonium and nitrate concentrations of the extracts were determined by a standard colourimetric flow injection analysis with a Lachat QuikChem 8000 (Lachat QuikChem methods 12-107-06-2-A and 12-107-04-1-E, respectively, Lachat Instruments, Milwaukee, USA). The moisture content of the soil was taken into account as a small increase in the volume of extractant when calculating the extractant-to-soil ratio, and expressing the measured NO3– and NH4+ contents based on the dry weight of the soil (N mg kg–1 DM).
1.5. Calculation and statistics
The fertiliser effects on N availability were tested for with a three-way analysis of variance (ANOVA) with fertiliser type, biochar level, time and their interactions as fixed effects. Subsequently, a one-way ANOVA procedure was used to compare biochar treatment effects at any given time within each fertiliser treatment. Post-hoc tests were carried out by the Tukey HSD multiple pair-wise comparison procedure to determine the significant differences between different biochar additions on the extractable NH4+ and NO3–. Statistical tests were carried out with the software package PASW v.18.0 (SPSS Corp., Chicago, USA) at a P<0·05 level of significance.
Net N mineralisation in each fertiliser and biochar treatment was calculated as a difference from the mineral nitrogen content at the start of incubation according to:
 $$\Delta N_{t,F,B} = N_{t, F,B} - N_{0, F,B}$$
where ΔNt,F,B is the amount of net N mineralisation (mg N kg–1 soil), and Nt,F,B and N0,F,B are the mineral N contents at a given measurement on day t and day 0, respectively, for a given fertiliser type (F) and biochar application rate (B) (mg N kg–1 soil DM).
Subsequently, the effect of biochar application on the net N mineralisation/immobilisation at a given time (t) was calculated for each fertiliser (F) treatments by subtracting the corresponding amount of net N mineralisation in the soil with no added biochar (B=0):
 $$\Delta N^{eff}_{t, F,B} = \Delta N_{t F,B} - \Delta N_{t,F,0} = (N_{t, F,B} - N_{0, F,B}) - ( N_{t,F,0 }- N_{0,F,0})$$
where ΔNefft,F,B is the net effect of biochar addition on the N mineralisation/immobilisation in soil (mg N kg–1 soil DM).
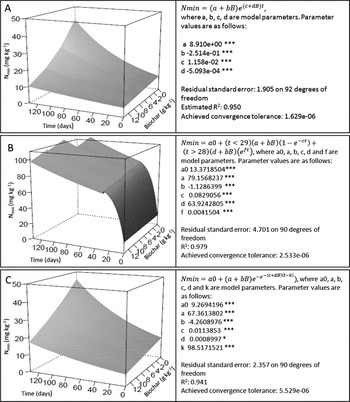
The relationships between the cumulative N mineralisation with time of incubation as a function of biochar application rate were modelled for all fertiliser treatments by using standard or confined exponential models based on the first order rate kinetics (Stanford et al. Reference Stanford, Carter and Smith1974, Stevenson & Cole Reference Stevenson, Cole, Stevenson and Cole1999). The effects of added biochar on the model parameters were modelled linearly. From these models, the ones best-fitting our data were selected using the Akaike information criterion (Burnham & Anderson Reference Burnham, Anderson, Burnham and Anderson2010). The simple exponential model gave the best fit for the unfertilised control and CCM treatments:
 $$Nmin=(a + b B) e ^{(c+dB)t}$$
where Nmin is the amount of mineral N in soil (mg N kg–1 soil), a, b, c and d are constants, t is the time (in days) of incubation, and B is the amount of biochar applied (g kg–1). A model consisting of a confined exponential and a standard exponential function with the indicator functions (t≤28) and (t>28) returning 1 where true and 0 where false was the best for MBM:
 $$Nmin = a0 + (t \le 28)(a + bB)(1-e^{-ct}) + (t > 28)(d + bB)(e ^{f t})$$
where Nmin is the amount of mineral N in soil (mg N kg–1 soil) and a0, a, b, c, d and f are constants, t is the time (in days) of incubation, and B is the amount of biochar applied. Modelling was conducted with R v.2.12.2 (Lucent Technologies, Madison, USA).
2. Results
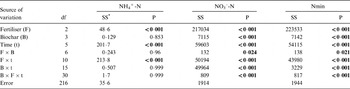
The fertiliser type (F), biochar level (B) and time (t), as well as all their interactions, had highly significant (P<0·001) effects on the contents of NO3– and mineral N (the sum of NH4+-N and NO3–-N) in soil (Table 4). This result indicates that the temporal patterns of soil mineral N content were not the same for all fertiliser types, and that the patterns were modified by biochar additions. In contrast, the temporal patterns of soil NH4+ content were affected only by fertiliser type and time, not by biochar additions, as the biochar level and its interaction with the fertiliser type were not significant (P>0·05). Generally, the impacts of different experimental factors on nitrate were more pronounced than those on ammonium, probably partly due to the fact that NO3– dominated the mineral N pool (Figs 3, 4).
Three-way ANOVA table with fertiliser type, biochar level, time and their interactions as fixed effect factors on extractable NH4+-N, NO3–-N and Nmin (NH4++NO3–).

Statistically significant effects are in bold font: df=degrees of freedom; P=probability; SS=type III sum of squares
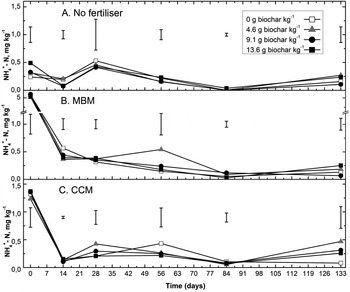
Changes in soil NH4+ content in the different fertiliser treatments with time at four levels of biochar additions (N mg kg–1 DM): (A) no fertiliser (control); (B) MBM treatment; (C) CCM treatment. Vertical bars represent the standard error of the means at a given day (n=4). No significant deviations from the no-biochar treatment were present at any biochar level on any measurement day (P>0·05). Note the break in the y-axis of the MBM treatment.

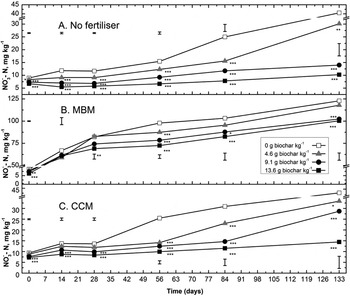
Changes in soil NO3– content in the different fertiliser treatments over the time of incubation, as affected by biochar additions: (A) no fertiliser; (B) MBM treatment; (C) CCM treatment. Vertical bars represent the standard error of the means on a given day (n=4). Asterisks indicate the significant differences from the no biochar treatment on a given day at P<0·05 (*), P<0·01 (**), and P<0·001 (***). Note the different scales of the y-axis between different fertilisers, as well as the breaks in all y-axes.

None of the differences in ammonia concentrations between biochar application rates within fertiliser treatments were statistically significant (P>0·05), although increasing the biochar application rates in the no-fertiliser treatment (control) tended to increase NH4+ concentrations at the beginning of the incubation (Fig. 3). Nevertheless, this effect was no longer present after two weeks of incubation. For both fertiliser treatments, the ammonia concentrations in the soils decreased over time, and most of it had obviously been nitrified by day 14. Thereafter the ammonium concentrations remained low, and nitrate represented 97–100% of the mineral N pool in all treatments.
The NO3–-N contents increased most rapidly in the MBM treatments, reaching a level almost three times higher than in the CCM treatments and control soils by the end of the incubation (Fig. 4). The mineralisation of nitrate from the MBM-treated soil was extremely rapid: after two weeks of incubation, the nitrate concentrations exceeded the maximum levels found in other fertiliser treatments at the end of the 133-day experiment. The nitrate content increased with time in all biochar and fertiliser treatments. However, the NO3– contents decreased progressively as the amount of added biochar increased in the cases of no fertiliser and CCM treatments, at most times. With MBM, the NO3–-N contents at the lowest biochar application level (4·6 g biochar kg–1) were not significantly different from the zero biochar treatments for most of the time points.
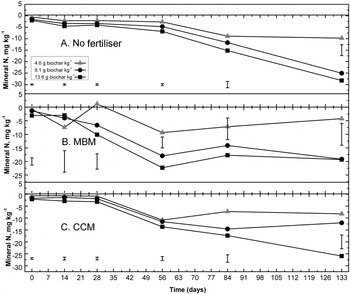
The suppressive effect of biochar, was different depending on fertiliser type, and this was reflected in the temporal pattern of net immobilisation of N in soil (Fig. 5). For the no-fertiliser treatment, added biochar decreased soil mineral N concentrations at all application rates. The net N immobilisation with biochar was highest for the non-fertilised control, followed by CCM and MBM, and the largest reductions were 28, 26 and 19 mg N kg–1, respectively. The impact of biochar increased with time, and became stronger with larger additions. On the other hand, if fertiliser was added to the soil, the biochar-induced reductions in the net N mineralisation started to decrease after day 56 (Fig. 5). The tendency was most evident at the lowest biochar application levels. Fertiliser types differed in this respect. With MBM, the reductions in the net N mineralisation peaked at day 56, after which they moderated at all biochar application rates, most rapidly at the lowest rate. With CCM, the inhibitory effect of biochar started to decrease at the two lower application rates, but continued to increase until the end of the incubation period at the highest application rate (Fig. 5).
Reduction of soil mineral N-content by biochar addition, with reference to the corresponding no-biochar treatments (Eq. 2 in the text): (A) no fertiliser; (B) MBM treatment; (C) CCM treatment. Vertical bars represent the standard error of means (n=4).

Based on the Akaike information criterion values obtained when fitting exponential models to all fertiliser treatments, N mineralisation in the unfertilised control and CCM treatments were best described by a simple exponential model based on the first order rate kinetics model. For MBM, a model consisting of two sequential exponential functions, corresponding to the different kinetics at the beginning and later times of the incubation, fitted best (Figures 6 and 7). Both the N mineralisation rate and cumulative N mineralisation in the MBM treatment were significantly greater than from CCM and unfertilised control treatments.

Modelled 3-D response surfaces of cumulative N mineralisation with time as a function of biochar application rates: (A) no fertiliser; (B) MBM; (C) CCM. Nmin of the regression models is the among of mineral N in soil (mg N kg–1 soil), B is the biochar application rate (g kg–1), and t is the time from the start of incubation (days). Notations (t≤28) and (t>28) in MBM modelling refer to indicator functions that return 1 where true and 0, where false. Asterisks indicate the significance levels for model parameters as follows: P<0·05 (*), P<0·01 (**), and P<0·001 (***).

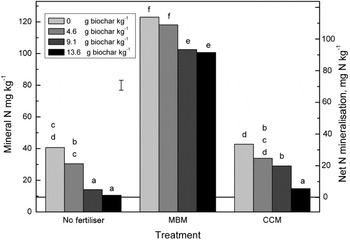
The cumulative net N mineralisation in soil by the final day of incubation was highest in the MBM treatments without biochar application (114 mg N kg–1, 82% of the total N added) (Fig. 8). The cumulative mineralisation in the CCM treatments was notably lower, and similar to that in the non-fertilised treatments. At the higher biochar addition levels, mineralisation in both the non-fertilised control and CCM treatments was not significantly greater than that in the starting soil.
Soil mineral N concentrations at the end of incubation (day 133) in non-fertilised control, MBM and CCM treatments. The mineral N content of the bare soil at the beginning of the incubation is provided for comparison. Bars marked with different lowercase letters differed significantly (Tukey HSD multiple pair-wise comparison, P<0·05). Vertical bar represent the standard error of means (n=4).

3. Discussion
The Ca, K, Fe and Mg concentrations of softwood biochar used in this experiment were expectedly rather high, corroborating also with other previous research on wood-derived biochars (Brewer et al. Reference Brewer, Schmidt-Rohr, Satrio and Brown2009; Gaskin et al. Reference Gaskin, Speir, Harris, Das, Lee, Morris and Fisher2010). Since the experimental soil was limited in plant-available K, Ca and Mg contents, there would have been some potential for direct fertilisation impact, and thereby enhanced soil microbial activity, by adding biochar into the soil. However, it is not possible to estimate these impacts quantitatively, as the bioavailability of nutrients in biochars varies significantly depending on the various feedstock and pyrolysis conditions. For instance, Gaskin et al. (Reference Gaskin, Speir, Harris, Das, Lee, Morris and Fisher2010) reported only small and inconsistent increasing effects in Mehlich I extractable K and Ca concentrations by the addition of pine chips biochar into a loamy sand soil. Additionally, the alkaline nature of our biochar corroborates with previous studies (Fuertes et al. Reference Fuertes, Arbestain, Sevilla, Macia-Agullo, Fiol, Lopez, Smernik, Aitkenhead, Arce and Macias2010), and suggests a potential liming effect of soil, which could further increase microbial activity. However, short-term measurements confirmed only a minor liming effect for this biochar in comparison with CaCO3.
The rather low Brunauer, Emmet, and Teller specific surface area (11·8 m2 g–1) contrasts with those of many other softwood-derived biochars commonly characterised by high internal surface areas, ranging typically between 200–400 m2 g–1 for pine chips pyrolised at 500 to 600°C (Brown et al. Reference Brown, Kercher, Nguyen, Nagle and Ball2006; Keiluweit et al. Reference Keiluweit, Nico, Johnson and Kleber2010). The scanning electron microscope images of biochar revealed that the cellular structure of wood had been broken down to a great extent, as the majority of biochar particles consisted of fragments of cell walls, with few clearly distinguishable larger particles resembling the original softwood raw material (Fig. 1). Such a loss of cellular structure may partly explain the rather low BET specific surface area, whereas the possible explanations for this could include alterations in the pyrolysis conditions within the carboniser and the issues related to the post-pyrolysis handling (e.g. the ignition of hot biochar in a non-oxygen sealed environment), neither of which we were informed of. If we accept the view that a large BET SSA promotes the microbial population by providing moisture, nutrients and attachment sites for colonisation (Warnock et al. Reference Warnock, Lehmann, Kuyper and Rillig2007), the extent to which our low-SSA biochar could promote microbial activity would be relatively small.
The biochar used in this experiment had a fairly high carbon content (90·3%), primarily composed of aromatic compounds (about 90% of the total C). The amount of aromatic carbon compounds has been reported to amplify with increasing temperature of the pyrolysis process (Lu et al. Reference Lu, Sahajwalla and Harris2000; Nguyen et al. Reference Nguyen, Lehmann, Hockaday, Joseph and Masiello2010); therefore, the softwood chips biochar pyrolysed at 550–600°C for our experiment may have a significant soil C-sequestration value. Although the bulk of C in biochar is stable, a certain amount of wood-derived biochars (0·26–0·4% of total C) can reportedly be decomposed within the initial two-month period of laboratory incubation, due to the abiotic and microbial-mediated oxidation reactions of the surface functional groups (Hamer et al. Reference Hamer, Marschner, Brodowski and Amelung2004; Cheng et al. Reference Cheng, Lehmann, Thies and Burton2008). This possibly could also stimulate mineralisation of native soil organic matter (Wardle et al. Reference Wardle, Nilsson and Zackrisson2008).
On the other hand, the N-containing structures in the biochar, such as amino acids, amino sugars and amines, are likely to be condensed to form recalcitrant N-polycyclic aromatic structures during the relatively high pyrolysis temperature (Koutcheiko et al. Reference Koutcheiko, Monreal, Kodama, McCracken and Kotlyar2007; Novak et al. Reference Novak, Busscher, Laird, Ahmedna, Watts and Niandou2009), so may not be readily available. The fairly high carbon content, together with the low total nitrogen content (0·61%), gives a high C/N ratio for the biochar (148:1), which would facilitate a potential for N immobilisation that may cause negative effects on crop yields. Previous research on the effects of added biochar on soil N dynamics has indeed shown evidence of short-term N immobilisation in laboratory incubations (Kolb et al. Reference Kolb, Fermanich and Dornbush2009; Novak et al. Reference Novak, Busscher, Watts, Laird, Ahmedna and Niandou2010; Nelson et al. Reference Nelson, Agudelo, Yuan and Gan2011; Bruun et al. Reference Bruun, Ambus, Egsgaard and Hauggaard-Nielsen2012). Signs of N immobilisation (reduced plant N uptake and yields) have also been reported in field and pot experiments (Lehmann et al. Reference Lehmann, Da Silva, Steiner, Nehls, Zech and Glaser2003; Asai et al. Reference Asai, Samson, Stephan, Songyikhangsuthor, Homma, Kiyono, Inoue, Shiraiwa and Horie2009). On the other hand, both Steiner et al. (Reference Steiner, Teixeira, Lehmann, Nehls, de Macedo, Blum and Zech2007) and Gaskin et al. (Reference Gaskin, Speir, Harris, Das, Lee, Morris and Fisher2010) reported minimal evidence of any changes in plant tissue N concentrations in field experiments by increased N immobilisation due to the application of wood-derived biochar to acid tropical soils. Thus, the nature and scope of biochar effects on soil N dynamics seems to be greatly dependent on the status of soil, microbial community and temperature and moisture conditions during observations.
This study consistently showed decreased nitrate concentrations with increasing biochar application rates, demonstrating the mechanism of a short-term increase in N immobilisation in the temperature and soil moisture conditions of the boreal growing season. Nevertheless, the effects differed between the fertiliser treatments. The net N immobilisation by biochar was highest for the unfertilised control, followed by CCM, and least for MBM. The significant differences between fertilisers for soil mineral N (NH4+and NO3–) contents may be attributable to the different C/N ratios of fertilisers used, as this ratio is known to alter the N mineralisation rate (Brady & Weil Reference Brady, Weil, Brady and Weil2002). The high straw bedding content of the CCM probably increased its C/N ratio 28% higher than that in the unfertilised control soil, and 319% higher than in the MBM.
Following Stevenson & Cole's (Reference Stevenson, Cole, Stevenson and Cole1999) reasoning, the modelling results can be interpreted through the C/N ratios and the decomposability of the material. The high C/N substrates of the non-fertilised and CCM-fertilised soils resulted in a very different pattern of N mobilisation than the low C/N substrate in the MBM-fertilised soil. Both the net mineralisation rate and the cumulative N mineralisation were, as expected, enhanced by the low C/N, easily digestible substrate. The empirical models, even if not explicit about the underlying mechanism, confirm that the N immobilisation caused by biochar application is obviously less harmful to plant nitrogen uptake when low C/N materials, consisting of organic compounds that are easily decomposed by soil organisms, are used as organic fertilisers. In this study, the N mineralisation dynamics could not be fitted with a single model for all fertiliser types with different C/N ratios, although it seems that they could conform to different parts of a single Gompertz-type double exponential function. This will be pursued in a subsequent paper.
Although the differences in NH4+ concentrations were not significantly different between biochar application rates, there was some evidence of initially increased concentrations with increasing biochar application rates in the unfertilised treatment. However, in agreement with the results of Nelson et al. (Reference Nelson, Agudelo, Yuan and Gan2011), the early effects, attributable to reduced nitrification, levelled off after two weeks of incubation. Even though biochar additions have been reported to increase nitrification in acid forest soils (DeLuca et al. Reference DeLuca, MacKenzie, Gundale and Holben2006; Ball et al. Reference Ball, MacKenzie, DeLuca and Holben2010), probably by the inhibition of nitrification by reduced phenol and terpene, there is no evidence of such a mechanism in intensively managed agricultural soils that have relatively active nitrifying communities and that lack the naturally-occurring nitrification inhibitors mitigated by biochar in forest systems (Clough & Condron Reference Clough and Condron2010). Therefore, the initially higher NH4+-N contents with biochar-applied treatments might rather be attributable to volatile organic compounds of biochar that might have been initially inhibiting Nitrosomonas (Clough et al. Reference Clough, Bertram, Ray, Condron, O'Callaghan, Sherlock and Wells2010; Nelson et al. Reference Nelson, Agudelo, Yuan and Gan2011).
The mechanism for reduced NO3– concentrations with increasing amounts of biochar added into soil is more likely attributable to N immobilisation by microbes than to denitrification. The latter is not considered probable, as strongly increased denitrification followed biochar application to wet or moist soils (water contents of more than 83% of water filled pore space (WFPS)), whereas decreased denitrification was recorded at water contents of less than 73% WFPS (Yanai et al. Reference Yanai, Toyota and Ozakaki2007). As the soil water content in the present experiment was maintained at about 45% WFPS, and the soil air-filled porosity was more than 31% by volume during the incubation, we discard the possibility of biochar-induced denitrification as a mechanism for the reductions in NO3– contents in soil, and argue that they are most likely explained by N immobilisation to microbial biomass. As a general rule, the N immobilisation after biochar incorporation is a temporary phenomenon, as part of the C readily available for microbial assimilation is used up after a few months, leaving highly recalcitrant biochar fractions for longer-term microbial interactions (Novak et al. Reference Novak, Busscher, Watts, Laird, Ahmedna and Niandou2010; Nelson et al. Reference Nelson, Agudelo, Yuan and Gan2011; Bruun et al. Reference Bruun, Ambus, Egsgaard and Hauggaard-Nielsen2012). This view was supported also by our experiment, where the reductions in the net N mineralisation from fertilisers started to decrease after two months of incubation, possibly because of the turnover of microbial biomass.
The positive consequence of increased long-term soil C sequestration by biochar amendment is known to be coupled to short-term N immobilisation to soil microbes with increasing application rates (Kolb et al. Reference Kolb, Fermanich and Dornbush2009; Novak et al. Reference Novak, Busscher, Watts, Laird, Ahmedna and Niandou2010; Nelson et al. Reference Nelson, Agudelo, Yuan and Gan2011; Bruun et al. Reference Bruun, Ambus, Egsgaard and Hauggaard-Nielsen2012). Such immobilisation may reduce leaching of N from soil to the environment, but it is also likely to reduce the availability of nitrogen to plants. However, as the initial N immobilisation already started to become smaller two months after the biochar application, the decreases in plant-available N in biochar-amended soils can be expected to be temporary. When biochar is applied together with organic fertilisers, the C/N ratio of fertilisers is of paramount importance, as the duration of N depression increases with an increasing C/N ratio. Hence, in order to avoid N availability problems, biochar could be applied to fallow well before the next growing season in order that the N-immobilisation phase is over before crop growth (Novak et al. Reference Novak, Busscher, Watts, Laird, Ahmedna and Niandou2010, Bruun et al. Reference Bruun, Ambus, Egsgaard and Hauggaard-Nielsen2012).
The effects of biochar on soil N dynamics may differ significantly between biochars according to the raw material and pyrolysis conditions, as these have been shown to affect the stability of biochar carbon (Lu et al. Reference Lu, Sahajwalla and Harris2000; Nguyen et al. Reference Nguyen, Lehmann, Hockaday, Joseph and Masiello2010, Bruun et al. Reference Bruun, Hauggaard-Nielsen, Ibrahim, Egsgaard, Ambus, Jensen and Dam-Johansen2011, Reference Bruun, Ambus, Egsgaard and Hauggaard-Nielsen2012). The stability is reported to increase with an increasing proportion of aromatic-C compounds in the biochar, while the microstructure and nutrient content of biochar may also play a role (Nguyen et al. Reference Nguyen, Lehmann, Hockaday, Joseph and Masiello2010). It is likely that the N immobilisation effect might be even larger for biochars less stable than the approximately 90% aromatic-C content biochar used in our study.
Furthermore, the presence of plant roots and associated soil microbes possibly might result in interactions not evident in laboratory incubations. In order to develop widely applicable functional response models for modelling the effects of biochar on nitrogen mineralisation from organic fertilisers, more data are needed, along with a mechanistic of the effect of the carbon–nitrogen ratio of the fertiliser. Additional research needs to be conducted on the longer-term effects of biochar on N dynamics at larger scales that would include the effects of other biochar, soil, water and plant factors.
4. Conclusions
This study confirms that the effects of added biochar on soil N mineralisation dynamics depends greatly on the C/N ratios of the organic fertiliser applied at the same time. Organic fertilisers with high C/N ratios cause short-term N-availability problems that, however, start decreasing within a few months, whereas the initial N immobilisation caused by biochar application is less significant when low C/N materials such as MBM are used. With suitable timing, biochar additions may effectively prevent leaching of N, especially from uncropped soil, and when biochar is applied, for example, into fallowed soil well before next growing season, the risks of N availability problems during early growth could be minimised. More detailed recommendations on the appropriate timing and application rates remain to be defined by future studies involving longer-term incubations and field experiments with plants.
5. Acknowledgements
The authors thank Mr Sampo Tukiainen (Preseco Oy) and Mr Jukka Kivelä for providing the experimental biochar and fertilisers. Professor Ago Samoson and his team from Tallinn University of Technology and the University of Warwick are gratefully acknowledged for their assistance with NMR analysis. We also thank Ms Johanna Muurinen, Mr Jarkko Hovi and Ms Maria Vähätalo for their assistance with biochar and soil analysis and Mr Ilya Belevich for assistance with the scanning electron microscopy. We are also grateful to Dr Frederick Stoddard, who considerably improved the English language of the manuscript. This research was partially funded by the Jenny and Antti Wihuri Foundation and the Ministry of Agriculture and Forestry of Finland.