Ferroelectric tunnel junctions (FTJs) have attracted attention since the beginning of this century, due to the theoretical and experimental breakthroughs in the understanding of the stability of ferroelectricity and fabrication of ultrathin films, respectively.[Reference Tybell, Ahn and Triscone1–Reference Contreras, Kohlstedt, Poppe, Waser, Buchal and Pertsev5] Essentially, an FTJ consists of two electrodes separated by an ultrathin ferroelectric film with the thickness down to a few unit cells that allow electrons to tunnel through it. In asymmetric FTJs, the polarization state in the ultrathin ferroelectric barrier produces two distinctive resistance values. This is a major distinction from conventional ferroelectric random access memory, which enables promising applications in memory devices in terms of low power, non-destructive readout and the electron transport of direct tunneling. These two characteristics of FTJs, i.e. the quantum-tunneling and the resistance switching, are collectively referred to as the tunneling electroresistance (TER) effect.[Reference Zhuravlev, Sabirianov, Jaswal and Tsymbal4]
One of the most important practical considerations when putting FTJs into use is the magnitude of the TER value, namely the ratio of high resistive state (HRS) to low resistive state (LRS). A large TER ratio permits researchers to have better scalability and achieve high efficiency. Thus significant efforts to enhance TER in FTJs have taken front stage, and indeed much progress has been achieved.[Reference Zhuravlev, Wang, Maekawa and Tsymbal6–Reference Qin, Äkäslompolo, Tuomisto, Yao, Majumdar, Vijayakumar, Casiraghi, Inkinen, Chen, Zugarramurdi, Puska and van Dijken13] One of the approaches to improve TER effect is the development of an FTJ structure with a composite dielectric/ferroelectric barrier.[Reference Zhuravlev, Wang, Maekawa and Tsymbal6, Reference Sun, Wu, Cai and Ju7, Reference Ma, Zhang, Pan, Duan and He14–Reference Wang, Cho, Shin, Kim, Das, Yoon, Chung and Noh18] Efforts focusing on strain engineering, interface engineering, and synaptic plasticity also increased the performance of FTJs and extended their potential applications beyond memory.[Reference Sokolov, Bak, Lu, Li, Tsymbal and Gruverman19–Reference Guo, Zhou, Wu, Wang, Lim, Yan, Lin, Wang, Yoong, Chen, Ariando, Venkatesan, Wang, Chow, Gruverman, Miao, Zhu and Chen27] In Ref. Reference Zhuravlev, Wang, Maekawa and Tsymbal6, the trend of monotonic increase of TER with dielectric or ferroelectric layer thickness was explained by the enhanced asymmetry of the potential energy profile. This abstract description was applied to other FTJs with symmetric electrodes where concrete investigations were also in absence.[Reference Wu, Ju and Li15, Reference Ruan, Qiu, Yuan, Ji, Wang, Li and Wu17] Whilst that laid the foundations of initial understanding of the correlation between TER and asymmetry of FTJs, complications associated with asymmetric electrodes (as may be the practical case) was not dealt with based on data except limited work involved.[Reference Wang, Cho, Shin, Kim, Das, Yoon, Chung and Noh18, Reference Chang, Naeemi, Nikonov and Gruverman28] It means the quantification of the effect of the asymmetry in a typical FTJ is still lacking. Particularly, a focused report devoted to the precise understanding of how structure-property correlations in FTJs with asymmetric electrodes and a dielectric/ferroelectric composite barrier affect performance is yet to be shown. Efforts on this front, therefore, are expected to be conducted to further enhance TER through so-called “structure engineering” method.
Here, we present a computational study that looks deeper into the above shortcomings for composite FTJs with asymmetric electrodes. The focus is on two materials systems in which the former composite barrier has been most experimentally investigated while the latter was rarely involved: Pt/BaTiO3(BTO)/SrTiO3(STO)/SrRuO3(SRO) and Pt/STO/BTO/SRO on STO substrates. The ferroelectric thickness is fixed while the thickness for the dielectric layer is varied from 0 to 36 Å. However, in order to compare and contrast performance, the above two junctions with inverse stacking sequences have the same ferroelectric thicknesses and dielectric thicknesses. The calculated results show that the TER ratio of Pt/STO/BTO/SRO FTJ increases monotonically with STO thickness while that of Pt/BTO/STO/SRO junction decreases first and then increases. An enhanced TER value of 105 orders can be obtained for a thicker STO layer in the case of Pt/STO/BTO/SRO FTJ. As a contrast, the TER is severely degraded by three orders for Pt/BTO/STO/SRO FTJ. Based on the tight correspondence between the tunnel conductance and average barrier height, the structure–property relationship in two FTJs is interpreted by the proposed concept of an asymmetry factor, which is defined as the ratio between the average barrier heights of FTJs for two opposite polarization orientations. A larger asymmetry factor for Pt/STO/BTO/SRO is responsible for the enhanced TER value. The correlation between TER and asymmetry factor is confirmed by the experimental report.[Reference Wang, Cho, Shin, Kim, Das, Yoon, Chung and Noh18] Our studies may pave a way to enhance the performance of FTJs by structure engineering.
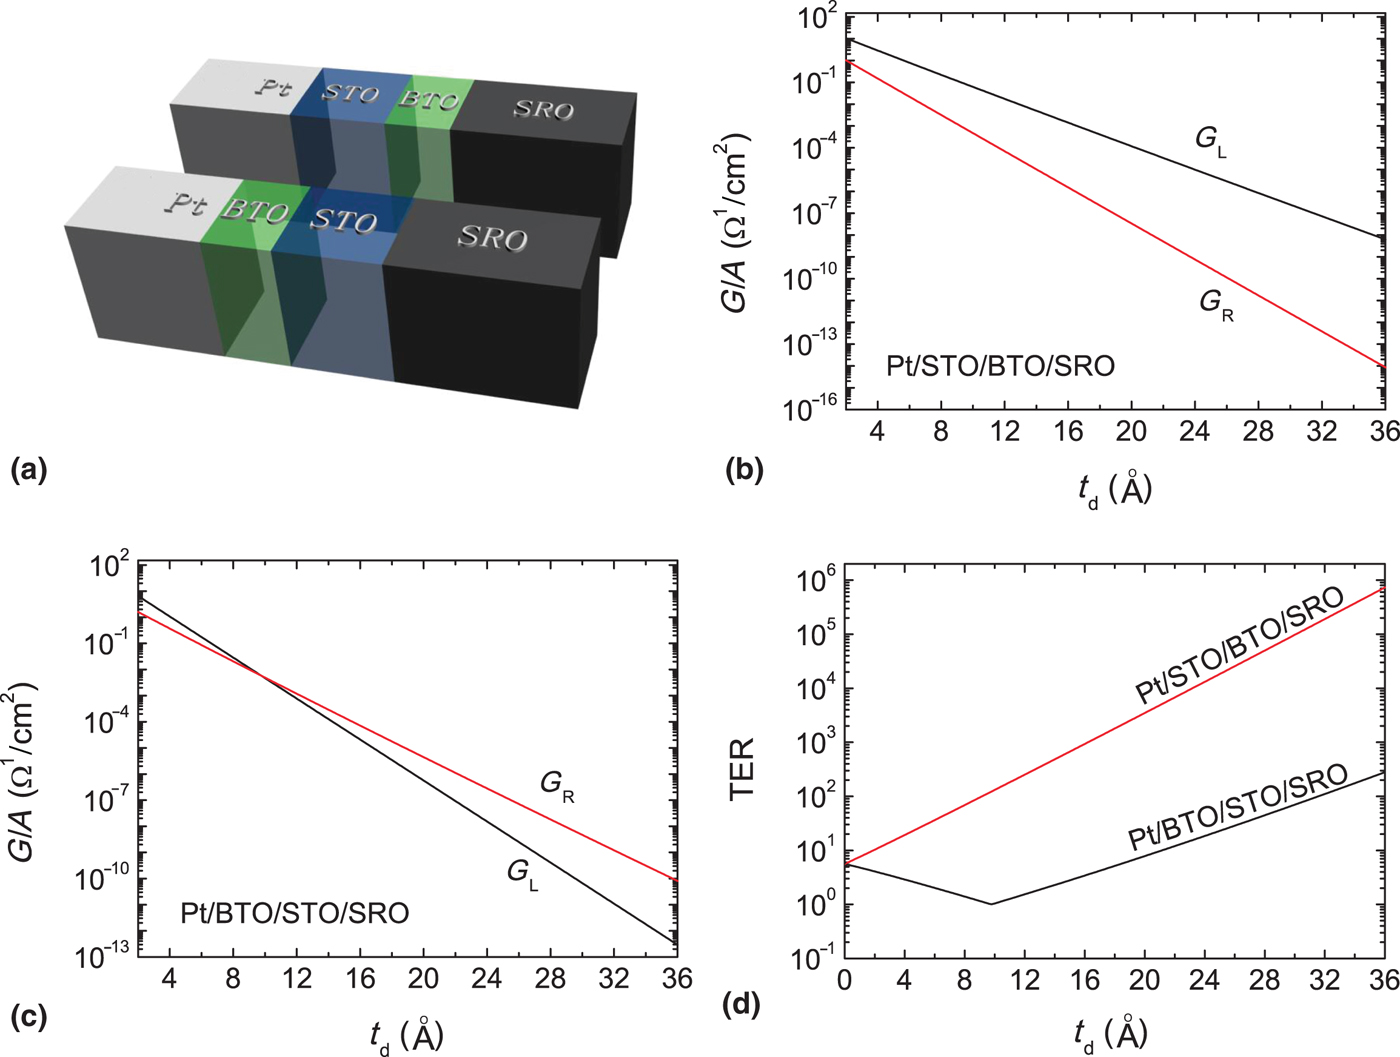
The structure of Pt/STO/BTO/SRO is sketched in Fig. 1(a); inverting the stacking sequence yields the structure Pt/BTO/STO/SRO. The dielectric and ferroelectric layers are assumed to be perfectly insulating and the latter is uniformly polarized in the z-direction perpendicular to the electrodes xy-planes. Assuming a Thomas-Fermi model of screening and imposing short-circuit boundary conditions,[Reference Ashcroft and Mermin29] the screening charge density in Pt electrode thus can be given from the continuity of the electrostatic potential:
 $$\sigma _s = \displaystyle{{t_f/\varepsilon _f} \over {\delta _1/\varepsilon _{e1} + \delta _2/\varepsilon _{e2} + t_f/\varepsilon _f + t_d/\varepsilon _d}}P.$$
here t f(t d) is the ferroelectric (dielectric) thickness and ε f (ε d) is the permittivity of the ferroelectric (dielectric). δ 1 is the screening length and ε e1 the dielectric constant of Pt electrode, and δ 2 is the screening length and ε e2 the dielectric constant of the SRO electrode. The depolarizing fields in the dielectrics (E d) and in the ferroelectrics (E f) are given by
 $$\eqalign{& E_d = \displaystyle{{\sigma _s} \over {\varepsilon _d}} \cr & E_f = -\displaystyle{{\sigma _s} \over d}(\delta _1/\varepsilon _{e1} + \delta _2/\varepsilon _{e2} + d_1/\varepsilon _d).} $$
Sketches of Pt/STO/BTO/SRO and Pt/BTO/STO/SRO FTJs (a). (b) and (c) show the conductance as a function of the thickness of STO for FTJ with a STO/BTO composite barrier and for FTJ with a BTO/STO composite barrier, respectively. (d) TER ratio as a function of the dielectric thickness of STO for the two structures. t f = 2.4 nm. P = 18 µC/cm2.

Positive (negative) values for E f, E d, and P mean that the electric field and polarization point to the right (left).
The potential energy profile seen by the tunneling electrons is variant in the z-direction and is a superposition of the contributions from the conduction band bottom of the composite barrier, spontaneous polarization in the ferroelectric layer, induced polarization in the non-polar dielectric layer and the screening charges in the electrodes. Employing a free-electron model to describe the direct electron tunneling, the conductance of an FTJ per unit area can be obtained by Landauer formula,[Reference Duke30]
 $$G = \displaystyle{{2e^2} \over h}\int {\displaystyle{{d^2k_{ \vert \vert}} \over {{(2\pi )}^2}}T(E_F,k_{ \vert \vert} )}, $$
where T(E F, k ||) is the transmission coefficient evaluated at the Fermi energy E F for a given value of the transverse wave vector k ||. The transmission coefficient can be numerically obtained by solving the Schrödinger equation for an electron moving in the potential U(z) using a transfer matrix formalism. For simplifying the calculation, it is assumed that the electron has a free electron mass throughout the FTJs.
Figures 1(b) and 1(c) show the calculated conductance per unit area of the FTJs for the two composite barriers, respectively, from Fig. 1(a) as a function of the dielectric thickness t d, respectively. G L and G R represent the conductance for polarization pointing to the left and to the right, respectively. The fixed at BTO is 24 Å in thickness (~6-unit cells) and the polarization is taken as P = 18 μC/cm2 based on the first-principle calculations.[Reference Cai, Zheng, Ma and Woo31] Other parameters are: δ 1 = 0.45 Å, δ 2 = 0.8 Å, ε e1 = 2ε 0, ε e2 = 8.45ε 0, ε f = 90ε 0, ε d = 300ε 0 (where ε 0 = vacuum dielectric constant), E F = 3 eV and U d = U f =0.6 eV. All these parameters can be found in Refs. Reference Zhuravlev, Wang, Maekawa and Tsymbal6 and Reference Kim, Jo, Kim, Chang, Lee, Jong-Gul Yoon, Song and Noh32, and here E F denotes the Fermi level while U d and U f denote the barrier heights for STO and for BTO, respectively. The conductance for each polarization direction in both structures has an overall downward trend with the increase of STO thickness. However, for the BTO/STO composite barrier, as shown in Fig. 1(c), the conductance for opposite directions cross at t d = 9.8 Å. Such a crossing has not been seen in FTJs with a ferroelectric/dielectric composite layer previously.
Figure 1(d) shows the dielectric-thickness dependence of TER ratio for FTJs with a STO/BTO and a BTO/STO composite layer (red and black TER-t d curves, respectively). The TER ratio is defined as TER = Max (G L, G R)/Min (G L, G R) here, considering the cross of conductance shown in Fig. 1(c). It is seen from Fig. 1(d) that the TER increases exponentially with dielectric thickness for the FTJ with a STO/BTO composite layer and a large TER as large as 105 can be obtained, as STO is thicker than 30.1 Å. By contrast, an obvious smaller TER degraded by three orders is observed for the FTJ with a BTO/STO composite layer as STO is thicker than 23.2 Å. Note the inflection point t i, which corresponds to the t d = 9.8 Å crossing discussed previously in Fig. 1(c). For t d less than t i, TER exhibits a downward trend by increasing the dielectric thickness. At the inflection point t i, TER = 1 and the HRS and LRS cannot be distinguished. These results indicate that the TER effect of FTJs with asymmetric electrodes and a composite barrier is more profound than FTJs with a single ferroelectric barrier and composite FTJs with symmetric electrodes.
To explain this strong dependence not only on the stacking sequence correlations but also the electrode asymmetry, it is important to study the potential energy profiles in these composite FTJs, since conductance is determined by the transmission coefficient whereas the latter is strongly dependent on the potential energy profile. An effective way is to compare the average barrier heights across the FTJs for two opposite polarization orientations. In Fig. 1(a), the potentials at the left Pt/STO(BTO) interface φ l and at the right BTO(STO)/SRO interface φ r are given by φ l = −σ sδ 1/ε e1 and φ r = σ sδ 2/ε e2, respectively, which are not dependent on the stacking sequence of the composite layer. However, the potential at ferroelectric/dielectric interface depends on the stacking sequence. It is given by φ Seq1 = φ l − E dt d for Pt/STO/BTO/SRO and alters to φ Seq2 = φ l − E ft f for Pt/BTO/STO/SRO. For an FTJ with a composite barrier consisting of multiple layers of thin films, the total average barrier height may be defined as
 $$\bar{U} = \displaystyle{{\sum {{\bar{U}}_it_i}} \over {\sum {t_i}}}, $$
with t i and  $\bar{U}_i$ being the thickness and average barrier height of the ith layer, respectively. Then, for Pt/STO/BTO/SRO FTJ, the total average barrier height is
 $$\eqalign{\bar{U} =\;& \left( {-\displaystyle{{\varphi_l + \varphi_{Seq1}} \over 2} + U_d} \right)\displaystyle{{t_d} \over {t_d + t_f}} \cr & + \left( {-\displaystyle{{\varphi_{Seq1} + \varphi_r} \over 2} + U_f} \right)\displaystyle{{t_f} \over {t_d + t_f}}.} $$
And the total average barrier height for Pt/BTO/STO/SRO FTJ is given by
 $$\eqalign{\bar{U} &= \left( {-\displaystyle{{\varphi_l + \varphi_{Seq2}} \over 2} + U_f} \right)\displaystyle{{t_f} \over {t_d + t_f}} \cr & \quad+ \left( {-\displaystyle{{\varphi_{Seq2} + \varphi_r} \over 2} + U_d} \right)\displaystyle{{t_d} \over {t_d + t_f}}.} $$
Here the potential is expressed in V and potential energy is in eV. Figure 2 shows the calculated total average barrier heights as a function of the dielectric thickness for the two kinds of composite FTJs, where  $\bar{U}_L$ and
 $\bar{U}_R$ are the values for polarization pointing to the left and to the right, respectively. It can be seen that
 $\bar{U}_L$ decreases with t d while
 $\bar{U}_R$ demonstrates the opposite trend for the FTJ with a STO/BTO barrier [Fig. 2(a)]. An exchange of STO and BTO, however, comes to completely opposite conclusions, as shown in Fig. 2(b). Moreover, a crossing at t d = 10.3 Å is observed, which is very close to the cross point in Fig. 1(c) and an inflection point in Fig. 1(d). Since
 $\bar{U}_L = \bar{U}_R$ at the cross point, there should be G L = G R and resultant TER = 1. This deduction is consistent with previous results at the cross t d = 9.8 Å. Indeed we can recall that at the cross point the FTJ is “symmetric” so that TER = 1. On the other hand, the potential energy profiles of FTJs could also reveal how the TER is improved when STO is inserted into different interfaces. As plotted in Figs. 2(c) and 2(d), U L and U R represent the tunneling barriers of the two kinds of FTJs for polarization pointing to the left and to the right, respectively. For the convenience of comparison, STO thickness is set to the same as BTO of 24 Å and all potential energy profiles are replotted in Fig. 2(e). One can find the difference in barrier height of Pt/STO/BTO/SRO FTJ for two opposite polarization orientations larger than that of Pt/BTO/STO/SRO FTJ, indicating that the former structure reasonably has a larger TER value than the latter.
Average barrier heights as a function of the dielectric thickness of STO for FTJ with a STO/BTO composite barrier (a) and for FTJ with a BTO/STO composite barrier (b). (c) and (d) show the energy band diagrams of Pt/STO (24 Å)/BTO (24 Å)/SRO and Pt/BTO (24 Å)/STO (24 Å)/SRO FTJs, respectively. (e) results from (c) overlaying with (d) for comparison. Horizontal and vertical dashed lines represent Fermi energy and STO (BTO)/BTO (STO) interfaces, respectively.

Based on this, we can use the difference between  $\bar{U}_L$ and
 $\bar{U}_R$ to quantify the asymmetry of the potential energy profile of FTJs. We define it as the asymmetric factor
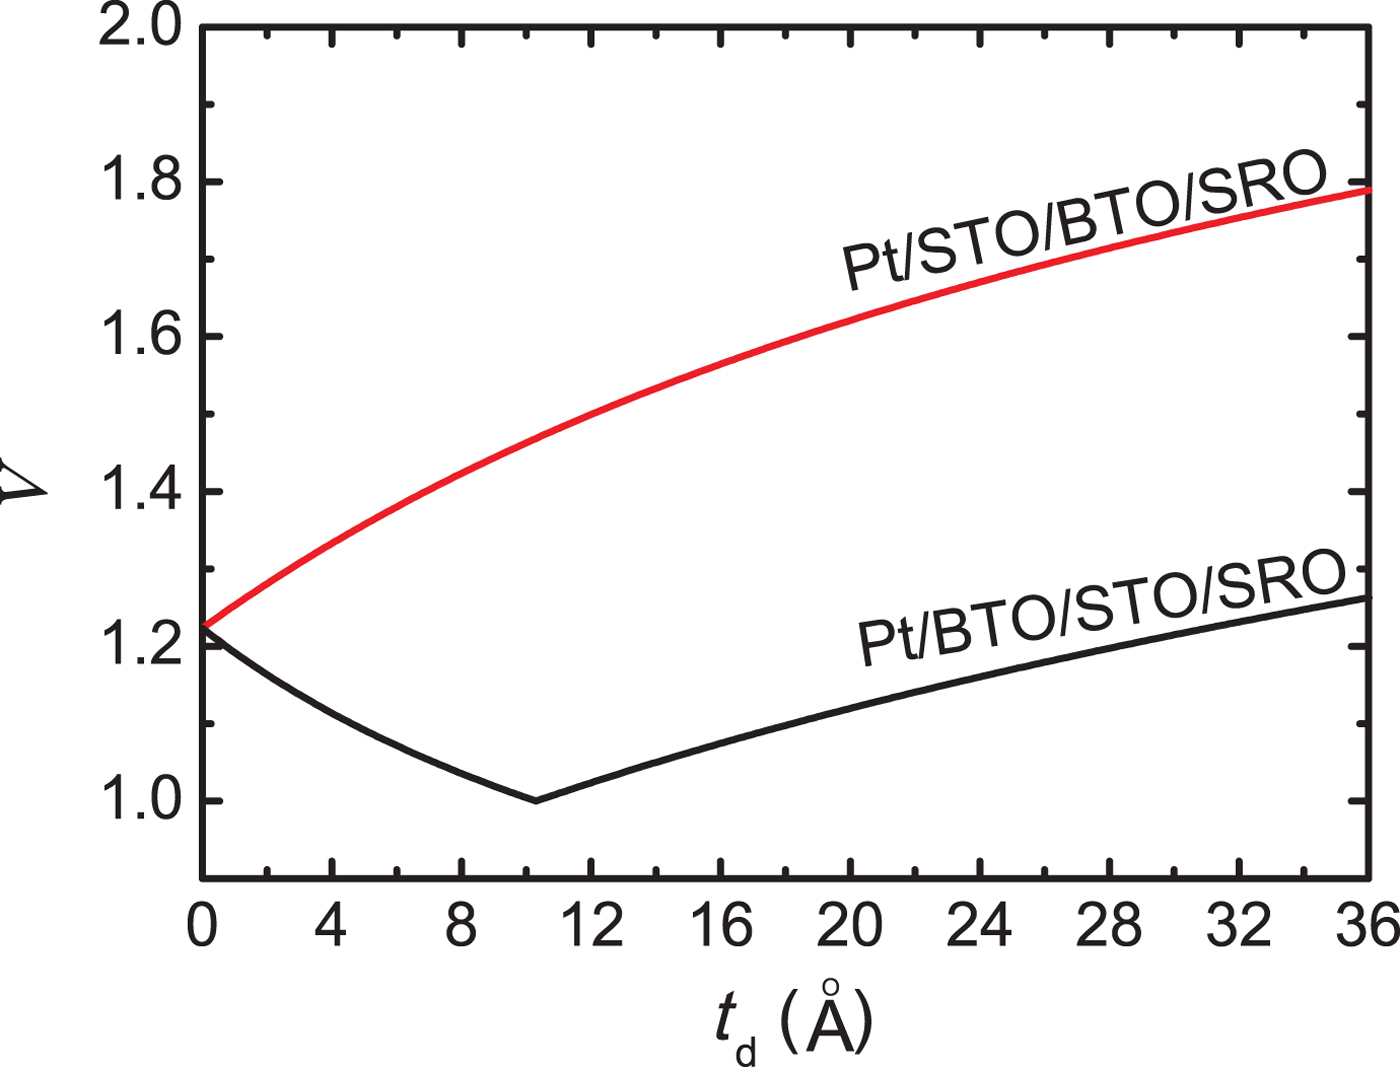
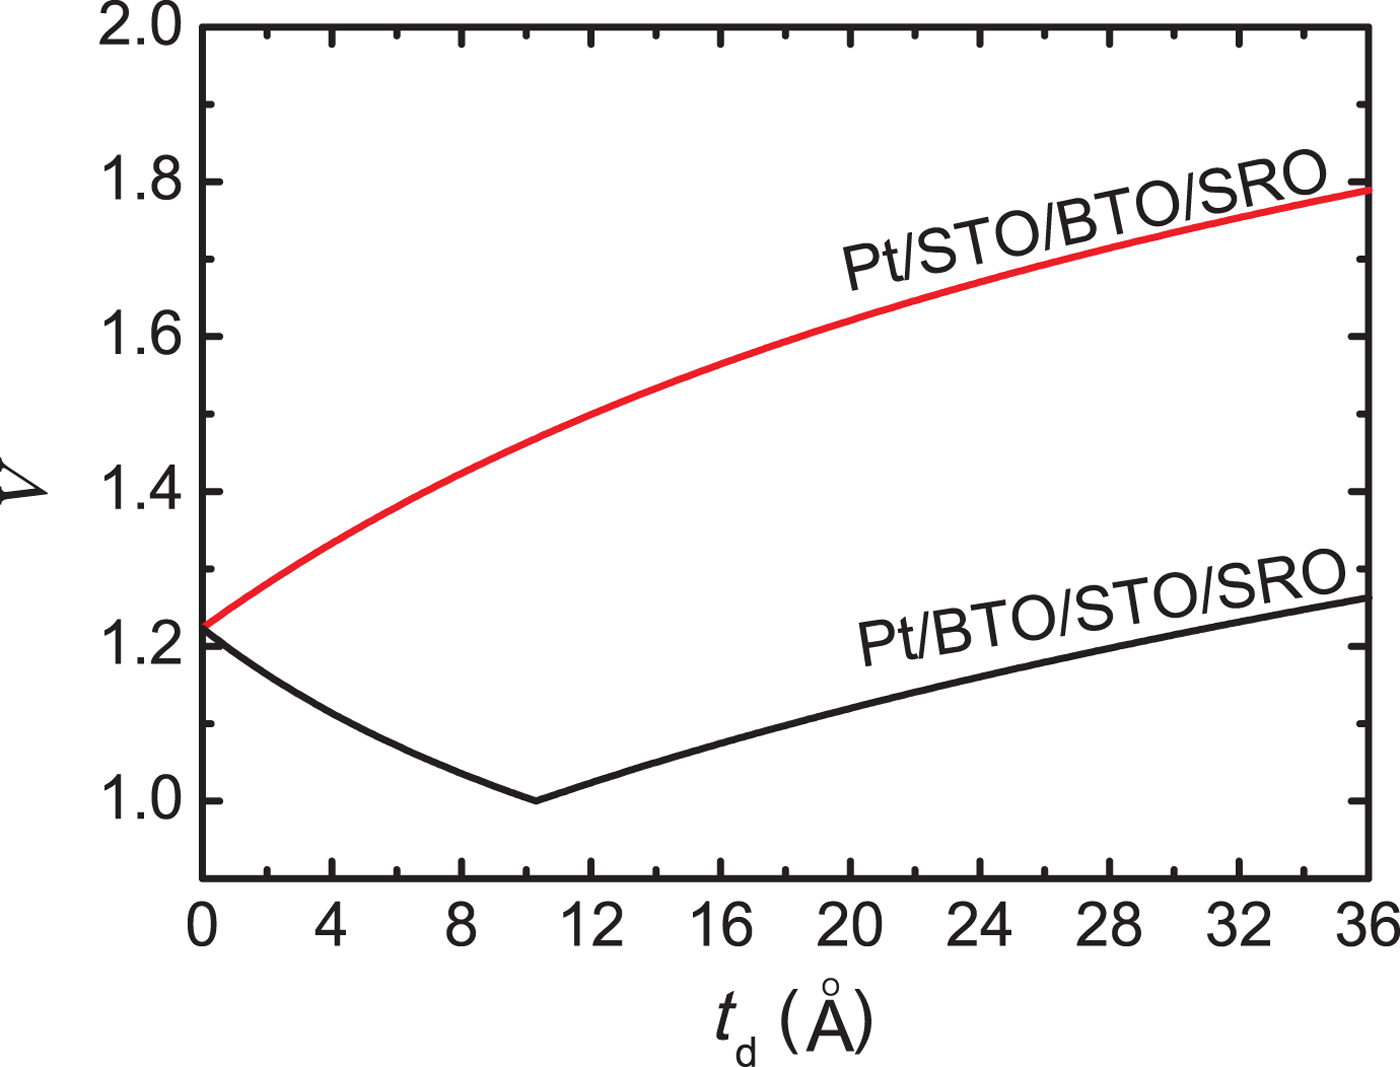
 $\Lambda = \max (\bar{U}_L,\bar{U}_R)/\min (\bar{U}_L,\bar{U}_R)$. This is significant as it is a method to quantify the role of asymmetry, which has been lacking thus far. The larger the asymmetric factor, the larger is the TER ratio. Indeed, as is shown in Fig. 3, Pt/STO/BTO/SRO FTJ (red Λ − t d curve) has a much larger asymmetric factor than Pt/BTO/STO/SRO (black Λ − t d curve). For example, as STO is 20 Å thick, the asymmetric factors for Pt/STO/BTO/SRO and Pt/BTO/STO/SRO FTJs are 1.62 and 1.12, respectively. The corresponding TER values are 3484 and 8, respectively; as STO thickness is increased to 36 Å, the asymmetric factors increase to 1.79 and to 1.26, respectively, and the corresponding TER is enhanced to 7.3 × 10⁵ and to 280, respectively. Especially, the Λ − t d curve of Pt/BTO/STO/SRO junction decreases first and then increases with an inflection point at t d = 10.3 Å, very much like the TER-t d curve in Fig. 1(d). Therefore, it can be concluded that it is the large asymmetric factor that yields the large TER effect in Pt/STO/BTO/SRO FTJ. Note that both ferroelectric polarizations for 24 Å-thick BTO films in the composite FTJs are taken as 18 µC/cm2 from Ref. Reference Cai, Zheng, Ma and Woo31. Inverting the sequence of the dielectric and ferroelectric layers should affect the ferroelectricity of BTO film due to the variation of mechanical boundaries. However, the Pt/BTO/STO/SRO FTJ still exhibits a degraded performance and even BTO film in it has a large polarization strength equal to the bulk value of 26 µC/cm2, as compared with the Pt/STO/BTO/SRO FTJ in which the ferroelectric polarization of BTO is assumed to 18 µC/cm2 (Supplementary Material, Fig. S1). This also can be ascribed to the smaller asymmetric factor for Pt/BTO/STO/SRO FTJ. These results may stimulate us to turn from asymmetric FTJs with BTO/STO composite barriers to those with STO/BTO ones in future experimental work.
Asymmetric factor as a function of the dielectric thickness of STO for FTJ with a STO/BTO composite barrier (red Λ − t d curve) and for FTJ with a BTO/STO composite barrier (black Λ − t d curve).
We note a quantity called the effective contact ratio, defined as δ 1ε e2/δ 2ε e1 to distinguish the high/low resistance states in FTJs,[Reference Chang, Naeemi, Nikonov and Gruverman28] similar to the concept of an asymmetric factor in this work. It is seen that the effective contact ratio only depends on the properties of the electrodes and thus it can only quantify the asymmetry of an FTJ with a single barrier (as the electrodes are replaced). The effective contact ratio might not work in most cases when FTJs with a composite barrier are involved because of the complications associated with the stacking sequence as well as the thickness distribution of the barrier. The asymmetric factor, however, can also suit composite-barrier FTJs. To prove the validity of this work, the asymmetric factors of Ti/BTO/STO/SRO FTJs at zero biased voltage in Ref. Reference Wang, Cho, Shin, Kim, Das, Yoon, Chung and Noh18 were calculated. The screening length of Ti is taken as 0.053 Å and the dielectric constant is taken as 8.Footnote 1 Other calculation parameters are the same as those in previous FTJs with Pt top electrodes while considering the size effect of ferroelectricity (see Supplementary Material). The calculated asymmetric factor and experimental TER as a function of BTO thickness are plotted in Fig. 4. As the total barrier thickness is fixed to 10 u.c., the asymmetric factor and TER show the same trends. What is more, the larger the asymmetric factor, the larger the TER, which consists previous result. The FTJ with BTO (6 u.c.)/STO (4 u.c.) composite structure has the largest asymmetric factor, corresponding to the largest TER experimentally. It should be emphasized that this could be a theoretical work prior to experiments. In this sense, this work can support the experimental results on one hand. On the other hand, more importantly, it is helpful to guide experimental work by the prediction function.
Asymmetric factor and experimental TER as a function of BTO thickness for Ti/BTO/STO/SRO FTJs where the total barrier thickness is fixed to 10 u.c. in Ref. Reference Wang, Cho, Shin, Kim, Das, Yoon, Chung and Noh18. TER data are adopted from the supplementary material of Ref. Reference Wang, Cho, Shin, Kim, Das, Yoon, Chung and Noh18.

In conclusion, the TER effect in FTJs with asymmetric electrodes and a composite barrier are investigated. It is shown that the properties of the FTJs are strongly influenced by the relative position of the ferroelectric and dielectric layers. Inverting the sequence of the dielectric and ferroelectric layers may sharply change the TER ratio. This structure–property relationship is explained in terms of an asymmetric factor. A large asymmetric factor is advantageous for FTJs and can be responsible for the observed large TER effect. Our results shine further light on how the performance of FTJs can be enhanced using atomic structure engineering and are believed to have import reference value for the design of FTJs with optimal structures.
Supplementary material
The supplementary material for this article can be found at https://doi.org/10.1557/mrc.2018.212.
Acknowledgments
This work was supported by the National Natural Science Foundation of China (Grant Nos. 11574073 and 51472037). Nagarajan Valanoor acknowledges support from ARC Discovery Project and BAYU Overseas Talent Plan 2016.