

Introduction
Systematic measurement of public demand – that is, the aggregate of what individuals in a given society prefer or want – plays an important role in most political systems, most of all in democratic political systems, where the political survival of members of parliament and government depends on electoral support. This makes accurate measurement of public demand important, both from the perspective of policymakers and the public. In this article, we propose an alternative way to measure public demand when survey data are not available. We add to the debate of measuring public demand by providing comparisons with established demand measures.
Besides the aforementioned normative and political considerations, measurement of public demand is also important from an academic viewpoint. Standard theories of democratic policymaking argue that, some principal-agent problems notwithstanding, political decisionmakers generally supply public policies demanded by the median voter and/or pivotal interest groups. As Dahl noted, “A key characteristic of democracy is the continued responsiveness of the government to the preferences of the people”(Reference Dahl1971, 1). The supply side of policymaking is, in most cases, quite easily observable in empirical research. That is, researchers can study statements of policymakers (e.g. in parliament or public speeches) and they can observe and code political decisions that are taken, as well as the related policy output (e.g. new laws, regulations and government spending).
The demand side is more difficult to observe and measure independently from policy supply (policy output) and is arguably more complex from a conceptual perspective. In our view, very well-designed public opinion surveys can serve as the “gold standard” for measuring public demand in particular policy areas. Although many surveys nowadays meet such standards, the most important shortcoming concerns the availability and commensurability of data.Footnote 1 Because of high costs and changing research interests, public opinion survey data in virtually any area of public policy are largely incomplete. That is, they provide snapshots of public opinion at specific points in time within one, or at best in a few, countries. “Stitching” together different survey data sets is in some cases possible, but remains highly problematic (see further below) – for example, because of differences across surveys in design and item wording.Footnote 2 Most fundamentally, however, filling gaps ex post is impossible.
In modern democracies, however, the media system acts as an important intermediary between citizens and policymakers. It provides a platform on which stakeholders voice and spread their views and demands, and where citizens obtain information on policy-relevant societal problems and possible solutions. “[C]ivic initiatives and social movements can influence policymakers only if they are able to achieve visibility in the mass media” (Koopmans Reference Koopmans2007, 184). Likewise, politicians use media reporting to gauge the public mood regarding specific policy issues (Herbst Reference Herbst1993; Powlick Reference Powlick1995; Mutz Reference Mutz1998), because they face the same problem of nonavailability or other limitations of survey data (Jacobs and Shapiro Reference Jacobs and Shapiro2000). This makes media content a valuable information source for measuring public demand, both in terms of assessing public opinion and in establishing the saliency of a particular issue. We propose that, especially by excluding statements from government officials and concentrating on claims made by nongovernmental actors, media content analysis can serve as a valid proxy in trying to measure general public demand when it is impossible to rely on commensurable data from public opinion or stakeholder surveys across time and space.
Our objective in measuring public demand is to ultimately test the influence demand has on policymaking. However, to build explanatory models for the supply side, we first need better measures of crosscountry variation on the demand side. To this end, we need to focus on the component of demand that is actually public, meaning that it can be observed by politicians. Media reporting fulfils this requirement, as it is observable for politicians on a regular basis. Even though opinions reflected in media discourse might be elite driven, we argue that politicians have limited time and resources to actually poll people regularly on different issues, and thus have to rely on the daily media discourse as a proxy for public opinion.
In this article, we argue that media content analysis can provide us with a useful measurement of public demand when it is impossible to measure it via public opinion surveys. We then assess whether our media-based measures can serve as valid proxies for public demand. Our substantive focus in this article lies in the measurement of demand for climate change policy. Future research could then use the new demand measure to explain the supply of climate policies across countries.
We chose climate change, which is a moderate-to-low salience topic in most countries (relative to other policy issues on national agendas) within our time period of analysis (1995–2010). Climate change is a rather new issue on most governments’ agendas and, in surveys on what people consider the most important problem (MIP) of their respective countries, it is usually not placed very high up on the list. Furthermore, climate change issues do not, in most countries, play a prominent role in electoral competition. As a consequence, measuring public demand concerning this issue via survey data is even more challenging, given that adequate survey data are scarcer, compared with higher-salience issues such as welfare state or taxation policy. More salient issues have been standard items in public opinion surveys for a long time (Burstein 2003). However, scholars such as Burstein (2003, 2006) argue that, for example, studies on the responsiveness of government to public demand may suffer from confirmatory biases if they are based solely on items in public opinion surveys that by design overwhelmingly ask questions about highly salient topics. We thus add to the literature by introducing media content analysis as a way to measure public demand also for low- or medium-salience issues.
We first introduce new data on political claims presented in the media for or against climate policy in the time period between 1995 and 2010. We then examine whether such data can serve as a useful proxy for public demand in this policy area.
Although our new media-based data set covers six countries so far, we restrict detailed comparison to the US, and corroborate our results for two more countries, Spain and Germany.Footnote 3
The US is the only country for which public demand measures for climate change policy exist from three alternative sources, which allows for a systematic comparison over time. These alternative sources are opinion surveys whose data were combined using a method developed by Stimson (Reference Stimson1999) to measure the policy mood- the climate change threat index (CCTI), Gallup’s MIP question and data from Google Trends measuring internet searches. Comparison of our new claims data with survey data and Google Trends data on climate change shows that media analysis can serve as a valid proxy for most aspects of public demand. Finally, to increase confidence in the generalisability of our measurement approach, we offer a further comparison of our claims data with survey data, although with less detailed questions targeted at climate change, and Google Trends data for two more countries – Germany and Spain.
The remainder of this article is structured as follows. In the next section, we discuss in more detail the relevance of public demand for policymaking as well as previously used demand measures. We then discuss our concept and our operationalisation of public demand. After a presentation and discussion of established demand measures, we compare them with our demand measures in the following section. We subsequently present a further reliability check, focussing on data from two more countries, Germany and Spain. We end with an outlook on how our approach and the resulting data can be used to measure public demand.
Public demand and politics
Theoretically, public policy scholars hold different views on which “workhorse” models of public policymaking offer more robust explanations of policy choices. Those models differ significantly in terms of what types of demand are most relevant. On the one hand, the median voter model (Downs Reference Downs1957) presumes that voters have single-peaked preferences and public demand can somehow be aggregated into a single dimension, and that the voter in the middle of an observable distribution is at the centre of attention from the policymakers’ perspective. On the other hand, interest group models agree that the median voter matters, but they also claim that in many cases interest groups facing large and concentrated opportunity costs and/or benefits are easier to organise and are likely to fight harder to get what they want, relative to more latent interests in society(Olson Reference Olson1965; Persson and Tabellini Reference Persson and Tabellini2002). Empirically, these two basic models of democratic policymaking have different implications for the classical measurement of demand for policies. In the following sections, we will introduce classical measurements of different facets of demand and briefly elaborate on their main advantages or shortcomings.
Scholars seeking to explain policy choices from an interest group perspective usually engage in stakeholder surveys. Such surveys measure the preferences of stakeholders (e.g. interest groups), their position within policymaking networks and their self- or other-assessed influence on public policy (Fisher et al. Reference Fisher, Leifeld and Iwaki2012). Scholars seeking to explain policy choices from a median voter model perspective tend to rely either on simple structural proxies, on public opinion survey data or – more recently – on internet search data.
With respect to structural proxies for public demand, in studies on environmental policies, many scholars rely on Gross Domestic Product (GDP) per capita, arguing that at low levels of income people prefer economic growth over environmental protection and that, at some point, this trend reverses and people demand more postmaterial goods such as environmental protection (Dasgupta et al. Reference Dasgupta, Laplante, Wang and Wheeler2002; Bättig and Bernauer Reference Bättig and Bernauer2009; Spilker Reference Spilker2011; Kim and Wolinsky-Nahmias Reference Kim and Wolinsky-Nahmias2014). Similarly, levels of democracy are presumed to be associated with stronger public demand for environmental public goods provision (Neumayer Reference Neumayer2002; Bättig and Bernauer Reference Bättig and Bernauer2009). Other studies have used environmental Non-governmental organization (NGO) density (Bernauer et al. Reference Bernauer, Kalbhenn, Koubi and Spilker2010), NGO counts (Frank Reference Frank1999; Fredriksson and Millimet Reference Fredriksson and Millimet2004; Roberts et al. Reference Roberts, Parks and Vásquez2004) and share of green parties in the legislature (Neumayer Reference Neumayer2003) as proxies for public demand.
However, to explain policy output in many countries over time, we are in need of more direct measures of public demand without having to rely, for instance, on the assumption that the theoretical linkages stipulated by the environmental Kuznets curve (Dasgupta et al. Reference Dasgupta, Laplante, Wang and Wheeler2002; Bernauer and Schaffer Reference Bernauer and Schaffer2012) hold true.
As stated before, well-designed and executed public opinion surveys can be regarded as the gold standard when seeking to capture public demand. Thus, the fact that public opinion is measured directly from the source is the main advantage of public opinion surveys. However, the main problem with existing survey data is that they fail to provide consistent time series data for longer periods and that they do not fully cover the various dimensions of policy problems. These limitations exist even more for questions regarding climate change policy. Although the issue has gained some prominence for the latter part of the time period and for advanced industrialised countries (with extensive survey activity particularly in the US), it still cannot be compared with more salient topics such as pensions or the welfare state in general.
Internet searches
Increasing use of the internet is generating enormous amounts of metadata. Such data, to the extent that they are accessible, can be used to infer the salience of specific policy issues. Google Trends provides data on web searches for all search terms that pass a minimum threshold of requests (Google 2014). The Google Trends data are available for most industrialised countries from 2004 onwards. We use such search request information for the terms global warming and climate change to obtain a proxy for the saliency of the climate change issue.
Data provided by Google Trends are increasingly being used for research (Kahn and Kotchen Reference Kahn and Kotchen2011; Scharkow and Vogelgesang Reference Scharkow and Vogelgesang2011; Choi and Varian Reference Choi and Varian2012; Pelc Reference Pelc2013). It directly measures information-seeking behaviour in the field (Scharkow and Vogelgesang Reference Scharkow and Vogelgesang2011, 106). For instance, Kahn and Kotchen (Reference Kahn and Kotchen2011) find that higher unemployment led to fewer Google searches for “global warming” and more searches on “unemployment”. This result suggests a crowding-out effect, meaning that people are either interested in climate change or unemployment, but not both at the same time.
Some preliminary comparisons of Google Trends, news reporting and survey data have already been undertaken. Mellon (Reference Mellon2014) examines the relationship between Google searches and survey results. He examines whether Google Trends data can act as a proxy for the salience of seven issues, in comparison with survey responses to the MIP item of Gallup. For four of the seven issues, the Google search data and the Gallup survey data correlate significantly. Ripberger (Reference Ripberger2011) compares news coverage of global warming, terrorism and healthcare in the New York Times with Google searches. He finds that Google searches Granger cause the media reporting, and, when turned around, media reporting also Granger causes Google searches for two of the three issues.
In this article, we therefore propose to use media content analysis to measure general public demand when it is impossible to rely on data from these more traditional measures (public opinion, stakeholder surveys or internet searches). Furthermore, besides reasons of availability, we are also convinced that media reporting data can combine the two theoretical perspectives (interest group and median voter) and help us learn more about public demand for particular policies within a country. In the next section, we take a look at the relationship between media, public demand and policymakers.
Public demand and the media
Often, the relationship between politics, the media and the public is depicted using a triangle (Bernauer et al. Reference Bernauer, Jahn, Kuhn and Walter2014). We follow this notion with our assumption that direct interactions between public and politics can happen, but that most of the interactions happen indirectly through an intermediary actor – the media. On the one hand, the media reflects viewpoints of politicians and parties in the form of interviews and reports, and, on the other hand, also channels the interests of ordinary citizens and other nonstate actors.
Organised interest groups often make their demands public in a way that ensures media attention (e.g. the animal protection organisation People for the Ethical Treatment of Animals (PETA) uses naked celebrities to raise awareness on the issue of fur). Newspapers give their (average) readers space to express opinions in the form of letters to the editor and other commentary sections. In addition, all media outlets provide some form of “comment”, where journalists give their personal opinion on relevant topics. Thus, the media presents a rich and multifarious sample of opinions and demands. In this study, we build on this in order to create our proxy for the general public demand on a particular topic.
The scholarly community on media effects thus scrutinises one direction of the aforementioned triangle: the effect of media on public opinion. With regard to demand, however, media studies have traditionally emphasised the salience component of public demand (Weingart et al. Reference Weingart, Engels and Pansegrau2000; Brossard et al. Reference Brossard, Shanahan and McComas2004; Carvalho and Burgess Reference Carvalho and Burgess2005; Boykoff Reference Boykoff2007; Boykoff and Mansfield Reference Boykoff and Mansfield2008; Ahchong and Dodds Reference Ahchong and Dodds2012; Schmidt et al. Reference Schmidt, Ivanova and Schäfer2013). Studies on media impact, for instance, agenda-setting theory (McCombs and Shaw Reference McCombs and Shaw1972; McLeod et al. Reference McLeod, Becker and Byrnes1974), argue that one principal role of the media is to communicate to people what topics to think about. Empirically, salience is usually measured by frequency of reporting and placement (Andrewsa and Caren Reference Andrewsa and Caren2010).
Although salience is relatively easy to measure empirically and quite uncontroversial at the conceptual level, the concept of opinion is more challenging. Proponents of agenda-setting theory postulate that the media shapes what issues people think about, but that it does not necessarily have a strong influence on their opinions per se. Other media researchers such as Zaller (Reference Zaller1992) argue, however, that the media actually influence public opinion. Krosnick et al., for instance, note that “media coverage sometimes increases national seriousness assessments by altering existence beliefs, sometimes by conferring knowledge and thereby increasing certainty, or sometimes by altering people’s perceptions of a phenomenon’s consequences” (Reference Krosnick, Holbrook, Lowe and Visser2006, Reference Habel36). With respect to our substantive issue interest – climate change policy – some studies show that media usage positively affects knowledge and awareness on several aspects of climate change (e.g. causes, possible solutions, see Stamm et al. Reference Stamm, Clark and Eblacas2000; Krosnick et al. Reference Krosnick, Holbrook, Lowe and Visser2006; Zhao Reference Zhao2009). Several studies find evidence for effects of media content on public opinion (Gamson and Modigliani Reference Gamson and Modigliani1989; Vliegenthart et al. Reference Vliegenthart, Schuck, Boomgaarden and De Vreese2008; Sampei and Aoyagi-Usui Reference Sampei and Aoyagi-Usui2009). For example, Vliegenthart et al. (Reference Vliegenthart, Schuck, Boomgaarden and De Vreese2008), in a study covering nine countries, find that media reporting that highlights benefits is positively correlated with support for the European Union (as measured by surveys), and reporting on contested issues is negatively correlated with support. Overall, this research shows that published opinion, the aggregate of opinions represented in the media, and public opinion, as measured by surveys, are not identical.
This comes as no surprise given our above-mentioned arguments that media reporting also reflects claims and opinions of interest groups and not solely the general public. However, by affecting knowledge and awareness, the two phenomena (published opinion and public opinion) arguably are related, and thus, for our purposes, to find a general demand measure that can ultimately serve to explain policymaking, the multifarious published opinion is more relevant than the survey-based public opinion. Moreover, as the omnipresent published opinion is (compared with opinion polling) rather easily available, we claim that this demand measure is likely to be observed closely by policymakers (Herbst Reference Herbst1998).
Even though it remains unclear how much direct influence the media has on public opinion (Habel Reference Habel2012; Lee Reference Lee2014), most researchers agree that at least indirect effects exist. One such indirect effect is likely to be that “people will tend to overestimate the influence mass communications have on the attitudes and behavior of others” (Davison Reference Davison1983, 3). This is called the third-person effect. Empirically, the third-person effect is well documented (Perloff Reference Perloff1993; Sun et al. Reference Sun, Pan and Shen2008). Gunther (Reference Gunther1998), for example, showed in an experiment that the slant of news reporting causes differences in perceived public opinion by the participants: although the participants did not change their own opinion on their respective topics, they expected that others had changed their opinion because of the reporting. Policymakers who are interested in the current state of public opinion rely on the media exactly for that reason (Herbst Reference Herbst1998, 86). They also face the problem of insufficient survey data. Herbst (Reference Herbst1993, 101) reports that, in the 1930s and 1940s, 86% of congressmen relied on the printed press to gauge public mood, and a quarter of congressmen actually counted newspaper editorials to get insights into opinion on specific topics. As outdated as this finding might seem at the first glance, more recent research supports this result (Herbst Reference Herbst1998). It is the “influence of presumed influence” (Gunther and Storey Reference Gunther and Storey2003) that matters – for politicians as well. For example, policymakers try to get access to and coverage in the media to present themselves in a good light because they believe that their media coverage influences their reelection chances (Cohen et al. Reference Cohen, Tsfati and Sheafer2008). A prerequisite for that expectation is that politicians believe in the influence the media has on public opinion. Politicians even take specific news reports as a call for action (Cook et al. Reference Cook, Tyler, Goetz, Gordon, Protess, Leff and Molotch1983; Herbst Reference Herbst1998, 79). However, “it is the totality of media attention, the general slant or tendency of coverage (…) that is synonymous with public opinion” for them [Herbst Reference Herbst1998, 67 (emphasis in original)].
Much like politicians, we can therefore rely on media content analysis to generate high-frequency data for public demand that can also be used to reconstruct public demand backwards in time – which is impossible with public opinion surveys. Our content analysis follows this idea by looking at frequencies and claims, which are opinion statements of nongovernmental actors in the news, in order to grasp what is discussed by the public. Various authors have argued that these claims influence public opinion the most (Koopmans Reference Koopmans2004; Howland et al. Reference Howland, Becker and Prelli2006). Our assumption is that claims are those parts of media content that reflect the perceived published opinion best.Footnote 4
As we established above, the published opinion is likely to differ from public opinion measured by surveys. Furthermore, in contrast to large parts of the media effects literature (McCombs and Shaw Reference McCombs and Shaw1972; Zaller Reference Zaller1992), we are not interested in trying to explain whether public opinion shapes news media reporting and the published opinion, or vice versa. Hence, if it would turn out that survey results change first and public opinion follows suit, this would still be perfectly in line with our expectations as we only want to show that the relationship exists, independent of its direction. However, public opinion remains hidden and abstract most of the time. Politicians who try to gauge the public demand for certain policies must therefore rely on what is available – which is mostly the published opinion. Published opinion consists of single opinions made public through the media, and can also be described as elite opinion, as it results from a selection process by journalists.Footnote 5
The public demand spectrum
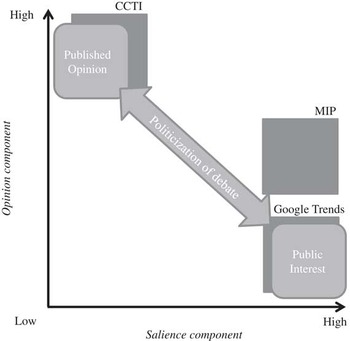
In developing an empirical measure of the general public demand, we need to disentangle the theoretical dimensions of the concept we are interested in. We consider public demand as a multifaceted umbrella term. Public demand towards a topic is composed of a salience and an opinion component (see Figure 1). Salience captures how important a given issue is from the viewpoint of members of a given social unit (e.g. a country). Empirical demand measures combine the two elements – salience and opinion – in varying ratios. In the communication sciences, for instance, “[e]mpirically, object salience on the media agenda typically is measured by the amount of media coverage over time” (Chyi and McCombs Reference Chyi and McCombs2004, 22). In survey research, respondents are often confronted with a list of social problems and are asked to rank these problems in terms of how important they think these are.
Spectrum of public demand with the three media-based demand concepts. Note: CCTI=climate change threat index; MIP=most important problem.

Opinion is located on the other axis and captures the position people take about a given social problem, what they think should be done about it and by whom. The ends of the spectrum are distinct in the sense that individuals or groups that make up the general public may hold opinions on a given issue, whereas the underlying issue may or may not be important to them.
We propose three measures: media salience, politicisation of the public debate and published opinion. These can all be placed at different points of the demand spectrum. As the name indicates, our media salience measure represents the salience aspect of demand, whereas we capture the opinion aspect of demand via published opinion in our data.
Politicisation of the public debate covers the middle ground between salience and opinion on the public demand spectrum by combining the extent of coverage of the topic as well as the specific opinions presented. Politicisation thus provides information on how contested or politicised the respective issue is within the media debate.Footnote 6 In contrast to the positive (pro) and negative (con) directionality of the published opinion measure, politicisation accounts for the general level of debate that exists over the topic of interest. Thus, a politicised debate can be characterised by a high number of opinionated (pro or con) statements on a certain topic presented within the public discourse.
Although we may observe times where factual coverage of the issue is high (thus resulting in a high media salience for the issue) and times when there are only a few articles – but these are full of positive or negative claims for policy change from the government (thus, resulting in a high positive or negative published opinion towards climate change policies), the politicisation measure is able to distinguish whether for a given salience of the topic there is more debate (i.e. more pro or constatements). The politicisation measure thus proxies how contested a debate is in terms of statements given (independent of their direction).Footnote 7
We compare our measures with existing public opinion survey data and data from Google Trends – a new data source that is increasingly used in social sciences research.
The next section starts with a discussion on the relationship between media, opinion and politicians, presents the data generated by our newspaper content analysis and subsequently offers a brief description of the public opinion survey data and the internet search requests data we use for the comparison.
Measuring public demand in the media
This section describes the coding of our theoretically established dimensions of public demand – media salience, published opinion and politicisation – by means of a media content analysis. The latter measure combines salience and opinion by capturing the politicisation of public debate in terms of the relative frequency of claims (pro or con) in comparison with the frequency of media reporting on climate change issues. Future research will have to establish which of these three demand measures performs best in the sense of explaining and predicting policy output over time and across countries. In any event, the politicisation measure is the most encompassing as it includes both the salience and opinion component of public demand.
Sample and coding procedure
For media content analysis in the US, we selected USA Today and the New York Times.Footnote 8 In introducing our data in the descriptive part, we present the two newspaper series separately for the reader to grasp the particularities of each media outlet. However, as both newspapers together reflect the media landscape more appropriately, we combined the values for our comparative analysis. There are three main reasons for using daily newspapers and particularly newspapers of record. First, they serve as agenda setters for other media such as television, radio, internet and other newspapers (Golan Reference Golan2006; Vliegenthart and Walgrave Reference Vliegenthart and Walgrave2008; Denham Reference Denham2014). Journalists read news to determine what “news” is. Even for new media such as blogs, a close, reciprocal relationship with regard to agenda setting between newspapers and blogs exists (Wallsten Reference Wallsten2007). This means that newspapers of record can serve as a good proxy for the general media landscape. Second, newspapers have more capacity than, for example, TV news for reporting on political topics that are currently less prominent. In addition, newspaper reporting has a longer durability. Newspaper articles can be easily forwarded (also through social networks) and print versions last at least 24 hours, whereas in broadcasting the composition of news can change every hour (Herbst Reference Herbst1998, 85). Third, as we were looking for a demand measure with high transferability potential, we chose a data source that is easily accessible.
We relied on online archives to download all articles relevant to the climate change issue from 1995 to 2010 (see Appendix A for more information on the search terms and download procedure). We covered the full reporting of each newspaper. The only sampling that took place was based on the requirement that at least five climate change (policy)-related keywords had to be present. To ensure replicability, the coding was based on a project language approach (Peter and Lauf Reference Peter and Lauf2002). This means that all articles were mostly read and coded by native speakers, although the codebook was written in the project language (English), and all reliability tests and training were also conducted in English. In total, nine research assistants were involved in the coding process.Footnote 9 In the remainder of this section, we briefly describe how each of the three measures is defined and coded and present the resulting data descriptively (for additional information, see Appendix A). As we recorded the exact publication date for each article, the smallest time unit is the day. However, to compare our new media data with public opinion survey data, we aggregated our data either to the monthly or to the quarterly level.
Media salience
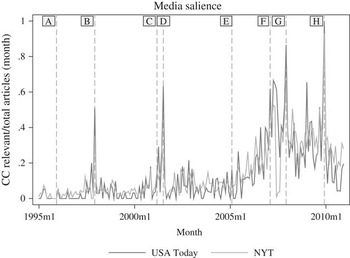
To measure media salience, we use the number of climate change-related (see Appendix A for definition) articles relative to the total number of articles published in the respective newspaper within a given time. Figure 2 displays the resulting data for the two newspapers from which the data for the US were coded.
Media salience of the climate change (CC) issue, 1995–2010, monthly data. Note: Measured as the number of CC-relevant articles as a proportion of all articles published within a given month in the USA Today and the New York Times (NYT). Scale=0 … 1, where 1 is the empirical maximum of the variable (occurs in 2009m12). Events: A: IPCC assessment report 2 (AR2) (1995m12); B: Conference of the Parties (COP) Kyoto (1997m12); C: AR3 and United States withdrawal from the Kyoto Protocol (2001m3); D: COP Bonn (2001m7); E: Kyoto Protocol enters into force (2005m2); F: AR4 (2007m2); G: COP Bali (2007m12); and H: COP Copenhagen (2009m12).

It is noteworthy that the two series parallel each other quite closely with similar peaks. Five events coincide with (and are presumably causing) spikes in our media salience measure: the signing of the Kyoto Protocol in December 1997; the conference of the parties in Bonn in July 2006; the publication of the 4th assessment report of the Intergovernmental Panel on Climate Change (IPCC) in March 2007; and the Conference of the Parties in Bali in December 2007 and in Copenhagen in December 2009 (see also Sampei and Aoyagi-Usui Reference Sampei and Aoyagi-Usui2009; Schaffer Reference Schaffer2011). We also observe a strong upward trend in media salience from about 2005 to 2009.
We will compare media salience to Google Trends and MIP, as these are the two most established indicators that reflect salience. Hence, the fit should be best among these three measures (see below for a detailed discussion of the reference demand measures).
Published opinion
Assuming that debate in the media reflects the distribution of published opinion, we have coded claims in favour (for more climate protection) or against (preservation of the status quo or less climate protection). In general, claims are statements, demands or opinions given by an individual or an organisation or summaries of position papers, press statements, comments and so on. In addition, a claim is always directed towards the future and at something that lies beyond the sphere of influence of the claim maker. This means that claims by government officials have not been recorded. To the contrary, a major share of our claims stems from letters to the editor written by ordinary citizens, as we do not differentiate by claim maker. With regard to our definition of claims, we deviate from the classical claims analysis approach by Koopmans and Statham (Reference Koopmans and Statham1999). This adaptation is necessary, as we pursue a different goal with our claims data. In fact, for our purpose, claims are an intermediate, and only their direction and frequency are examined.
Claims can be either general or specific. For the pro claims, this can look like, respectively, “The major countries that emit should take domestic action, and not have these loopholes” and “We need a moratorium on coal now”.Footnote 10 The same applies to con claims: “This [limit on greenhouse gas emissions for the industry] has the potential to be very damaging to the California economy” and “For years, Dr. Goklany, an electrical engineer by training, has written in papers and books that it may be better not to force cuts in greenhouse gases because the added prosperity from unfettered economic activity would allow countries to exploit benefits of warming and adapt to problems”.Footnote 11
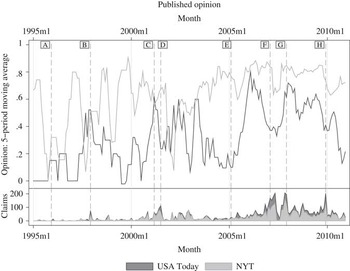
We use the ratio of pro and con claims, defined as pro minus con claims divided by the total number of claims, as our published opinion measure. This measure captures whether news media content within a given time interval is leaning more for or against climate protection. Figure 3 displays the data generated by this approach for the New York Times and USA Today. The upper panel shows the five-month moving average of our published opinion measure, whereas the lower panel gives information on the actual number of claims made in the respective newspaper at a given point in time.
Published opinion (ratio of pro- and con climate protection claims over total claims), 1995–2010, five-month moving average. Note: Measured as pro- minus con climate protection claims divided by the sum of positive and negative (total) claims per month. Scale=−1 … 1; where “−1” means that only negative claims were made and “1” that only positive claims were made. Using five-months moving averages makes it easier to visually compare the two series. Events: A: assessment report 2 (AR2) (1995m12); B: COP Kyoto (1997m12); C: AR3 and United States resigns of Kyoto (2001m3); D: COP Bonn (2001m7); E: Kyoto Protocol in force (2005m2); F: AR4 (2007m2); G: COP Bali (2007m12); and H: COP Copenhagen (2009m12). NYT=New York Times.

As one might expect, there is less similarity between the two newspapers, compared with the salience measure, as this measure taps more into editorial preferences of the newspaper and how certain issues and positions of stakeholders are reported. Contrary to the media salience measure, the two series do not move in parallel. The New York Times has the largest proclimate protection claims peak in 2001 (probably in view of US withdrawal from the Kyoto Protocol), and, from about 2004 onwards, includes on average more pro climate claims in relation to total claims than USA Today. The rough shape of the time series in earlier years stems from the lower absolute number of claims. There is a general upwards trend in the pro climate protection claims ratio for the 1995–2009 period.
As discussed above, we do not expect that published opinion correlates perfectly with public opinion measures. However, we do expect that our measure of published opinion and the two survey-based measures CCTI and MIP should at least generally move into the same direction. Nevertheless, we want to stress that other survey items asking people whether, for example, the government should do more on climate change would be more directly comparable with our more detailed measure.
Politicisation of the public debate
Although the media salience measure captures the attention climate change issues receive in the media in general terms, it does not really measure how intense or contested the public debate on the subject is. We submit that the total numbers of claims (positive and negative) in relation to salience can proxy for debate intensity, or politicisation, of the issue. This measure includes both salience and opinion, and thus offers a rather encompassing measure of public demand.
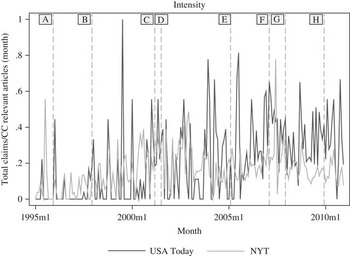
We use the total number of claims (both pro and con climate protection) divided by the total number of climate change-relevant articles in a given time interval to that end. Figure 4 displays the resulting data. Similar to the salience measure, the two series move quite closely in parallel. Furthermore, the overall level of politicisation rises over time.
Intensity of the public climate change (CC) discourse, 1995–2010, monthly data. Note: Measured by total number of claims per month (sum of pro and con claims) divided by the number of CC-relevant articles in USA Today and the New York Times (NYT) (monthly). Scale=0 … 1, where “1” is the empirical maximum on the variable (occurs in 1999m7). Events: A: assessment report 2 (AR2) (1995m12); B: COP Kyoto (1997m12); C: AR3 and United States resigns of Kyoto (2001m3); D: COP Bonn (2001m7); E: Kyoto Protocol in force (2005m2); F: AR4 (2007m2); G: COP Bali (2007m12); and H: COP Copenhagen (2009m12).

As stated above, this novel concept of politicisation of the public debate is difficult to compare with existing measures that either serve as public opinion measures or salience measures. Nevertheless, in the comparison (see further below), we expect to observe some coevolution of politicisation of the public debate with Google Trends and particularly with Gallup’s MIP, as it is survey-based and thus closer to public opinion but asks respondents directly about salient issues.
Demand measures for the comparison
Public opinion surveys
To validate our demand measures, we compare them with alternative demand measures, particularly survey data and internet search engine request data. As noted above, we will compare this data with US public opinion survey data from two sources in order to assess the validity of our new data coded by means of news media content analysis.
The first measure is the CCTI. This was developed by Brulle et al. (Reference Brulle, Carmichael and Jenkins2012). They use a method suggested by Stimson (Reference Stimson1999) to cope with different surveys that have been implemented over time and that use varying items or item wordings to then estimate a policy mood on climate change. This method uses available survey marginals on questions concerning climate change and relies on a complex algorithm to calculate a comparable metric between those questions. To put it simply, the CCTI can be read as the aggregate survey marginal of all these questions, where higher values represent more concern about climate change. Theoretically, such a policy mood indicator can take values between 0 and 100. In fact, however, the CCTI ranges only between 41.61 and 53.2. It uses 14 survey items and data for a total of 84086 respondents who were polled by six different survey organisations from 2002 to 2010 (Brulle et al. Reference Brulle, Carmichael and Jenkins2012). The CCTI approximates the policy mood concerning climate change on a quarterly basis and can serve as a measure for the opinion component of public demand. As noted above, these are the best approximations of public demand for climate change policies (in which we are ultimately interested) we could find. Nevertheless, as they do not completely capture this concept, we need to remain cautious of this test of our measure as invalidating our approach. Although our new data set covers the years 1995–2010, there is no consistent public opinion data on climate policy for the pre-2002 period. Second, to try and overcome this, we use Gallup’s MIP item, which is available on a quarterly basis for the entire period (1995–2010). Although it has the best coverage over time, this item is arguably again a very incomplete proxy for public demand for climate change policy. It asks respondents what they consider the most important problems facing the US at the respective point in time. The MIP measure most relevant for us is the proportion of people naming the environment. It can be assigned to the salience aspect of demand and should thus correlate with media salience.
Internet searches
As stated above, internet search data are increasingly relevant to measure the preferences of people. We use Google Trends to compare internet search data with our own demand measures. The original scale of the Google Trends data ranges from 0 to 100, with 100 indicating the national maximum of search requests during the observation period, and 0 indicating the threshold set by Google was not reached. Repeated searches by a single user within a short time are counted as one search. We use data for three search terms “global warming”, “climate change” and “greenhouse effect”, based on Oehl (Reference Oehl2015). The original data have a weekly format and are available from 2004 to present, but we aggregate to monthly data for purposes of comparison here (see Ayoubkhani Reference Ayoubkhani2012). As usage of particular search terms may vary over time, we rely on an index proposed by Oehl (Reference Oehl2015), which ranges from 0 to 1.
Comparison
The main purpose of this article was to find out whether our proposed historical reconstruction of public demand on the basis of media content analysis provides a useful alternative where other types of measures of public demand (notably data from public opinion surveys or internet searches) do not exist, cannot be historically reconstructed or are not commensurable enough to be patched together from different data sets. Although some caveats apply concerning the comparability of the survey measures, we believe this comparison can provide an indication of whether our data represent a valid measure of public demand that can be generalised past the US and whether there are dimensions of public demand where there is more or less overlap.
We thus compare our new data with the best available alternatives – namely, public opinion survey data and internet search data from Google Trends. As noted above, the Google Trends data likely capture primarily the saliency dimension of the climate issue, whereas the public opinion data tend to capture both saliency and, to some extent, public opinion. The new data are more explicit in measuring media salience, the politicisation of the public debate and published opinion. This raises the issue of what should be compared. We opted for an inductive, data-driven approach and compare the three new measures with both public opinion and internet search data. In order to make our data comparable with the different survey and Google Trends measure, we transformed all series to have a common mean of 0 and a SD of 1.Footnote 12
The following part visually identifies the most obvious similarities and differences, and uses cross-correlation analysis (see Sampei and Aoyagi-Usui Reference Sampei and Aoyagi-Usui2009) to obtain some indication of whether and how the series correlate. The latter method reveals patterns of correlation between time series and displays correlations for various lags immediately. If two series move exactly in parallel, we will see a peak at a lag of 0 (contemporaneous). It also enables us to spot lags of one variable that may serve as predictors of the other variable. If two series correlate at lag 0, this means that we can reject an implicit null hypothesis of independence or noncorrelation between the series. This is in fact what we observe for most of the crosscorrelations examined in the remainder of this section.
Media salience
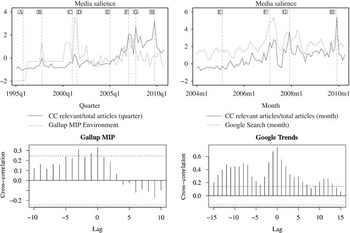
As expected, the media salience measure generated by media content analysis seems to perform quite well, presuming that the MIP and Google Trends data are valid indicators of saliency (see Figure 1), and can thus provide the basis for a meaningful comparison (Figure 5, top row). At least until 2007, the series appear to be quite closely correlated.
Comparison and cross-correlation of saliency data with survey and internet search data. Note: Top row: comparison of the relative frequency of media reporting on climate change by two United States (US) newspapers with the Gallup most important problem (MIP) measure and Google Trends data. Scale: normalised with mean=0 and SD=1. Events: A: assessment report 2 (AR2) (1995q4); B: COP Kyoto (1997q4); C: AR3 and US resigns of Kyoto (2001q1); D: COP Bonn (2001q3); E: Kyoto Protocol in force (2005q1); F: AR4 (2007q1); G: COP Bali (2007q4); and H: COP Copenhagen (2009q4). Bottom row: cross-correlation coefficient plus 95% confidence intervals between Gallup MIP and Google Trends and our salience measure [lags in quarters: 10 (Gallup); lags in month: 15 (Google Trends)]. For the cross-correlation analysis, we try to show the cross-correlations over a sufficient number of times, given the length of the time series; we have thus opted to show roughly between one and two years’ worth lags.

In the cross-correlation analysis, we are mostly interested in whether our media salience measure has a high and significant contemporaneous correlation with the target series for salience, the MIP and the Google Trends.Footnote 13 As shown in the bottom row of Figure 5, we can see that the serial cross-correlation between the Google Trends monthly data and our media salience measure is always very high (above 0.6). The Gallup MIP as a survey measure also seems to compare well with our media salience measure, although the contemporaneous correlations are somewhat lower, peaking at around 0.34. Given that the available data relate only to “the environment” and not to “climate change” or “global warming” as such, this may explain the lower cross-correlation. Furthermore, besides the contemporaneous correlations, we can observe that a four-period (one year) lag of the Gallup MIP seems to be a good predictor of our media salience measure at time t, meaning the Gallup MIP leads our media salience measure. Overall, we can quite confidently establish that our salience measure can serve as a valid proxy.
Published opinion
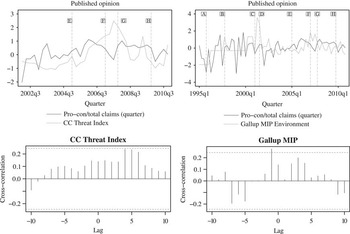
In determining which measures are comparable, we have argued that the opinion dimension (see Figure 1), which we intend to cover with our published opinion indicator, can best be compared with the two survey measures (CCTI and MIP). Overall, as shown in Figure 6, it appears that our opinion indicator indeed lines up to some extent with the two survey-based measures. This suggests that the published opinion measure based on the pro/con claims ratio is actually closely linked to the general direction of public opinion concerning climate policy. We observe a generally good fit for both of the survey-based measures, but also observe major differences in published opinion around major events or major amplitudes (positive and negative).
Comparison and cross-correlations of opinion data with survey and internet search data. Note: The top row compares the ratio of positive to negative claims in media reporting on climate change (CC) by two United States (US) newspapers with the climate change threat index (CCTI) and the Gallup most important problem (MIP) measure. Scale: all series normalised with mean=0 and SD=1. Events: A: assessment report 2 (AR2) (1995q4); B: COP Kyoto (1997q4); C: AR3 and US resigns of Kyoto (2001q1); D: COP Bonn (2001q3); E: Kyoto Protocol in force (2005q1); F: AR4 (2007q1); G: COP Bali (2007q4); and H: COP Copenhagen (2009q4). Bottom row: cross-correlation coefficient plus 95% confidence intervals between CCTI and Gallup MIP and our opinion measure [lags in quarters: 10 (CCTI and Gallup)].

The cross-correlation (bottom row) analysis confirms these visual impressions. The opinion measures against which we compare our published opinion measure are the CCTI and the Gallup question (MIP). Although there seems to be no significant correlation for the CCTI and our opinion measure, we observe a significant, although small (0.27), correlation at lag −1 between published opinion and the Gallup MIP (Figure 6). This indicates that a one-period lag of the Gallup MIP (t−1) is a good predictor of our published opinion measure at time t, and thus the Gallup MIP leads our opinion measure.
We find two potential reasons for these mixed results. On the one hand, the three alternative measures for public demand available tend to primarily capture concern about climate change issues, and not so much public demand for or against political responses to the problem (our substantive interest). We believe that our opinion measure comes closer to measuring the opinion aspect of public demand than the three best available alternatives used here. However, further research should investigate in greater detail how our measure relates to the very few survey items seeking to capture attitudes towards climate policy more directly. On the other hand, the low cross-correlation could also be due to the fact that editorial policies are producing differences in our opinion measure across media outlets.
Politicisation of public debate
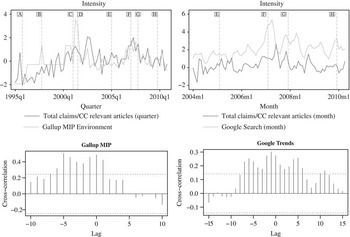
Finally, as indicated by Figure 7, our measures referring to the politicisation or contestation of an issue lines up quite well with the amplitudes, trends and peaks of the survey data and the internet search data. As this measure conceptually and empirically covers the middle ground between salience and opinion (see Figure 1), we have argued above that the best measures to compare are Gallup MIP and Google Trends.
Comparison and cross-correlation of intensity data with survey and internet search data. Note: The three panels compare the ratio of total claims (positive and negative) with total climate change (CC)-relevant articles two United States (US) newspapers with the climate change threat index (CCTI), the Gallup most important problem (MIP) measure and Google Trends data, respectively. Scale: all series normalised with mean=0 and SD=1. Events: A: assessment report 2 (AR2) (1995q4); B: COP Kyoto (1997q4); C: AR3 and US resigns of Kyoto (2001q1); D: COP Bonn (2001q3); E: Kyoto Protocol in force (2005q1); F: AR4 (2007q1); G: COP Bali (2007q4); and H: COP Copenhagen (2009q4). Bottom row: cross-correlation coefficient plus 95% confidence intervals between Gallup MIP and Google Trends and our intensity measure [lags in quarters: 10 (Gallup); lags in month: 15 (Google Trends)].

The cross-correlation (bottom row) analysis supports the visual impression of the comovement of the series. The contemporaneous correlations between the Gallup MIP and the Google Trends and our politicisation of the public debate measure are significant and substantial. It is noteworthy that the Gallup MIP measure, which we think is the most plausible alternative measure for politicisation as it asks for the importance of the topic on the political agenda, correlates significantly and consistently with our politicisation measure. Put differently, the perception of an issue as an important problem seems to go hand in hand with the politicisation of the debate. Regarding the Google Trends measure, we can see that our politicisation measure at time t−1 is a good predictor of the Google Trends measure at time t, meaning that the Google Trends measure leads our politicisation of the public debate measure. It also makes intuitive sense that an increased politicisation of an issue within the media leads people to search for it.
Robustness check: how does the US case compare with other countries?
This article has proposed a way of measuring different dimensions of public demand for public policy, focussing specifically on the issue of climate change policy. One reason for our efforts to come up with a media-based content analysis was that commensurable and comparable public opinion or stakeholder survey data between countries and over time are hard to find. Although we have collected our media-based data for six countries over the time period from 1995 to 2010, we were not able to find sufficiently comparable survey data for reliability checks on our data in countries other than the US. However, as a robustness check, this section will first show how our US newspaper data compare with our media-based data from GermanyFootnote 14 and Spain,Footnote 15 and, second, will compare our data on the public demand for climate change policies to the best available proxies from Germany and Spain. This should increase the confidence that the US case can be regarded as representative of our larger population.
Figure B1 in Appendix B shows our three measures – media salience, published opinion and politicisation of the public debate – for the US, Spain and Germany. In the case of media salience (Panel A), the descriptive comparison of the three time series shows that – generally, but especially since 2005 – the salience for climate change has increased in all three countries, which coincides with the inception of the Kyoto Protocol. Similar to the US case, media salience in Germany has also been elevated sharply from about 2005 onwards. With regard to our published opinion measure, we observe that, although there is a lot of comovement of the three series, published opinion in Germany seems to include more pro claims on average and also more claims in general (see lower part of the graphs in Panel B). Yet, the number of claims sharply increased in all three countries from about 2007 onwards. The third measure, politicisation of the public debate, however, increases over time in the US and stays around the same level in Spain and Germany. This could imply that problems of climate change and potential policy solutions were debated earlier in Spain and Germany compared with the US. All in all, the US case does not differ starkly from the evolution of public demand in climate change leader countries such as Germany, or in other countries that are part of the Kyoto Protocol, such as Spain.
Are our new measures in these two additional countries correlated with the best available proxies concerning public opinion or salience towards climate change? To this end, we again compare our three measures with two different time series: first, the equivalent of Gallup’s MIP question on “the environment” surveyed in Germany (Breunig Reference Breunig2014) and SpainFootnote 16 (Chaqués-Bonafont and Baumgartner Reference Chaqués-Bonafont and Baumgartner2013; Chaqués-Bonafont et al. Reference Chaqués-Bonafont, Palau and Baumgartner2015)Footnote 17 and, second, Google Trends data on internet searches in Germany and Spain.
With regard to the respective cross-correlations for our media salience measure, we find that, similar to our US data, the Google Trends data show a significant contemporaneous correlation ranging from 0.4 in Spain to 0.65 in Germany (cf. Figure B2 in Appendix B). Concerning Gallup MIP, for Germany as well as for the US, the contemporaneous correlation is significant (cf. Figure B3 in Appendix B). However, for Spain, the two time series are not seemingly correlated. Furthermore, our measures of published opinion and politicisation do not correlate as well as the media salience measure (see Figures B4–B7 in Appendix B). However, given that the available data relate only to “the environment”, and not to “climate change” or “global warming” as such, this may explain the lower cross-correlation.
In sum, the descriptive analysis of our media-based data in three countries finds a lot of parallel movement across all three measures. In comparison with already-existing (but not completely comparable) data, our measure of media salience empirically performs best. The other theoretically important dimensions of public demand we have proposed, published opinion and the politicisation of the debate, do not compare as well. Their importance lies in the potential to use these more fine-grained and multifarious demand measures to explain a government’s responsiveness.
Conclusion
Systematic measurement of public demand for particular policies is important not only normatively, but also analytically, as it is needed to construct accurate explanations of political choices and their outcomes. Public opinion survey data, which presumably offer the most valid information on public demand, are largely unavailable for extensive time periods in forms that allow for crossnational comparison. As these limitations are impossible to overcome post hoc, we investigated whether media content analysis could generate valid proxies for public demand by capturing published opinion. The empirical application focussed on climate change policy.
We coded new media-based public demand data for the time period 1995–2010. To assess the usefulness of our data for researchers trying to build public demand into explanatory models of public policy choices, we generated three types of indicators of public demand – media salience, published opinion and the politicisation of public debate. We subsequently compared these indicators with three alternative measures. Two of these alternatives are based on survey data (CCTI, Gallup’s MIP); the third measure is based on internet search data (Google Trends). The comparison focussed on the US as alternative data, and especially data covering the substantive issue area of climate change, are by a wide margin most comprehensive for that country. This is especially due to the CCTI, which shows the policy mood specifically for our topic of interest – climate change. However, we also conducted robustness checks by focussing on two more countries, Germany and Spain, to explore the usefulness of our measurement approach and data beyond the US. These additional analyses showed that our approach works quite well for other countries as well, although systematic comparison with alternative measures of public demand is difficult because public opinion data on climate change are very much limited.
The comparisons also show that it is meaningful to disaggregate the spectrum of public demand into specific theoretical concepts (salience and opinion). In particular, the empirical measures for media salience and politicisation line up quite well with the existing survey and internet search data. The published opinion measure shows the lowest cross-correlation scores. However, this is potentially due to the fact that the two alternative measures of public demand tend to primarily capture the attention to, or concern about, climate change issues, and do not link these aspects with public demands in favour or against political responses to the problem (which is what our claims measure). We believe that our opinion measure comes closer to measuring the opinion aspect of public demand than the available alternatives. Nevertheless, further research should investigate in greater detail how our measures relate to those very few survey measures that seek to capture attitudes towards climate policy more directly.
Overall, we submit that the data generation method proposed in this article can produce valid data on public demand for specific policies, notably because it uses information sources political decisionmakers turn to as well when trying to gauge the “public mood”. Of course, reliability remains an issue when relying on human coding, although we took the usual precautions such as systematic coder training and coder meetings, as well as random tests for consistency. With rapidly improving technologies for machine-assisted data coding and “big data” approaches to retrieve information from the internet, the problem of reliability and the costs of implementing media content coding are likely to decrease substantially (see e.g. Young and Soroka Reference Young and Soroka2012). Although automated coding may turn out to be very difficult in policy areas that are multifaceted in nature, such as climate policy, it is likely to become a cost-efficient way of coding valid and reliable public demand data in areas where policies are clearly defined and relatively homogeneous or one-dimensional in nature (e.g. military spending, abortion, death penalty, welfare spending). In any event, compared with the costs of public opinion surveys, the approach we propose in this article is much cheaper and can generate high-frequency data, whereas even the most intense (and extremely expensive) public opinion survey efforts (e.g. by Gallup) generate monthly or quarterly data at best.
Acknowledgements
We would like to thank Alba Mohedano Roldán, Basil Schläpfer, Brittany Rodriguez, Nicole Ponta, Pascal Scheiwiller, Pia Struntz, Samantha Suarez, and Sara Eliason for their excellent research assistance. We also thank two anonymous reviewers for helpful comments.
Supplementary material
To view supplementary material for this article, please visit http://dx.doi.org/doi:10.1017/S0143814X16000155