I. INTRODUCTION
The material class of transparent conductive oxides, which are wide-band gap semiconductors (E g > 3 eV), is both of scientific and technical interest since these oxides can be used as transparent electrodes.Reference Ellmer, Klein and Rech1 Their development started in the 1950s with CdO and indium tin oxide (ITO).Reference Helwig2, Reference Rupprecht3 Today, mostly tin-doped indium oxide, zinc oxide (ZnO) doped with group III elements, and tin oxide (SnO2) doped with group V elements are used as n-type transparent conductive oxide (TCO) materials.Reference Ginley, Hosono and Paine4
Because of the required transparency (at least in the visible spectral range) and the low resistivity, these compound semiconductors have to be doped degenerately, i.e., up to very high charge carrier (electron) concentrations (N ≫ 1019 cm−3). The high carrier densities reaching N ≈ 1021 cm−3 lead to a significant absorption at free carriers (electrons) which sometimes limits its use, for instance in thin film solar cells. One goal is therefore to achieve the low resistivity ρ = (eNμ)−1 by maximizing the mobility μ of the electrons. Furthermore, it is required that the defect density in the band gap is low to reduce the absorption in the TCO layer.
The electrical transport in TCO materials is governed by various scattering processes, which are typical for semiconductors: (i) intrinsic scattering by lattice vibrations (acoustic, optical) and (ii) extrinsic scattering due to intentional and unintentional dopants and defects in the films (ionized impurities, defect clusters, point defects, dislocations, stacking faults, grain boundaries, i.e., crystallographic defects).Reference Ellmer, Ellmer, Klein and Rech5 Since TCO layers for transparent electrodes are highly doped polycrystalline films, extrinsic scattering is the dominant process. Although the scattering at ionized impurities, i.e., at the dopants, cannot be avoided (at least in homogeneously doped films), the density of crystallographic defects can be influenced and controlled by the deposition process and the used substrate (polycrystalline or epitaxial growth).
Thin TCO films can be prepared by a variety of methods: (i) reactive evaporation,Reference Nath, Bunshah, Basol and Staffsud6–Reference Hamberg and Granqvist8 (ii) oxidation of metal films, (iii) chemical vapor deposition,Reference Hu and Gordon9, Reference Fay, Shah, Ellmer, Klein and Rech10 (iv) sputtering, especially magnetron sputtering,Reference Rozgonyi and Polito11–Reference Tominaga, Ueshiba, Shintani and Tada13 (v) pulsed laser deposition,Reference Hirata, McKittrick, Siqueiros, Lopez, Cheeks, Contreras and Yi14, Reference Kaidashev, Lorenz, von Wenckstern, Rahm, Semmelhack, Han, Benndorf, Bundesmann, Hochmuth and Grundmann15 (vi) pulsed and DC cathodic arc deposition,Reference Goldsmith16–Reference Mendelsberg, Lim, Zhu, Wallig, Milliron and Anders20 or (vii) electrochemical deposition.Reference Nonomura, Loewenstein, Michaelis, Wöhrle, Yoshida, Minoura and Schlettwein21
In the following, we concentrate on magnetron sputtering, which is the mostly used deposition method for TCO layers for transparent electrodes nowadays,Reference Ellmer, Klein and Rech1, Reference Ginley, Hosono and Paine4 due to its inherent advantages, like:
(i) low-temperature deposition (ion assistance);
(ii) easily scalable to large deposition areas (≫m 2); and
(iii) preparation of compact films with very good homogeneity.
Special emphasis is given to the origin and energies of species (ions) in a magnetron discharge and their influence on the film growth.Reference Thornton, Huggins, Bube and Roberts22, Reference McKenzie, Marks, Guan, Pailthorpe, McFall, Yin, MacDonald, Taglauer and Wandelt23 Here, especially negative ions will be dealt with since these ions exhibit the highest energies in a magnetron discharge.Reference Cuomo, Gambino, Harper and Kuptsis24 It is interesting, that in the review by Winters on “Elementary processes at solid surfaces immersed in low pressure plasmas” in 1980, negative ions were not yet taken into account.Reference Winters, Veprek and Venugopalan25
This review is organized in the following way: (i) Fundamental properties of a magnetron sputtering discharge are summarized, especially the origin and the energies of species in this type of discharge. (ii) The effects of negative ions, the ionic species with the highest energy, are reviewed from literature for different target materials, especially oxides. (iii) The magnetron sputtering deposition of thin films is discussed in the light of the ion–mass–energy window of ion-assisted growth, which is dealt with in the binary collision approximation of Brice et al.Reference Brice, Tsao and Picraux26 (iv) A short literature overview is given on the influence of ion bombardment on electrical and structural properties of TCO layers. Section V gives a first analysis of the intensities of high-energetic negative ions from different TCO target materials.
II. MAGNETRON SPUTTERING
Magnetron sputtering is a very versatile large-area deposition technique, which was reinvented in the 1970s. The original idea goes back to Penning in 1936, who already achieved extremely high deposition rates in a cylindrical magnetron.Reference Penning27 At this time, the potential of the magnetron for high-rate and large-area depositions was not yet recognized.
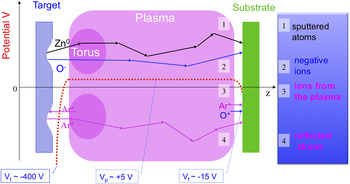
For a long time, the only benefit of this pioneering idea was the invention of the so-called Penning gauge for the measurement of high vacua.Reference Penning28 The breakthrough for the broad scientific and technical application of magnetron sputtering was the invention of the planar magnetron.Reference Clarke29, Reference Chapin30 In the following, we only discuss planar magnetrons, though meanwhile rotatable magnetrons are widely used as well, especially for large-area depositions of glass coatings and metal and oxide layers in thin film solar cells.Reference Wright and Beardow31, Reference Nadel, Greene, Rietzel, Perata, Malaszewski and Hill32 The statements on formation and energies of species in a planar magnetron are more or less transferable to rotatable magnetrons.Reference Richter, Welzel, Kleinhempel, Dunger, Knoth, Dimer and Milde33 Magnetron sputtering deposition—a scheme of a magnetron is shown in Fig. 1—is a plasma-assisted deposition process, where the plasma is intensified in front of the target material, which has to be deposited, by a magnetic confinement of the electrons. In contrast to the electrons, the ions and neutral particles are (almost) not influenced by the magnetic field.
Scheme of a magnetron sputtering discharge with the potential distribution between a zinc target and substrate (dotted line). The numbers 1–4 mark the origin and scattering paths (full zigzag lines) of different energetic species that contribute to the film growth on the substrate. Typical values for target V t, plasma V p, and floating substrate potential V f are given for a direct current (DC) discharge.

The (negative) discharge voltages are in the range of 200–800 V, depending on the target material, the total sputtering pressure, the magnetic field configuration of the magnetron, and the discharge frequency,Reference Ellmer, Hippler, Kersten, Schmidt and Schoenbach34 while the plasma potential self-adapts slightly positive to the anode potential, i.e., in most cases near to ground potential. The particle energies in such a discharge are limited by the energy E max corresponding to the difference between target V t and plasma potential V p, i.e., E max ≤ e(V p − V t) for singly ionized ions, where e is the elementary charge.
In the following, the species in a magnetron discharge are discussed with respect to their origin and the typical (maximum) energies that these species can acquire (Fig. 1):
(1) sputtered atoms (ions) from the target surface;
(2) negative ions formed at the target surface (and in the plasma);
(3) positive ions formed in the plasma;
(4) reflected atoms and neutralized ions from the target surface.
Sputtered atoms exhibit energies in the range of few to some ten electron volts, depending mostly on the surface binding energy E b of the target material.Reference Thompson35 For pure metal targets, E b values are in the range of 1 eV (cesium) to 9 eV (tungsten).Reference Eckstein36, Reference Yamamura and Tawara37 The energy distribution function f a(E) of the sputtered atoms can be, according to Thompson, described byReference Thompson35:
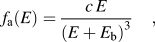
which decreases as E −2 for E≫E b, with c being a constant.
Positive ions formed in the plasma are accelerated toward the target, initiating the sputtering of the target material and sustaining the discharge by the emission of secondary electrons. If positive ions are formed at the target surface, they cannot leave the target because of the high negative target voltage. Only positive ions, formed at plasma potential, can reach the substrate. Their energy corresponds nearly to the potential fall in front of a substrate at floating potential: E ion+ = e(V p − V f). The potential difference V p − V f, which determines the energy of the positive ions, is given byReference Lieberman and Lichtenberg38:

where k is the Boltzmann constant, e the elementary charge, T e the electron temperature in the plasma, and m i and m e are the masses of ions and electrons, respectively. For an Ar plasma, Eq. (2) reads V p − V f [V] = 5.2·kT e [eV]/e. Typical values are V p − V f ≈ 10–20 V for magnetron discharges.
Reflected atoms (neutralized ions) are formed when a high-energetic ion (mostly argon) accelerated in the target (cathode) sheath to the energy E = e(V p − V t) suffers a (near) central collision (scattering angle θ ≈ 180°) with a target atom leading to its redirection toward the substrate. However, such a backscattered ion can leave the target surface only when it is neutralized or (for electronegative species) negatively charged at the target surface. The maximum energy E p of reflected atoms depends on the mass ratio m t/m p between target atom and projectile (mostly argon or reactive gases like oxygen, etc.):
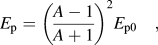
where A = m t/m p, and E p0 is the original energy of the projectile.Reference Eckstein36 For argon projectiles, the energy of backscattered argon atoms is significant only for heavy atom targets like tungsten (0.41 E p0) or indium (0.23 E p0), while oxygen atoms still have sufficient energy in central collisions also for lighter target atoms (W, 0.71E p0; In, 0.57E p0; Zn, 0.37E p0; Ti: 0.25E p0). However, here one has to take into account that most of the oxygen species impinging onto the target surface are singly ionized oxygen molecules O2+, which break into two oxygen species each exhibiting only half of the energy of the molecule. Therefore, these oxygen atoms or ions can be reflected at only half the energy values given above.
Negative ions (for instance O−, S−, Se−, Au−, etc.) acquire the maximum energy not in the bulk of the magnetron discharge or at the substrate surface. Only those negative ions, which are formed at the target surface, are accelerated across the cathode sheath toward the substrate (no. 2 in Fig. 1), gaining an energy corresponding to the full cathode sheath potential: E ion− = e(V p − V t). Because of their high energy, the collision cross section with argon (the sputtering gas) is low,Reference Harper, Cuomo, Gambino, Kaufman and Robinson39 which means that a thermalization in the sputtering gas is rather ineffective. In contrast to negative ions from the target, negative ions formed in the plasma (at plasma potential) from a cold reactive working gas have low energies and are confined in the plasma since both at the target and at the substrate they see potential walls preventing these ions to reach the substrate.
In the following, the species that are important for the film formation are analyzed in detail by energy-resolved mass spectrometry. This method goes back to the pioneering work of Davis and Vanderslice,Reference Davis and Vanderslice40 who analyzed positive ions at the cathode in a glow discharge. While the positive ions in glow discharges and magnetrons were often measured, negative ions came into consideration only quite late. Zeuner et al.Reference Zeuner, Neumann, Zalman and Biederman41 were the first to detect negative oxygen ions in a magnetron discharge for reactive sputtering from a silicon target in Ar/O2. Mráz and SchneiderReference Mráz and Schneider42 performed a systematic study on the ion-energy distributions (IEDs) of metal targets (Hf, Nb, Ta, Zr) for magnetron sputtering in Ar/O2 and correlated their results with the structure formation (amorphous or crystalline) of oxides. The most comprehensive investigation of IEDs of negative oxygen ions from metal targets was performed by Mahieu and Depla.Reference Mahieu and Depla43 They could show that the intensity of high-energetic negative ions depends on the secondary electron emission coefficient γ of the oxidized target surface. TCO sputtering processes were first investigated in the group of EllmerReference Wendt and Ellmer44, Reference Wendt, Ellmer and Wiesemann45 and later by Welzel and coworkers.Reference Richter, Welzel, Kleinhempel, Dunger, Knoth, Dimer and Milde33, Reference Welzel, Kleinhempel, Dunger and Richter46
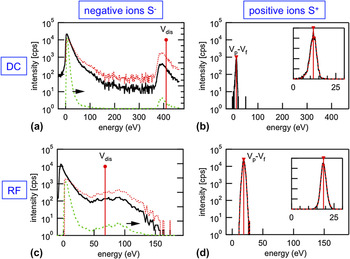
Figure 2 shows exemplarily a comparison of IEDs of positive and negative sulfur ions in an Ar/H2S discharge with a tungsten target, measured by Seeger et al.Reference Seeger, Harbauer and Ellmer47 The plasma excitation was performed both by DC and RF (27.12 MHz). While the positive ions (S+) exhibit a narrow IED at low energies (16 and 19 eV), the negative ions show a completely different IED, i.e., a bimodal ion distribution function with a low- and a high-energetic peak. Obviously, the high-energetic ions start at the target potential and are accelerated toward the substrate, acquiring an energy of E = e(V p − V t), where V p ≈ 0 V. In contrast to the symmetric low-energy peaks of the positive ions, the high-energy S− peaks are clearly asymmetric. This high-energy side can be fitted with the Thompson distribution [Eq. (1)], resembling that these (sulfur) ions have been sputtered from the target surface. Besides the high-energetic peak, a low-energetic peak occurs for negative ions with a cut-off at zero energy, which is due to the fact that the ion energy is given with respect to the floating substrate potential. In the case of RF plasma excitation also a bimodal IED was measured. Now, the maximum energies are much lower (compared to the DC discharge), and the high-energetic peak is significantly broadened. This is caused by the lower discharge voltages of RF discharges and the modulation of the sheath voltages and widths with the RF frequency.
Ion-energy distributions (IEDs) of positive and negative sulfur ions from a reactive magnetron discharge in Ar/H2S with a tungsten target (taken from Seeger et al.Reference Seeger, Harbauer and Ellmer47). The discharge was excited either by DC or by RF (27.12 MHz). The full lines in the left figures are the measured IEDs, while the dotted and dashed lines are the IEDs, corrected for the transmission of the energy-resolved mass spectrometer (for the details see Ref. Reference Seeger, Harbauer and Ellmer47). The dashed lines show the IEDs on a linear scale, while full and dotted lines display it on log scales. The circle-topped bars indicate the energies corresponding to the discharge (target) voltages.

III. EFFECT OF NEGATIVE IONS
As shown above, the negative ions of electronegative elements exhibit the highest energies of the species impinging on the substrate, i.e., on a growing film. Therefore, depending on the energy of these ions (atoms), severe effects for the film growth can be expected. For sufficiently high energies and/or ion fluxes, even etching of the deposited film or the substrate itself can be observed. One of the first reports of substrate etching during sputter deposition was given by Shintani et al.Reference Shintani, Nakanishi, Takawaki and Tada48 They investigated in detail the etching of a platinum substrate during DC diode sputtering from a BaTiO3 target at typical target voltages of about 3 kV. Despite elaborated retarding field analyzer measurements, the authors attributed the observed effect to energetic neutrals, reflected from the target. Today, these results can be explained by the bombardment by negative oxygen ions from the BaTiO3 target (see also Ref. Reference Kester and Messier49).
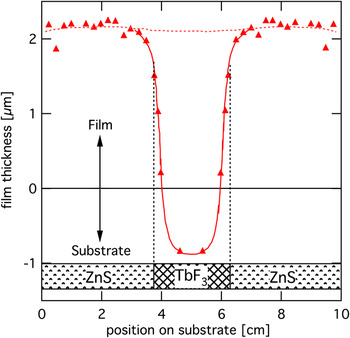
The influence of the high-energetic negative ion bombardment on film growth was observed for the first time in 1976 by Hanak and Pellicane for diode sputtering of oxides, sulfides, and halogenides.Reference Hanak and Pellicane50 An especially striking experiment of Hanak and Pellicane was the diode sputtering deposition from a composite target of ZnS (diameter 20 cm), where the central part (diameter 2.5 cm) was replaced by a TbF3 disk. The thickness distribution of the film deposited with this setup is displayed in Fig. 3, showing that opposite the central TbF3 disk no deposition at all but an etching of the substrate occurred. The obvious explanation, given by Hanak and Pellicane, was a resputtering of the deposited TbF3 film by a focused F− ion beam originating from the central part of the composite target, accelerated to an energy corresponding to E = e(V p − V t). Since the authors used diode sputtering, the target voltages were very high (1000–3000 V), compared to modern magnetron sputtering sources, explaining the high etching rates. It has to be mentioned that fluorine exhibits, besides chlorine, the highest electron affinity EA of all elements (EA = 3.4 eV), leading to a high probability of the emission of negative fluorine ions (F−). Another experiment, reported by Hanak and Pellicane, concerned sputtering from a target composed of an In2O3 and an Y2O3 part. In this case, the deposition rate was lower on the Y2O3 side, a fact, which the authors explained by the higher secondary electron emission coefficient γ of Y2O3, compared to that of In2O3, leading to a higher negative potential at the growing film, increasing the energy of positive ions on the substrate and hence the resputtering of the growing film. One has to take also into account that a higher γ value increases the number of negative oxygen ions accelerated away from the target toward the substrate, also increasing the resputtering of the Y2O3 films. In the context of this review, this is of interest since In2O3 with a lower secondary electron emission coefficient is one of the most important TCO materials.
Thickness distribution for sputtering from a composition target: a ZnS ring with 20 and 2.5 cm outer and inner diameters, respectively, and a 2.5-cm-diameter TbF3 disk in the center (after Hanak and PellicaneReference Hanak and Pellicane50).

Cuomo and coworkersReference Cuomo, Gambino, Harper and Kuptsis24, Reference Cuomo, Gambino, Harper, Kuptsis and Webber51 observed the same (surprising) etching effect for diode sputtering of intermetallic alloys of gold with rare earth elements (CsAu, NdAu, LaAu, SmAu, EuAu, TbAu, DyAu, YAu, etc.). The electronegative element in this case was Au, which also exhibits a quite high electron affinity of EA = 2.13 eV, i.e., higher than that of oxygen and comparable to that of sulfur. The etching, however, was observed by Cuomo et al., not for all of these alloys but only for the rare earth elements Cs, Nd, La, Sm, and Eu. On the basis of these results, Cuomo et al. developed the first semiquantitative model for the ejection of negative ions from a sputtered target surface. According to this model, the electrons are transferred from the rare earth elements (which exhibit low ionization energies) to the element with the high electron affinity (Au). Therefore, the energetic difference ΔE between the ionization energy EI of element A (rare earth), E IA, and the electron affinity of element B (Au), EA B, is decisive for a high negative ion flux from the target surface. Etching due to a high negative ion flux occurred according to this (Cuomo) rule for:

This rule was qualitatively confirmed by measurements of the emission of the negative ions flux by secondary-ion mass spectrometry.
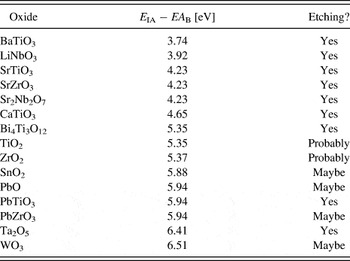
On the basis of their results for the intermetallic compounds, Cuomo et al. expected that also the material classes of halides (F, Cl, Br, I, At) and chalcogenides (O, S, Se, Te, Po) should show a pronounced negative ion emission under ion bombardment. This was proved by Kester and Messier for a series of binary and ternary (perovskites) oxides (see Table I).Reference Kester and Messier49 They observed quite significant resputtering (etching) effects for most of the investigated oxides. However, they could not confirm the simple rule of Cuomo et al. [Eq. (4)]. Resputtering was observed also for larger energy differences ∆E = E IA − EAB of up to 6.4 eV (see Table I). Kester and Messier conclude that not only the parameter ΔE determines the effect of negative ions but also other parameters like the sputtering rate of the target, stoichiometry, microstructure of the materials, etc.
Oxide materials investigated by Kester and Messier (taken from Ref. Reference Kester and Messier49), together with the energy difference ΔE = E IA − EA B and the observed etching (resputtering).

Cuomo et al. also varied the target voltage from 500 to 3000 V and could show that the substrate etching occurred only for target voltages V t > 750 V.Reference Cuomo, Gambino, Harper, Kuptsis and Webber51 This explains why the substrate etching effect was barely reported in later articles, where magnetron sputtering was used as the deposition method, since typical target voltages of magnetrons are below 750 V (often even below 500 V). However, the effect of the negative ion bombardment did not vanish completely, it became only less obvious. Therefore, negative ion effects were reported only occasionally, and systematic investigations such as that of Cuomo et al. and Kester and Messier were missing in the following years, when magnetron sputtering took over from diode sputtering.
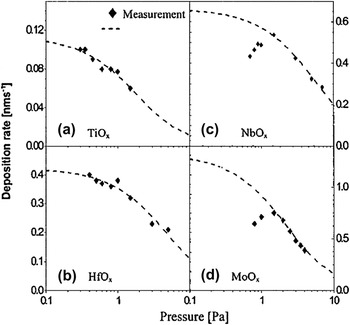
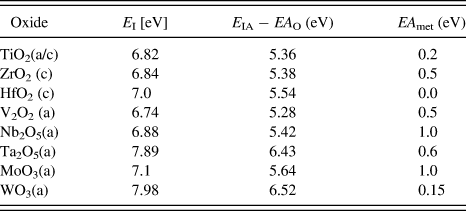
Only about 20 years later, Ngaruiya et al.Reference Ngaruiya, Kappertz, Mohamed and Wuttig52 performed a more systematic study of reactive magnetron sputtering of a series of binary oxides, listed in Table II. These authors investigated the crystallographic structure (crystalline or x-ray amorphous), the mechanical film stress, and the pressure-dependent deposition rates for reactive magnetron sputtering from different transition metal targets. Though the depositions were performed at room temperature, two (three) of the binary oxides crystallized during the film growth (see Table II). Ngaruiya et al. discuss different possibilities for the additional energy input that induces the crystallization and conclude that the negative oxygen ions from the target are most probably responsible for the crystallization. Their results can be explained, at least tentatively, by the model of Cuomo et al. (see above) since the oxides with the lowest energy difference between metal ionization energy and electron affinity of oxygen show crystalline film growth. However, the value of ΔE ≈ 5.5 eV (see Table II) is higher than that reported by Cuomo et al., which is probably due to the lower discharge voltages (280–630 V) and the much lower mass of the (dominant) negative oxygen ions (M O = 16) compared to the mass of the negative gold ions (M Au = 197) in the experiments of Cuomo et al. Another experiment performed by Ngaruiya et al.,Reference Ngaruiya, Kappertz, Mohamed and Wuttig52 fits not as well into the dependence on ΔE: For the oxides TiOx, HfOx, NbOx, and MoOx, the deposition rates as a function of the total sputtering pressure were measured (Fig. 4).
Deposition rate as a function of the total sputtering pressure of reactively sputtered oxide films (after Ngaruiya et al.Reference Ngaruiya, Kappertz, Mohamed and Wuttig52). The symbols are the experimental data, while the dashed lines are theoretical dependences calculated according to the model of Keller and Simmons.Reference Keller and Simmons53

Oxides, deposited by Ngaruiya et al. (taken from Ref. Reference Seeger, Harbauer and Ellmer47) by reactive magnetron sputtering together with the ionization energies of the metals E I, the energy difference ΔE = E IA − EA O, where EA O is the electron affinity of oxygen (1.46 eV) and the electron affinity EA met of the metal atoms.
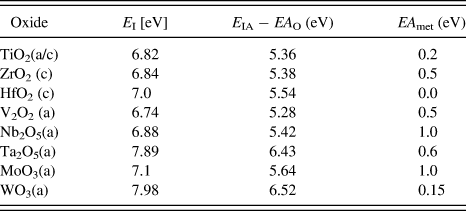
The phase structure of the oxide films is marked by “a” for amorphous and “c” for crystalline.
The rate for TiOx and HfOx decreases continuously with increasing pressure, which is the expected behavior (see the theoretical curves calculated according to the model of Keller and SimmonsReference Keller and Simmons53). On the other hand, the pressure dependences for NbOx and MoOx exhibit a maximum deposition rate at about 1–2 Pa, which can be explained by resputtering with high-energetic negative ions, mostly oxygen, at low pressures. For sputtering pressures p ≥ 2 Pa, the thermalization of the negative ions then leads to the expected Keller–Simmons decrease of the deposition rate. These data, however, cannot be explained by the formation probability of negative ions, described by the energy difference ∆E = E IA − EAB, i.e., by the (simple) model of Cuomo et al. since for Nb2O5 and MoO3 with ΔE > 5.4 eV, a relatively low formation probability of negative ions is expected. Ngaruiya et al. explain this result by the higher discharge voltages (hence higher O− ion energies) for sputtering from Nb and Mo, compared to Ti and Hf targets. Another explanation is offered by the values of the electron affinities of the different metals (see Table II). For Ti and Hf, they are near to zero, i.e., the formation probability of Ti− or Hf− is low. For Nb and Mo, EA = 1.0 eV, hence the formation probability of Nb− and Mo− is much higher, though lower than that of O− with EA = 1.46 eV. Therefore, the observed resputtering for Nb and Mo targets could also be due to the sputtering not only by negative oxygen ions (low mass) but also by heavier negative Nb and Mo ions.
In conclusion, the experiments reviewed above show that negative ions have to be taken into account in magnetron sputtering deposition if electronegative elements are involved, either in the targets or in the gas phase. This is especially the case for the deposition of halogenides or chalcogenides, for instance oxides, which include atoms that have the highest electron affinities of the elements. The negative ions are those species in a magnetron discharge that arrive at the substrate and the growing film with the maximum energies that occur in magnetron sputtering sources. Cuomo et al. in 1977 established a first theoretical model for the emission of negative ions from an intermetallic or compound target surface, which takes into account the ionization energy of one element and the electron affinity of the electronegative element (oxygen). This model can explain the observed effects only tentatively. Obviously, other parameters have to be taken into account for the effect of negative ions on film growth as was also noticed by Kester and Messier.Reference Kester and Messier49 For instance, recent investigations by Mahieu and Depla showed a clear correlation between the formation of negative ions and the ion-induced secondary electron emission coefficient of the target surface for reactive sputtering of different metals in oxygen.Reference Mahieu and Depla43 On the other hand, the secondary electron emission coefficient γ is related to the work function of the element or compound and hence again to the above mentioned electron affinity.Reference Ellmer, Mientus, Hecht, Richter and Jahn54, Reference Baragiola and Rabalais55 Nevertheless, the processes governing the formation of negative ions at target surfaces are still not very well known and understood.
IV. ION-ASSISTED FILM GROWTH
After having seen that particles with quite large energies occur in (magnetron) discharges with electronegative species, the question is how such high-energetic species influence the film growth. Although a certain ion assistance of the film growth is advantageous, too high energies of the impinging ions induce defects and disturb the film growth.Reference Barnett, Bajor and Greene56, Reference Rabalais, Al-Bayati, Boyd, Marton, Kulik, Zhang and Chu57 This problem was treated already comprehensively in the 1980s (see, for instance, Ref. Reference Greene, Barnett, Sundgren, Rockett and Itoh58,Reference Itoh59). Recently, Petrov et al.Reference Petrov, Barna, Hultman and Greene60 reviewed the microstructural evolution during film growth in general, especially emphasizing the beneficial role of low-energy ion irradiation during film growth, exemplified for the deposition of nitrides (TiN, TaN, etc.) by reactive magnetron sputtering. For the purpose of this review, it is sufficient to give general guidelines with respect to the required ion energies for ion-assisted film growth.
Brice et al. developed an analytical model for ion-assisted growth with the fundamental assumption that in ion-assisted film growth (epitaxy) the ion bombardment has to provide a sufficient density of mobile surface defects, however, without generating damage (defects) in the underlying bulk part of the growing film.Reference Brice, Tsao and Picraux26 Using a binary collision approximation and a universal screened Coulomb interaction potential between projectiles and target atoms, Brice and coworkers calculated the so-called mass–energy windows for the beneficial action of ion bombardment during the (epitaxial) growth of germanium, silicon, and carbon (graphite and diamond) layers. Taking into account that the number of bonds of a surface atom is lower than that of a bulk atom, the authors assign the defect formation energy E d(surf) in the first monolayer to only half of the defect formation energy E d(bulk) of a bulk atom. This is a plausible assumption since the atoms of the first monolayer have a lower number of neighboring atoms than atoms in the bulk.
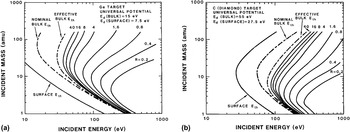
On the basis of this assumption, the ratio R of surface to bulk defect generation was calculated for different energies E p and masses M p of the projectile (atoms or ions). The used defect formation energies in the surface (bulk) of the different semiconductors were: 7.5 (15) eV for germanium, 11 (22) eV for silicon, 12.5 (25) eV for carbon (graphite), and 27.5 (55) eV for carbon (diamond). Figure 5 shows contour plots of constant R (0.2 < R < 40) in the E p − M p plane for the semiconductors germanium and carbon (diamond). It can be seen that the energy window for a beneficial role of ion bombardment—the area between the surface energy threshold and the effective bulk threshold—widens with increasing mass of the bombarding ion. The effective bulk threshold energy takes into account the energy loss of the projectiles in the first monolayer.
Plot of the contour lines of constant values of the ratio R of surface to bulk vacancies for the bombardment of (a) germanium and (b) diamond by different ions in the energy range from 10 to 1000 eV.Reference Brice, Tsao and Picraux26 The windows for the beneficial action of the ion bombardment on the film growth lie between the lines marked by “surface E th” and “effective bulk E th.” The width of this window widens with increasing mass of the bombarding projectile and shifts with increasing defect formation energies to higher projectile energies.

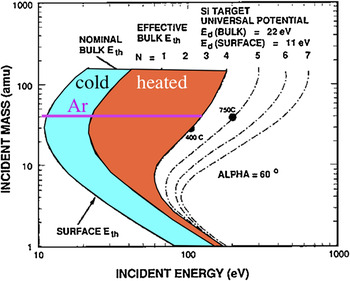
Because of the higher defect formation energy of diamond, the energy window shifts to higher energies for this material. Since the calculations of Brice et al. rely on certain assumptions, it can be regarded only as a guideline for investigating and optimizing ion-assisted thin film growth. For instance, the assumption that a surface atom exhibits only half of the defect formation energy of an atom in the bulk is a crude estimation; even the bulk defect formation energies are not available for many materials, especially for compound semiconductors. Marton collected bulk defect formation energies from literature,Reference Marton and Rabalais61 which exhibit a quite large scattering. Another point is the role of the substrate temperature and the flux of the assisting atoms or ions. At higher substrate temperatures, self-annealing of defects can occur, which was also discussed by Brice et al. Figure 6 shows the effect of an increased substrate temperature for the case of ion-assisted silicon epitaxy. One can see that a higher substrate temperature allows damaging a thicker part of the growing film (up to four monolayers), thus extending the energy window further. For Ar ions, an energy window from about 10 to 125 eV is estimated for a substrate temperature of about 400 °C, which fitted quite well to experimental data. The role of ion or atom assistance on structural features of thin films was earlier qualitatively visualized by the well-known structure–zone diagrams of ThorntonReference Thornton, Huggins, Bube and Roberts22 and McKenzie et al.,Reference McKenzie, Marks, Guan, Pailthorpe, McFall, Yin, MacDonald, Taglauer and Wandelt23 recently generalized to high normalized energy fluxes by Anders.Reference Anders62
Plot of the regions in an ion–mass–energy diagram for the ion-assisted growth of silicon, where different numbers of monolayers are influenced by the energetic bombardment of the growing film (modified after Brice et al.Reference Brice, Tsao and Picraux26). For a cold substrate (about room temperature), only the first monolayer can be tolerated to be influenced by the ions. Heated substrates can accommodate a larger number of monolayers to be damaged by the energetic ions, due to self-annealing. Therefore, the mass–energy window is broader (shown in red) than for a cold substrate (colored in turquoise). The energy window for Ar ions (thick horizontal line) extends from about 10 to 25 eV for a cold substrate and from 10 to 125 eV for a heated substrate (400 °C).

Summarizing, we can cite Brice and coworkers: “...an important feature of ion-beam-assisted epitaxy lies in the capability for providing an appropriate density of mobile surface defects while at the same time avoiding (or minimizing) the introduction of damage in the underlying bulk material.”Reference Brice, Tsao and Picraux26
To apply these guidelines to TCO materials, one needs first of all defect formation energy E d values for these materials or at least for oxides. Marton gave E d values for ZnO, which are between 30 and 57 eV for both atoms (Zn and O). Recently, Wendler and coworkers performed a comprehensive study of the defect formation in ZnO single crystals,Reference Wendler, Bilani, Gärtner, Wesch, Hayes, Auret, Lorenz and Alves63 which yielded E d(Zn) = 65 eV and E d(O) = 50 eV, i.e., confirming roughly the values listed by Marton in 1994. These values are comparable to that of diamond used by Brice et al. (see Fig. 5). Therefore, in a first approximation, the energy window for ZnO and other TCO films should be in the range of 30–150 eV (room temperature) and 30–250 eV (400 °C) (see Fig. 5 and Fig. 6).
V. NEGATIVE ION EFFECTS IN TCO FILMS
Transparent conductive oxides can be prepared by a large variety of deposition methods (see for instance the reviewsReference Ellmer, Klein and Rech1, Reference Ginley, Hosono and Paine4). Soon after the first TCO films were prepared, sputtering was found to give TCO films of high quality.Reference Rozgonyi and Polito11 Another important step was the introduction of magnetron sputtering in the 1970s, which increased the deposition rates significantly and further improved the electrical properties of TCO films.Reference Hata, Minamikawa, Noda, Moromoto and Hada12
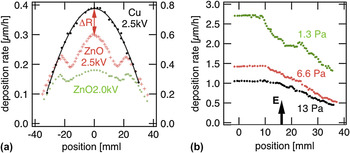
Tominaga et al. systematically investigated the origin of the resputtering of ZnO films,Reference Tominaga, Ueshiba, Shintani and Tada13 which were attributed to the bombardment by energetic atoms or ions, impinging on the growing ZnO films. They observed deposition rate dips (see Fig. 7) at substrate positions opposite to the erosion areas of the targets, suggesting that these are due to energetic particle bombardment from the target. Examples of such deposition rate dips are displayed in Fig. 7 for a ZnO target, sputtered both by diode as well as planar magnetron sputtering. It can be seen that the depth of these dips ΔR depends on the discharge voltage (i.e., the particle energy) and on the sputtering pressure. On the other hand, the rate distribution for a copper deposition [Fig. 7(a)] displays a Gaussian-like shape, typical for the rate distribution of a diode sputtering discharge, when no etching occurs (due to the low electron affinity of Cu). Figure 7(b) shows the radial rate distributions for a planar ZnO target (magnetron) for different sputtering pressures. It shows a decreasing depth of the dips in front of the erosion groove (marked by “E”) with increasing pressure. This can be explained by an at least partial thermalization of the energetic species on their path from the target to the substrate, when the pressure is sufficiently high.
Radial deposition rate distributions of ZnO (and Cu) films deposited by (a) DC diode and (b) planar magnetron sputtering from a copper target and a ceramic ZnO target (data taken from Tominga et al.Reference Tominaga, Ueshiba, Shintani and Tada13). In (a) Cu and ZnO (two different discharge voltages) films are compared, while (b) shows the influence of the sputtering pressure on radial distributions of ZnO films. The discharge voltage V t of the planar magnetron is with 280 V much lower than that of the diode discharge. “ΔR” in (a) is the missing ZnO deposition rate due to resputtering by energetic oxygen and “E” in (b) marks the radius of the erosion area of the magnetron.

By ingenious measurements with a retarding field analyzer, Tominaga et al.Reference Tominaga, Iwamura, Shintani and Tada64 could demonstrate a strong correlation between the reduction of the deposition rate and a large flux of high-energetic particles, however, excluding high-energetic electrons. Furthermore, Tominaga et al. found a strong correlation of the ZnO crystallite orientation with the flux of high-energetic particles.
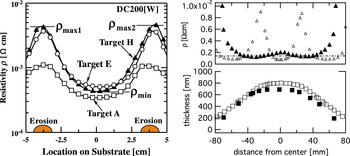
Minami and coworkersReference Minami, Nanto and Takata65, Reference Nanto, Minami, Shooji and Takata66 were the first to report a strong lateral variation of the resistivity of ZnO films deposited by RF magnetron sputtering. Later, this was reproduced also by Tominaga et al.Reference Tominaga, Yuasa, Kume and Tada67 As Minami et al. showed, the resistivity increased significantly in the substrate areas positioned directly in front of the erosion grooves of the ZnO target. A recent example of such radial resistivity variations reported by Minami et al.Reference Minami, Oda, Nomoto and Miyata68 is displayed in Fig. 8(a). It can be seen that the resistivity increases by up to an order of magnitude between the substrate position in front of the target center and the position in front of the erosion groove. This nonuniformity depends on the preparation (sintering) of the ceramic targets, especially on its oxygen content. Kluth et al.Reference Kluth, Schöpe, Rech, Menner, Oertel, Orgassa and Schock69 also studied lateral resistivity profiles of the resistivity ρ for DC magnetron sputtering from a rectangular, ceramic ZnO:Al target, which are displayed in Fig. 8(b). These authors investigated the resistivity variations both for a new (flat) and an old (eroded) target and observed, quite surprisingly, completely different resistivity profiles.Reference Szyszka, Ellmer, Klein and Rech70 Although the flat target exhibits the well-known resistivity maxima opposite to the erosion grooves, the old target showed a quite flat ρ profile, with shallow minima opposite to the erosion grooves. Horwat and BillardReference Horwat and Billard71 also measured radial resistivity distributions for reactive magnetron cosputtering from a Zn and an Al target in Ar/O2 gas mixtures with unbalanced magnetrons. They observed an extremely large variation of the ZnO:Al film resistivity (six orders of magnitude) with the oxygen content in the gas for substrates positioned directly in front of the target centers, which was only tentatively speculated to be due to an interplay “of the instantaneous deposition rate, of the flow of energetic oxygen atoms and of the oxygen reactivity.”
Lateral resistivity (and thickness) distributions of magnetron sputtered ZnO:Al films from two different research groups. (Left) DC magnetron sputtering from different circular ZnO:Al targets (Ø 150 mm) in pure argon atmosphere at a pressure of 0.4 Pa.Reference Minami, Oda, Nomoto and Miyata68 Opposite to the erosion areas on the target a much higher resistivity is measured. (Right) Resistivity and thickness distributions of DC magnetron sputtered ZnO:Al films measured perpendicular to the long axis of a rectangular magnetron (data taken from Refs. Reference Kluth, Schöpe, Rech, Menner, Oertel, Orgassa and Schock69,Reference Szyszka, Ellmer, Klein and Rech70). The resistivity profiles are shown for a flat, new (∆) and an old, eroded (▲) target. The thickness profiles are almost identical for the new and the old target. For comparison, the mean resistivity under dynamic deposition conditions (moving substrate) is shown as a dot-dashed line.

Although such lateral variations have been reported mostly for ZnO films, it was occasionally also found for other TCO materials. Ishibashi et al.Reference Ishibashi, Higuchi, Ota and Nakamura72, Reference Ishibashi, Higuchi, Ota and Nakamura73 performed a comprehensive study of the influence of deposition parameters on the lateral resistivity distributions of ITO films. They also observed resistivity maxima at substrate positions in front of the erosion grooves. With increasing substrate temperature (room temperature to 350 °C) and decreasing discharge voltages (450 down to 80 V), the resistivity distributions became flatter and the resistivities decreased significantly. Ishibashi and coworkers discuss their observed resistivity maxima as due to the effect of the bombardment by negative ions, in accordance with the earlier results of Tominaga et al. Interestingly, the measurement of carrier concentrations and mobilities shows (at least for the ITO) that the oxygen bombardment does not influence the mobility but almost only the carrier concentration, which decreases with increasing discharge voltage.
Later, May and StrümpfelReference May and Strümpfel74 reported lateral resistivity distributions for DC and MF sputtered ITO films. In their case, resistivity maxima were observed opposite to the target center, which was not understood at that time, when compared to the resistivity profiles of doped ZnO films and to the results of Ishibashi et al.
Although quite a lot of data on the influence of negative ions on the electrical properties of TCO films were collected in the last three decades, no comprehensive picture on its role for the film growth emerged until recently. As to the defect formation mechanism, only few papers deal with the microscopic origin of defects by energetic bombardment. For instance, Buthkuzi et al.Reference Butkhuzi, Bureyev, Georgobiani, Kekelidze and Khulordava75 report on the annealing of oxygen vacancies by atomic oxygen irradiation during epitaxial ZnO growth, leading to highly ohmic ZnO films. By using x-ray absorption near-edge structure measurements of reactively sputtered ZnO:Al films, Horwat et al.Reference Horwat, Jullien, Capon, Pierson, Andersson and Endrino76 found indications that an increased octahedral configuration of Al and O atoms leads to the electrical deactivation of Al as a dopant.
As reported above, the reason for these variations of the electrical properties of ZnO:Al films is the bombardment by energetic oxygen species (ions and atoms). Therefore, these observations have to be related to changes in the energetic film bombardment, i.e., to variations of the energy and/or fluxes of these species, depending on parameters like target erosion, target conductivity, discharge voltage, etc. A first hint is the observation that the electrical TCO film properties are improved by reducing the discharge voltages. This was observed for instance by Ishibashi et al.Reference Ishibashi, Higuchi, Ota and Nakamura72 and Utsumi et al.Reference Utsumi, Matsunaga and Takahata77 for ITO films and by Tsukamoto et al.Reference Tsukamoto, Watanabe, Saito, Sato, Oka and Shigesato78 for ZnO:Al films.
An indirect confirmation of negative ion bombardment was reported recently by Gassenbauer et al.Reference Gassenbauer, Wachau and Klein79 by a surface sensitive analytical technique. They deposited Al2O3 films at room temperature by reactive magnetron sputtering (RF plasma excitation) from an Al target in Ar/O2 (95/5%) onto ITO films, deposited by RF magnetron sputtering from a ceramic ITO target. By in situ photoelectron spectroscopy (XPS) the authors observed a downward shift of the Fermi level in the ITO after the first few Al2O3 monolayers were deposited, which indicates a reduced carrier concentration at the surface of the originally degenerately doped ITO films (N ≫1019 cm−3). The explanation given by the authors is a subplantation of oxygen ions (originating from the Al target surface), compensating the tin dopants.Reference Gassenbauer, Wachau and Klein79 Unfortunately, the authors did not investigate the radial dependence of this effect.
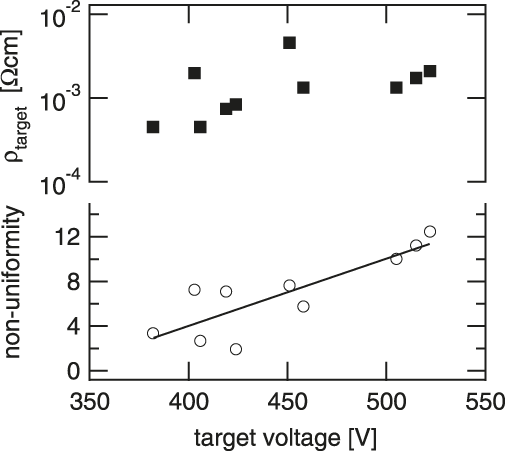
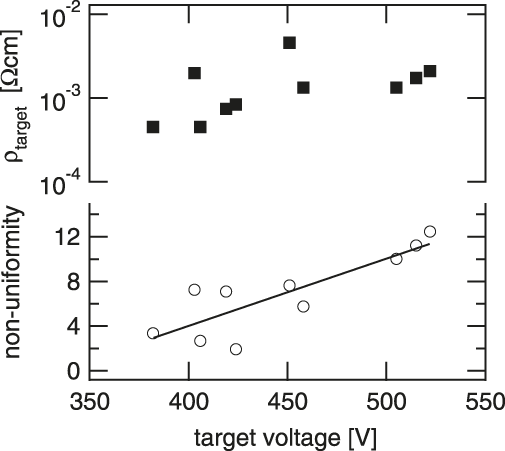
The decisive role of the discharge voltage is supported by the above-mentioned systematic investigation of Minami et al. of the resistivity nonuniformity for 10 different targets, summarized in Fig. 9.Reference Minami, Oda, Nomoto and Miyata68 It can be seen that the nonuniformity, i.e., the relative difference between the resistivity opposite to the center and the erosion groove ((ρ max − ρ min)/ρ min) increases with increasing target voltage, i.e., with increasing energy of negative oxygen ions, which are accelerated in the cathode sheath. Interestingly, the discharge voltages of the differently prepared (sintered) targets were correlated with the target resistivities and hence with its oxygen contents (see Fig. 9).
Radial nonuniformity [(ρ max − ρ min)/ρ min] of magnetron sputtered ZnO:Al films versus the target voltage. The films were deposited from 10 different targets, which exhibited different resistivities, which are also plotted versus the target voltages (data taken from Ref. Reference Minami, Oda, Nomoto and Miyata68).
In another experiment, Minami et al. showed that the nonuniformity of the ZnO:Al films ((ρ max − ρ min)/ρ min) depends also on the discharge mode of the magnetron, i.e., it is higher for DC excitation in comparison to RF plasma excitation. This again can be explained by the target voltages, which are significantly lower for RF excitation compared to DC excitation (see the IED functions in Fig. 2).
As the result of Kluth et al.Reference Kluth, Schöpe, Rech, Menner, Oertel, Orgassa and Schock69 has shown, a strong geometrical influence of the target shape (depth of the erosion groove) exists.
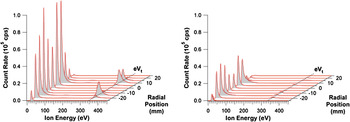
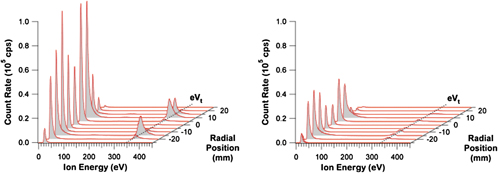
Recently, we could prove the hypothesis that this is due to a variation of the lateral distribution of high-energetic negative oxygen ions impinging on the substrate.Reference Welzel and Ellmer80Figure 10 displays radially resolved IEDs measured for a new (flat) and an eroded zinc target, which was reactively sputtered in a gas mixture Ar:O2 = 1:1. It can be clearly seen that, for the eroded target, the intensity of high-energy O− ions decreased significantly, which can be explained by the shape of the erosion groove and the acceleration of the ions perpendicular across the cathode sheath (for details see Ref. Reference Welzel and Ellmer80). This means that the radial distribution of high-energetic oxygen ions is more focused on the growing film directly in front of the plasma torus for the new flat target, where the target erosion groove develops during the lifetime of the target. For an eroded target, due to the Gaussian-like shape of the erosion groove, the resulting distribution of negative ions on the substrate is broadened leading to a lower local flux on the growing film, and this can explain, at least qualitatively, the reduced effect of negative ion bombardment for an eroded target, i.e., the reversal of the lateral resistivity distributions for ZnO:Al films, observed by Kluth et al. (see above).
Radially resolved IEDs of negative oxygen ions (O−) in a magnetron discharge from a metallic zinc target.Reference Welzel and Ellmer80 (Left) New, flat target, (right) old, eroded target. Parameters: gas mixture, Ar:O2 = 1:1; total pressure, 0.5 Pa; discharge power, 50 Wdc. The dotted line (eVt) marks the energy corresponding to the acceleration of ions from the target toward the substrate.

A second effect also contributes to a reduced negative-oxygen-ion effect; this is the reduction of the discharge voltage with increasing depth of the erosion groove, which reduces the maximum energy of the oxygen ions. The reduced target voltage is caused by the higher magnetic field on the target surface since its distance to the magnets is reduced with increasing target erosion. Recently, the lateral distributions of negative oxygen ions were measured and simulated by Mahieu et al.,Reference Mahieu, Leroy, Aeken and Depla81 which support our own measurements for the reactive sputtering from a Zn target.Reference Welzel and Ellmer80
Mahieu and coworkers measured laterally and angle resolved IEDs, both for a planar (strongly unbalanced) and a rotatable magnetron. The measured IEDs of O− were compared to simulated distribution functions, using their binary collision Monte Carlo code (SIMTRA), which calculates the energy loss of energetic particles on its way from the target to the growing film. Experiment and simulation showed a very good agreement.
They could correlate the bombardment of the grown Al2O3 and Y2O3 films by high-energetic negative oxygen to optical and structural properties of their films.
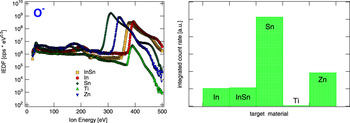
After having seen the important role of negative ions for the electrical and structural properties of ZnO and ITO films, the question is how the IEDs of negative oxygen ions look like for the other TCO materials. We performed such measurements for metallic targets of In, InSn10wt%, Sn, Ti, and Zn for reactive magnetron sputtering in an Ar/O2 mixture with 50% O2, which are displayed in Fig. 11 on a logarithmic scale. The targets were all new, i.e., had a flat, uneroded surface to get rid of the problem of the influence of the target age on the radial flux distribution of negative ions, discussed above.
(Left) The IED functions (note the log intensity scale) of five metal targets (In, InSn10wt%, Sn, Ti, and Zn), which can be used to deposit the well-known transparent conductive oxide materials In2O3, indium–tin oxide, SnO2, TiO2, and ZnO. It can be seen, that the intensity of the high-energetic part of the IEDs varies significantly for the different targets (up to two orders of magnitude). (Right) The integral count rates of the high-energetic parts of the IEDs for the different targets from the left figure on a linear scale. Parameters: target-to-substrate distance, 6 cm; target state, new (flat); thickness, 5 mm; sputtering pressure, 0.5 Pa; Ar:O2 = 1:1, sputtering power, 50 Wdc.

It can be seen clearly that high-energetic negative oxygen ions are emitted from every target material. The peak maxima occur at different energies, which can be explained by the different discharge voltages of the different targets. Even more important are the significant differences in the intensities for the different target materials. The most striking difference can be seen between the Sn and the Ti target, where Ti shows a lower flux of high-energetic negative oxygen ions by a factor of about 100 compared to Sn. Interestingly, this correlates also with the ion energy, i.e., the target voltage, which is lower for the tin target. This means, lower target voltages are correlated with higher fluxes of negative oxygen ions for the same discharge power. This confirms, at least qualitatively, the above discussed results of Mahieu et al.,Reference Mahieu, Leroy, Aeken and Depla81 who established an empirical relation between the negative oxygen ion flux and the discharge voltage for 13 different target materials (unfortunately, of the TCO film targets, they only investigated Ti). The relation found by Mahieu et al. is

where γ O- is the flux of high-energetic negative oxygen ions, N(O) the number of sputtered oxygen atoms (calculated by SRIM), V dis the discharge voltage, and c is a constant.
Our comparison of the different targets, which can be used for the deposition of TCO thin films, sheds light on an empirical fact, which was known for a long time, namely, that magnetron sputtered SnO2 films (doped by antimony or fluorine,Reference Mientus and Ellmer82) cannot be prepared with low resistivities by magnetron sputtering, both for reactive sputtering from metallic targets as well as for sputtering from SnOx:Sb targets. For instance, the minimum resistivities of magnetron sputtered SnO2:F films are of the order of only 10−2 Ω·cm, compared to about 5 · 10−4 Ω·cm for SnO2:F films deposited by atmospheric pressure chemical vapor deposition (Asahi U glass, Tokyo, Japan). It is quite plausible that this could be due to the high flux of negative oxygen ions emitted from the Sn target and impinging on the growing films. Last, but not least, negative-oxygen-ion effects were not reported for the deposition of TiO2 films, which seems to be now clear, due to the low emitted flux, as shown in Fig. 11.
VI. SUMMARY AND OUTLOOK
Negative oxygen ions play an important role for the magnetron sputtering deposition of transparent conductive oxides due to their origin at the target surface and hence their high energies, when impinging on a growing film. Though the defect formation energies of the oxidic semiconductors are quite high, crystallographic defects can be generated by these high-energetic oxygen ions (atoms), which can significantly influence the structural and electrical film properties. Another effect of the bombardment by energetic ions is the subplantation of oxygen below the first monolayers of the growing film, thus increasing the oxygen content of the grown films. Normally, this leads to a decreased carrier concentration of the TCO films.
In the last decades, it has been demonstrated that the high-energetic negative ion (or atoms) bombardment is mostly detrimental to the film properties, especially in the case of semiconducting thin films.
Recently, the ionic species, their fluxes, and energies have been measured by energy-resolved mass spectrometry at the substrate position in a magnetron discharge for a variety of metal targets in an Ar/O2 atmosphere. It has been found that a correlation between the secondary electron emission coefficient and the amount of negative ions emitted from the target surface exists.
The total flux of negative ions leaving the target surface cannot be influenced much since it is mainly determined by the target material, i.e., the type of film, that has to be deposited and by the oxygen in the sputtering atmosphere or in the target material.
To diminish the influence of negative ions on the TCO film growth, two possibilities exist:
no direct sight of the targets by the substrates, which can be realized in the following ways:
(i) perpendicular arrangement of the substrates relative to the target planeReference Minami, Nanto and Takata65, Reference Nanto, Minami, Shooji and Takata66;
(ii) facing-target sputteringReference Matsuoka, Hoshi and Naoe83, Reference Iwase, Hoshi and Kameyama84;
(iii) gas flow sputteringReference Takeda, Sato, Iwabuchi, Yoshikawa and Shigesato85.
(1)
(2) reduction of the target voltage (decrease of the energy of the negative ions), which was done already by the following methods:
(i) RF plasma excitation or a combination of DC and RFReference Cebulla, Wendt and Ellmer86, Reference Bender, Trube and Stollenwerk87;
(ii) hollow-cathode enhanced magnetron sputteringReference Cuomo and Rossnagel88, Reference Klawuhn, D’Couto, Ashtiani, Rymer, Biberger and Lévy89;
(iii) use of rotatable magnetrons, which typically exhibit lower discharge voltages, due to its high magnetic fields.Reference Zhu, Bunte, Hüpkes, Siekmann and Huang90
Rotatable magnetrons, which are increasingly used in industry,Reference Nadel, Greene, Rietzel, Perata, Malaszewski and Hill32 are suited for the reduction of the negative ion effects because the ions are emitted inclined to the substrate normal and typically their path length to substrate is such increased (in dynamic deposition) or they are not directed to an opposite substrate at all.
In the light of this review, the relatively new, exhaustively investigated magnetron sputtering technique of high-power impulse magnetron sputtering (HIPIMS)Reference Brenning, Axnäs, Raadu, Lundin and Helmersson91 is not well suited for low-damage depositions of TCO or other semiconducting films since HIPIMS is just characterized by very high discharge voltages (more than 1000 V) in the short pulse duration, accompanied by high negative ion energies.
To summarize, in the future, deposition methods have to be optimized or newly developed, which operate at lower target voltages to reduce the maximum energies of negative ions (atoms) from the target surface.
From a basic point of view, the physical understanding of the negative ion formation at target surfaces has to be improved considerably, which requires fundamental investigations of the fluxes (mass, energy, and angle resolved) of all species arriving at a growing film, for instance, by energy-resolved mass spectrometry and absolute flux measurements, e.g., by retarding field analyzers.