


Introduction
Most of the studies on snow friction have been done on friction between snow and other materials (Reference Lang and DentLang and Dent, 1982), in particular in relation to ski and sled sliding. In contrast, friction between two snow bodies has received little attention, even though it is of basic importance in avalanche dynamics. In fact, the frictional force acting between a moving snow avalanche and its bed has been recognized as one of the main factors influencing the motion of an avalanche. In the present study snow-to-snow friction was estimated from the measurement of the sliding velocity of snow blocks on a natural snow slope.
Friction Resistance
The friction resistance force acting on a moving avalanche has traditionally been expressed as a truncated power series of its velocity ν (Reference SalmSalm, 1966), according to the equation

where A is the dry friction force, B is the viscous friction coefficient, and C is the turbulent friction coefficient.Dry friction, as often used in wear and tribology science, is the contact friction between dry solids in the absence of a lubricant. Dry friction includes Coulomb friction and adhesion; the former is friction proportional to the normal force, and the latter is a force proportional to the contact area, so that

where μc is the Coulomb friction coefficient, N is the normal force acting on the surface, a is the adhesion coefficient (mass per unit area), g is the acceleration due to gravity, and S is the surface area. This is equivalent to the Mohr-Coulomb definition of shear strength of materials

where τ is the shear strength, H is the cohesion strength, and ϕ the angle of internal friction.
If snow is considered to behave as a fluid with a certain kinematic viscosity, ν, its viscous coefficient, can B, be expressed as
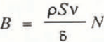
where δ is the shear layer thickness and ρ the snow density.
The turbulent resistance, Cν2, includes air drag and ploughing effect as well as the turbulent internal friction of the avalanche, but in fact both compression and shearing of snow on the track also take place, and for this a square-of-velocity model may be inappropriate.
Previous Work
Reference InahoInaho (1941) was the first to publish snow-to-snow friction data. He slid blocks of granular snow over slopes covered with granular snow at temperatures near to 0°C and at velocities of up to 4 m/s. Inaho considered both Coulomb and adhesion friction forces, as represented in the equation of motion

where m is the block mass, ν is the velocity, t is the time, and α is the slope angle.
By combining both Coulomb forces and adhesion effects into one total dry friction coefficient, μ, the equation below can be applied

for which values of μ ranging from 0.45 to 0.64 have been obtained. Inaho presented Coulomb coefficients ranging in value from 0.42 to 0.62, and his adhesion coefficients varied from 1.3 to 8.7kg/m2, with a mean of 5.1 kg/m2.
Reference Bucher and RochBucher and Roch (1946) pulled blocks of wet granular snow over a flat surface of wet granular snow at velocities in the range 0.2–2.4m/s, and obtained friction coefficients ranging from 0.23 to 0.85. Their data also gave a viscous coefficient per unit area of 475 Νs/m3. For movement at constant speeds this data is in agreement with the Mohr-Coulomb theory. Adhesion coefficients of 27 and 157kg/m2 were obtained for these experiments, which are larger values than Inaho reported. These high values can be explained by the slow friction speeds involved, in fact the Mohr-Coulomb criteria have traditionally been applied in soil mechanics at static or low deformation rates.
Japan National Railways (1961) slid snow blocks down slopes of either granular or compacted snow, sometimes covered with new snow, at speeds up to a maximum of about 20 m/s. Friction coefficients obtained as a result of such experiments ranged from 0.55 to 1.00, the highest values including ploughing effect, with mean dry friction of 0.71 for compact snow(ρ > 350 kg/m3) and 0.69 for granular snow(ρ > 400 kg/m3).
Reference SommerhalderSommerhalder (1972) measured shear and normal stresses for avalanches flowing over snow sheds in the Swiss Alps by installing mechanical devices over the breadth of gallery roofs. Over several winters, maximum values of shear and normal stresses were recorded; from these friction coefficients were computed. Friction coefficients ranged from 0.05 to 0.65, with a mean of 0.27 for the breadth of the gallery.
Reference Martinelli, Lang and MearsMartinelli and others (1980) filmed a dry-slab avalanche over wet snow in the run-out zone and calculated the front velocity from time-distance curves. By regarding the avalanche as a rigid body they obtained friction coefficients that ranged from 0.13 to 0.32.
Field Measurements
Measurements of friction coefficients were carried out by allowing snow blocks to slide down the natural snow cover at Toikanbetsu, northern Hokkaido. In all, 27 runs were carried out on different types of dry snow.A typical block size used had the dimensions of 0.37 m × 0.11m× 0.23 m and the average mass of blocks was 2.5 kg. Each block was accelerated on a wooden chute, the bottom of which was covered with a very slippery plastic film, and then slid on to the natural snow surface. The motion of the blocks was filmed with a TV camera with 1/1000 s shutter speed at a rate of 60 frames/s. Density and hardness of the snow on the track were measured before and after each run, as was snow temperature.Blocks of both compact and granular snow were used.
All the results of these measurements are summarized in Table I. Runs 1/87 to 8/87 and Al to A8 were on the natural snow cover, mostly over new snow,and the blocks decelerated to a stop. Runs B0 to B5 took place on a fixed slope of 29° after removal of successive snow layers down to 65 cm which gave rise to a wide range of snow conditions. Blocks on these runs decelerated, but did not come to a stop, within the run-out. Runs C2 to C7 were on a fixed slope of 42.5° covered with new snow which was compacted artificially. The same track was used for all runs and the blocks accelerated down the slope. Three types of behaviour were clearly distinguished:
-
Type I: No ploughing, or only very little ploughing, occurred (14 runs).
-
Type II: Almost uniform ploughing occurred (five runs), and in some cases a slightly wave-like ploughing pattern was noted along the track.
-
Type III: Sinking occurred, the block ploughing deeper into the snow as it slid along the run-out (eight runs) (Fig. 1).
Type I behaviour occurred mainly over hard snow and type III behaviour was observed mainly over soft snow (Fig. 2). By ploughing we mean that the snow surface was lower after the passage of the block than it had been before, due mainly to compression under the sliding block after which shearing occurred. The amount of snow removed from the sides and the front of the block was small.
General view of a typical sinking run (type III behaviour).

Overburden pressure plotted against initial hardness on the track,showing the three different cases observed: no ploughing (type I behaviour), constant ploughing (type II behaviour), and sinking (type III behaviour).

Analysis
By analysing the video recording with an X-Y coordinator, time-distance curves were obtained for each run. A fourth-degree time polynomial was fitted to the distance data, and expressions for velocity and acceleration were obtained separately for each time and distance. The time interval was usually 0.15 s, which gave a smooth fit to the fourth-degree polynomial equation. The apparent friction coefficient,μΑ, is represented by

where dν/dt is the measured acceleration.
Measured values of dν/dt may include errors due to air drag.This air drag, F a, can be separated into pressure drag, S p, acting on the front area of the block with a drag coefficient, C p, and surface drag, S S,acting on the lateral surfaces with a different drag coefficient, C s. Thus

where ν is the velocity of the block and ρ a is an air-density value of 1.3kg/m3.
The highest velocity for our runs was 7 m/s. Considering the kinematic viscosity of air, va to be 1.47 × 10⁻⁵m2/s and a characteristic block dimension to be 0.3 m the Reynolds number, Re, was calculated as Re = 1.4 × 10⁵.Standard values of C p for this order of Re are less than 1, and C S is less than 0.1. Adopting these as upper limits, the air drag for a velocity of 7 m/s amounts to 1.2 N, equivalent to 6.5% of the total drag, reducing the apparent friction coefficient in 0.08. Because we consider that this is an upper limit and that the errors involved in our estimate of μΑ are in the order of 0.05, correction for air drag is not considered to be necessary.
Type I behaviour — no ploughing
In these runs ploughing was negligible andμΑ value obtained was almost constant through the whole run-out. We have assumed that only the dry friction is operating (Fig. 3). For runs C2 to C7 snow conditions were identical. When μΑ was plotted against S/mcosα with μC = 0.58 and a = 2.2kg/m2 (Fig. 4), a linear fit was obtained, as would be expected from Equation (6). If we consider all the 14 runs including each variety of snow conditions, a mean Coulomb friction value of 0.62, and a mean adhesion coefficient value of 2.1 kg/m2, are obtained. The adhesion value is rather similar in magnitude to that obtained by Inaho. The physical origin of the adhesion is at present not clear, but it should be noted that the value of ag is roughly 20 N/m2, which is between two and four orders of magnitude smaller than the shearing strength of coherent snow.
Apparent friction coefficient plotted against velocity for thenon-ploughing runs (type I behaviour).

Determination of adhesion coefficient, a, and Coulomb friction coefficient, μC, for run C. R is the correlation coefficient. μC was obtained by extrapolating the line to the ordinate axis and a corresponds to the slope.

Type II behaviour - constant ploughing
In these runs a shear layer developed between the snow surfaces along the run-out. Figure 5 shows that μΑ increased almost linearly with velocity, suggesting a viscous resistance. Thus, μΑ can be separated into a dry-friction coefficient (μ) and a linear velocity term which correspond to the terms A + Bν of Equation (1). Linear fits yielded μΑ values of between 0.57 and 0.86 at zero velocity (Table II); these values lie in the range of the dry-friction coefficients found in the non-ploughing cases. Viscous coefficients per unit area, B/S, ranged from 11 Νs/m3 to 75 Ν s/m3, and are smaller than the value of 475 Ν s/m3 recorded by Bucher and Roch. This is readily explained by considering that in our experiments snow had a higher degree of fluidization and therefore a lower viscosity, and also a better developed shear layer than that of the snow previously studied. Reference Lang and DentLang and Dent (1983) dragged sled runners coated with sand over hard sintered snow and found that shear stress increased linearly with velocity, with B/S values ranging from 132Ns/m3 to 197 Ν s/m3.The linear fits obtained by Reference Bucher and RochBucher and Roch (1946) and Reference Lang and DentLang and Dent(1983) are shown in Figure 5. Values of all viscous coefficient are summarized in Table II.
Apparent friction coefficient plotted against velocity for the constant ploughing runs (type II behaviour).

Assuming δ to be one-third of the average ploughing thickness, values of kinematic viscosity were calculated to be in the order of 4 × 10⁻⁴ to 3 ×l0−3m2/s. These values are in agreement with the data from Reference Bucher and RochBucher and Roch (1946) and from Reference Lang and DentLang and Dent (1983).Although the above-estimated kinematic viscosity is one or two orders of magnitude greater than the experimental values obtained by Reference Nishimura and MaenoNishimura and Maeno (1988) for snow particles of 0.5 mm diameter, it agrees fairly well with the 1 × 10⁻³ to 9 ×l0−3m2/s obtained by Reference Maeno, Nishimura and KanedaMaeno and others (1980)for fluidized snow of 2 mm particle diameter.
Type III behaviour — sinking
As shown in Figure 6, μΑ values for type III behaviour are greater than unity and decrease with velocity, in contrast with those of type II, implying that the ploughing effect is very important in causing sinking. The force due to this ploughing effect has been estimated by use of a crude model of plastic deformation. From block-velocity data and density measurements made before and after each run, extremely high values were obtained, sometimes exceeding three times the total drag. In fact, ploughing is a complicated effect which depends strongly on the mechanical properties of snow, and to model it correctly we must also consider snow shearing and compression.
Apparent friction coefficient plotted against velocity for the sinking runs (type III behaviour).


Viscous coefficients for constant ploughing runs (Column headings as indicated in the text.)

Concluding Remarks
The upper value for the dry-friction coefficient used in avalanche dynamics has been taken to be 0.5 (Schaerer, 1975), and typical values range between 0.1 and 0.4. The friction coefficient depends strongly on snow fluidization. At low densities and/or high avalanche speeds it seems reasonable to suggest low values for μ, perhaps as low as 0.1 in the case of a fully developed powder avalanche. In fact Reference SommerhalderSommerhalder (1972) found an average value for μ of 0.27 for flowing avalanches, and Reference Martinelli, Lang and MearsMartinelli and others (1980) found an average value of 0.37 in the run-out for a slab avalanche. In contrast, our values for the dry-friction coefficient obtained for snow blocks running on as now surface are much higher, ranging from 0.57 to 0.84. By averaging dry-friction coefficients reported in previous snow-block experiments, we obtain values of 0.58 (Reference InahoInaho, 1941), 0.47 (Reference Bucher and RochBucher and Roch, 1946), and 0.70 (Japan National Railways, 1961). These values agree well with our results. Our preliminary measurements have confirmed the high friction between isolated snow blocks and smooth snow cover; the situation is considered to be similar to the bed friction of a slab avalanche near its starting zone. In loose-snow avalanches the high degrees of fluidization attained may lead to the low values of friction frequently found in practice.
In our laboratory more detailed measurements are under way in a cold room,as are experiments to generate a torque in a rotating snow block in contact with a loaded snow surface. The latter are being carried out in order to determine more precisely the value of the dry-friction coefficient and the contribution of Coulomb forces, adhesion, viscosity,and other factors to the frictional resistance. The influence of temperature, overburden pressure, and velocity will also be studied.
Acknowledgements
The authors are indebted to the following individuals, all of the Institute of Low Temperature Science, Hokkaido University, for much help in the field work: R. Naruse, K. Nishimura, S. Murakami, Κ. Kosugi,and K. Akagi; and also to R. Nitta of the Forestry and Forest Products Research Institute, Japan, and W. Good and B. Salm of the Swiss Federal Institute for Snow and Avalanche Research for providing valuable information.



