Introduction
The most common nutritional means to enhance the milk conjugated linoleic acid (CLA) content is to use oils or oilseeds rich in polyunsaturated fatty acids (PUFA) in the diet of dairy cows and it is well known that both the amount and type of PUFA supplements influence the ruminal lipid metabolism and the milk CLA production (Dhiman et al., Reference Dhiman, Satter, Pariza, Galli, Albright and Tolosa2000; Bu et al., Reference Bu, Wang, Dhiman and Liu2007). However, there are still important variations in milk CLA responses to lipid supplements, suggesting that, in addition to the amount and type of PUFA supplements, the composition of the basal diet also influences the ruminal lipid metabolism and milk CLA responses to lipid supplements (Chilliard and Ferlay, Reference Chilliard and Ferlay2004; Dewhurst et al., Reference Dewhurst, Shingfield, Lee and Scollan2006).
Numerous studies have compared milk fatty acid (FA) composition in response to variations in forage-to-concentrate (F : C) ratio with various lipid supplements but fewer with supplemental 18:3n-3 (Loor et al., Reference Loor, Ferlay, Ollier, Doreau and Chilliard2005; Flachowsky et al., Reference Flachowsky, Erdmann, Hüther, Jahreis, Möckel and Lebzien2006). In these studies, combinations of the F : C ratio were marked, 65 : 35 v. 35 : 65 and 70 : 30 v. 30 : 70, and a decrease in milk fat yield was observed for high-concentrate diets supplemented with linseed oil, indicating that milk fat depression (MFD) occurred. Increases in milk c9,t11-CLA content were observed after PUFA supplementation and were higher for high-concentrate compared to low-concentrate diets (Loor et al., Reference Loor, Ferlay, Ollier, Doreau and Chilliard2005). Besides the F : C ratio parameter, different forage particle lengths (Soita et al., Reference Soita, Fehr, Christensen and Mutsvangwa2005) as well as different energy sources (maize, wheat, barley, rye or sugar beet pulp) in the concentrate mixture (Loor et al., Reference Loor, Ferlay, Ollier, Doreau and Chilliard2005; Flachowsky et al., Reference Flachowsky, Erdmann, Hüther, Jahreis, Möckel and Lebzien2006; Roy et al., Reference Roy, Ferlay, Shingfield and Chilliard2006) have been used, making comparisons difficult between various milk CLA responses to lipid supplements. Furthermore, the relative amounts of fermentable carbohydrate and fibre in the diet have been demonstrated to alter biohydrogenation pathways and the formation of specific trans-18:1 isomers, therefore altering the milk CLA content (Griinari and Bauman, Reference Griinari and Bauman1999).
In a preliminary experiment, we obtained higher CLA contents with a maize silage-based diet than with a grass silage-based diet (M Focant, unpublished results). Both diets had the same F : C ratio and were supplemented with PUFA and vitamin E. They were formulated to be iso-energy, iso-starch, iso-fat and iso-FA. However, one of the few differences was the fibre content of the forage.
In order to characterise and compare our experimental diets in terms of rumen buffering through saliva, acidotic effect (pH decrease), particle size and physical form of the feeds, we adopted the structure evaluation system developed by De Brabander et al. (Reference De Brabander, De Boever, Vanacker, Boucqué and Botterman1999). These authors considered the structure value (SV) as ‘an expression of the extent to which a feedstuff, through its content and properties of the carbohydrates, contributes to an optimum and stable rumen function’ (De Brabander et al., Reference De Brabander, De Boever, Vanacker, Boucqué and Botterman1999). Therefore, the SV may significantly influence the rumen biohydrogenation and, hence, the CLA content in milk.
Numerous studies have examined the impact of various marked differences in the F : C ratio on FA biohydrogenation and milk fat composition (Loor et al., Reference Loor, Ferlay, Ollier, Doreau and Chilliard2005; Shingfield et al., Reference Shingfield, Reynolds, Lupoli, Toivonen, Yurawecz, Delmonte, Griinari, Grandison and Beever2005; Flachowsky et al., Reference Flachowsky, Erdmann, Hüther, Jahreis, Möckel and Lebzien2006). To our knowledge, the present study is however the first one aiming at studying the milk CLA responses to extruded linseed in cows fed two diets with a modest variation in SV, in situations where both diets provided enough SV and therefore did not induce MFD.
Material and methods
Experimental design, animals and management
Six lactating Holstein cows were blocked for milk yield in two groups of three cows and randomly assigned to a crossover design with two treatments (‘SV 1.50’ and ‘SV 1.73’) and two periods of 21 days. At the onset of the experiment, cows were all in their second lactation, averaged 607 ± 62.4 kg of BW, 186 ± 25.8 days in milk and yielded 21.7 ± 8.71 kg/day of milk (mean ± s.d.). None of the cows was pregnant during the experiment. Cows were housed in individual tie stalls in order to avoid mixing of diets. They were fed individually twice daily at 0830 and 1730 h and had free access to water. Milking took place twice daily at 0730 and 1630 h. The experiment was carried out at the Alphonse de Marbaix research centre (Corroy-le-Grand, Belgium) from February to March 2005 and was approved by the Commission d’Ethique de l’Expérimentation animale of the Université catholique de Louvain.
Experimental diets
Before the experiment, cows were fed a balanced herd diet according to their milk production and specific maintenance needs, according to INRA standards (Institut National de la Recherche Agronomique, 1988).
The ‘SV 1.50’ diet contained maize silage, soya bean meal and urea as additional sources of protein, sugar beet pulp as additional source of energy, extruded linseed as supplemental 18:3n-3 to favour CLA production, a mineral and vitamin mix and a vitamin E preparation to avoid the milk oxidation (Focant et al., Reference Focant, Mignolet, Marique, Clabots, Breyne, Dalemans and Larondelle1998). For the ‘SV 1.73’ diet, wheat straw was added to the ‘SV 1.50’ diet as an additional structure source. Extruded linseed was provided as Nutex Compact, an extruded commercial concentrate (Dumoulin, Seilles, Belgium) made of linseed, wheat, sunflower cake, field beans, BHT, linseed oil and salt (56.0%, 21.0%, 15.0%, 4.5%, 2.0%, 1.0% and 0.5% of total raw materials, respectively).
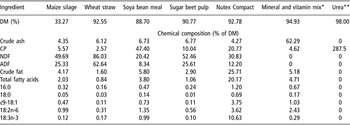
The chemical composition of the diets was calculated from the chemical composition of the ingredients (Table 1). The diets were formulated to cover animal needs according to INRA standards (INRA, 1988) for a cow of 650 kg yielding 25 kg/day of milk. The amounts of the diets were distributed as a restricted total mixed ration in order to control the intakes and were adapted according to the individual milk production of cows.
Dry matter (DM) content and chemical composition of individual feedstuffs

*Declared contents: 21.0% Ca, 7.0% P, 5.0% Mg, 4.0% Na, 0.6% Zn, 0.3% Mn, 0.3% Fe, 0.13% Cu, 600 IU/g of vitamin A, 120 IU/g of vitamin D3 and 0.5 mg/g of vitamin E (Dumoulin, Seilles, Belgium).
**Values from INRA (2007).
Recordings, sampling and analytical procedures
Individual feedstuffs were sampled at the end of each period and analysed for dry matter (DM) and chemical composition. Individual cow intakes during the last week of each period were included in the statistical analysis. Individual cow milk yield was recorded daily during each milking. Means of individual cow milk yields recorded on day 19, day 20 and day 21 of each period were included in the statistical analysis. Milk samples from individual cows were collected on day 19 and day 21 of each period at the morning and evening milkings. The morning and evening milk samples of each of the two days from individual cows were mixed. These samples were used for statistical analysis.
The following analytical procedures were adapted from Pottier et al. (Reference Pottier, Focant, Debier, De Buysser, Goffe, Mignolet, Froidmont and Larondelle2006).
Milk samples were refrigerated at 4°C. A portion of each sample was used for fat (Gerber, Reference Gerber1938) and CP (N × 6.38) analyses (Commission des Communautés européennes, 1985), and the rest of each sample was processed into butter and anhydrous milk fat to allow long-term storage. To obtain anhydrous milk fat, butter was frozen overnight and then melted and centrifuged at 400 × g at 50°C for 10 min. The upper phase was passed through filters (filter type 595; Schleicher and Schuell, Dassel, Germany) filled with anhydrous Na2SO4 as a desiccant at 45°C. The extracted fat was stored at −20°C under N2 until analysis of FA. FA were methylated in a solution of KOH in methanol (0.1 mol/l) at 70°C for 60 min, then in a solution of HCl in methanol (1.2 mol/l) at 70°C for 20 min, and finally extracted with hexane.
Fatty acid methyl esters (FAME) were quantified by a gas–liquid chromatograph (GC Trace ThermoQuest, ThermoFinnigan, Milan, Italy) equipped with a flame ionisation detector, automatic injector and a fused silica capillary column (100 m × 0.25 mm i.d.) coated with a 0.2-μm film of cyanopropyl polysiloxane (CP-Sil 88; Chrompack, Middelburg, The Netherlands) using H2 as the carrier gas operated at a constant pressure of 200 kPa. Injection was on column so as to inject the entire sample into the column head. This injection mode was preferred to the split injection mode because it minimises the risk of discrimination between very different volatile milk-FA. The initial oven temperature was 80°C, increased at 25°C/min to 175°C (held for 25 min), then increased at 10°C/min to 205°C (held for 4 min), then increased at 10°C/min to 225°C (held for 20 min) and finally decreased at 20°C/min to 80°C. The temperature of the flame ionisation detector was maintained at 255°C. Hydrogen flow to the detector was 35 ml/min and airflow was 350 ml/min. Each peak, except that of t10-18:1, was identified and quantified by comparison of retention times with pure FAME standards (Alltech Associates, Deerfield, IL, USA; except CLA isomers from Nu-Chek Prep, Inc., Elysian, MN, USA). Because no commercial standard was available for t10-18:1, the concentration of the corresponding peak was calculated by comparison with the t11-18:1 peak area (by multiplying the concentration of t11-18:1 by the t10 peak area-to-t11 peak area ratio). The validity of this method was verified by applying it to the peak of t9-18:1 and comparing this calculated concentration with the t9-18:1 concentration determined through the use of the appropriate standard. Each FA was expressed as a percentage of FAME reported. The FAME reported (identified) accounted for 91.0 ± 1.42% (mean ± s.d.) of the total measured FAME, as calculated by the ratio between the total area of identified peaks and the total area of identified and unidentified peaks. The analysis method did not allow quantification of 4 : 0, which is present in milk fat at ±3% of the total theoretical FAME (Jensen, Reference Jensen2002). Therefore, the FAME reported would account for ±88% of the total theoretical FAME.
The analysis of the distribution of CLA isomers was performed on a Ag+-HPLC (Gilson, Villiers-le-bel, France) with three columns coupled in series (250 mm × 4.6 mm i.d. ×5-μm particle size, Ag+-impregnated; Chromspher Lipids, Chrompack, Middelburg, The Netherlands) and UV detection at 233 nm. The carrier liquid was acetonitrile and hexane (0.1 : 99.9, vol : vol) ; the flow was 1.06 ml/min and the oven temperature was 25°C. Isomers were identified by comparison of the elution order and retention times of CLA isomers reported in the literature (Sehat et al., Reference Sehat, Kramer, Mossoba, Yurawecz, Roach, Eulitz, Morehouse and Ku1998; Kramer et al., Reference Kramer, Sehat, Fritsche, Mossoba, Eulitz, Yurawecz and Ku1999). Each CLA isomer was expressed as a relative percentage of total CLA isomers. Concentrations of c9,t11-CLA were based on GLC analysis. However, according to the literature, the c9,t11-CLA GLC peak contained c9,t11-CLA and minor proportions of t7,c9 and t8,c10-CLA (Cruz-Hernandez et al., Reference Cruz-Hernandez, Kramer, Kraft, Santercole, Or-Rashid, Deng, Dugan, Delmonte and Yurawecz2006).
Fresh maize silage samples were analysed for DM and lyophilised before analysis of chemical composition. Partial DM of the maize silage was determined by oven-drying at 55°C for 16 to 24 h, analytical DM was then determined on the same maize silage samples. Total DM of the maize silage was calculated by multiplying partial DM by analytical DM. The chemical composition (except for DM) was determined using lyophilised samples. All feed samples were ground in a mill (1-mm screen; Retsch, Dusseldorf, Germany) and stored at 4°C in hermetic boxes until analysis. They were then analysed for DM by oven-drying at 105°C for 16 h (adapted from methods 967.03 and 930.15; Association of Official Analytical Chemists, 1995), crude ash by ashing at 550°C for 16 h (adapted from methods 923.03, 967.04 and 942.05; AOAC, 1995), CP by the Kjeldahl method (N × 6.25) (adapted from methods 981.10 and 991.20; AOAC, 1995), crude fat (Commission des Communautés européennes, 1985), NDF and ADF (Goering and Van Soest, Reference Goering and Van Soest1970). NDF and ADF were determined sequentially and were expressed without residual ash. NDF was analysed without the addition of α-amylase and sodium sulphite. Lipids were extracted following the method of Folch modified by Christie (Reference Christie1982). Methylation and GLC analyses were performed as described for milk samples.
Calculations of structure values
The SV of the maize silage was estimated from its NDF content using the following regression equation (De Brabander et al., Reference De Brabander, De Boever, Vanacker, Boucqué and Botterman1999):

SV of concentrates and supplements were estimated from their NDF and undegradable starch (USt) contents, and their sugar (SU) and degradable starch (DSt) contents, using the following regression equation (De Brabander et al., Reference De Brabander, De Boever, Vanacker, Boucqué and Botterman1999):

where a = 0.90 to 1.3 × starch resistance, and NDF, USt, DSt and SU are expressed in g/kg of DM. De Brabander (Reference De Brabander2006) calculated the SV for some commonly used concentrates and supplements using the regression equation above. In this way, the SV of soya bean meal and unmolassed sugar beet pulp were estimated at 0.18 and 0.42/kg of DM, respectively. The SV of straw is 4.30 (De Brabander et al., Reference De Brabander, De Boever, Vanacker, Boucqué and Botterman1999; De Brabander, Reference De Brabander2006). From De Brabander et al. (Reference De Brabander, De Boever, Vanacker, Boucqué and Botterman1999) and De Brabander (Reference De Brabander2006) and from the composition of Nutex Compact, we set the SV of Nutex Compact, urea, mineral and vitamin mix and vitamin E preparation at 0.
The SV of the diet is the sum of the SV of the balanced ingredients.
Statistical analysis
Data for nutrient intake, milk yield and composition, milk FA composition and milk CLA isomer composition are reported as least squares means ± s.e. Data were analysed as a crossover using the mixed procedure of SAS (version 9.1.3; SAS Institute Inc., Cary, NC, USA). The statistical model included period, group, cow and diet. The fixed effects included period, group and diet. Cow was the random effect. Overall differences between treatment means were considered to be significant when P < 0.05. The model used was

where Yijk = performance during the kth period of the jth cow in the ith group; μ = overall mean effect; cowij = effect of the jth cow on the ith group (i = 1, 2 and j = 1, 2, …, 6), cowij N(0, σ 2cow); periodk = effect of the kth period (k = 1, 2); dietik = effect of the treatment in the kth period in the ith group and eijk = random error, eijk N(0, σ 2e).
Results
Experimental diets
The DM content and chemical composition of individual feedstuffs are presented in Table 1. 18:2n-6 was the predominant C18 FA in the maize silage and accounted for 49% of the total FA, whereas 18:3n-3 was the predominant C18 FA in Nutex Compact and accounted for 53% of the total FA.
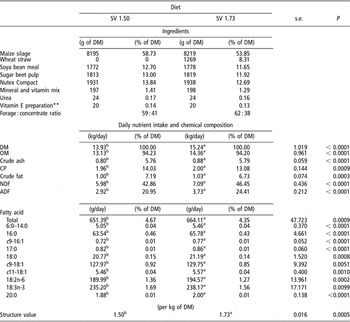
The ingredients and chemical composition of the two experimental diets are given in Table 2. The inclusion of straw in the diet (8.31% of DM) consequently modified the proportion of maize silage (−4.88% of DM), soya bean meal (−1.05% of DM), sugar beet pulp (−1.08% of DM) and Nutex Compact (−1.15% of DM) in the diet, therefore modifying the F : C ratio from 59 : 41 to 62 : 38 (Table 2). The NDF content of the ‘SV 1.73’ diet was slightly higher than that for the ‘SV 1.50’ diet (46.45% v. 42.86% of DM, respectively), whereas the total FA content was quite similar for both diets (4.35% and 4.67% of DM, respectively, for the ‘SV 1.73’ and ‘SV 1.50’ diets).
Ingredients, chemical composition and daily nutrient intake of cows fed the two experimental dietsFootnote *

DM = dry matter; OM = organic matter.
a,b Values within a row with different superscripts differ.
* Diets offered to the cows were entirely consumed (no refusals).
** Distributed in the form of a powder containing 50% of all-rac-α-tocopheryl acetate (Roche Co., Brussels, Belgium) added to the concentrates; the amount was calculated to deliver 10 000 IU/day of unprotected vitamin E to the diet.
Nutrient intake
The daily nutrient intake of cows fed the two experimental diets is summarised in Table 2. The total FA intakes amounted to 651 and 664 g/day for the ‘SV 1.50’ and ‘SV 1.73’ diets, respectively. For both diets, the predominant FA were 18:3n-3, 18:2n-6 and c9-18:1, which accounted for 36%, 29% and 20% of the total FA intake, respectively.
The inclusion of straw in the ‘SV 1.73’ diet depressed the protein and fat contents of the diet but the fibre and ash contents were increased (Table 2). The intake of each of the nutrients for the ‘SV 1.73’ diet was higher (P < 0.01) than that for the ‘SV 1.50’ diet. However, the additional intakes were low for crude ash, CP, crude fat and total FA (+80, +40, +30 and +13 g/day, respectively) and could be considered as having no biological significance in spite of having statistical significance. By contrast, the additional intake of NDF was more important (+1110 g/day) and accounted for 90% of the additional intake of OM (+1230 g/day). The choice of straw as an additional structure source was thus appropriate since it essentially provided fibre. As a consequence, the SV of the ‘SV 1.73’ diet was higher than that of the ‘SV 1.50’ diet (P < 0.001) without being dramatically different and both SV were higher than the minimum required (1/kg of DM) to avoid MFD, as set out in the objective of this experiment. The calculated energy balance of the cows was evaluated by using INRAtion software (version 3.21; INRA, Paris, France) according to cow parity, BW and stage of lactation, milk yield and composition, chemical analyses of the individual feedstuffs and amounts of individual feedstuffs really consumed by the cows. For the ‘SV 1.50’ and ‘SV 1.73’ diets, respectively, 95% and 100% of energy needs were covered. Consistent with the calculated energy balance, the cows did not lose weight during the experiment (616 ± 67.9 v. 607 ± 62.4 kg of BW, respectively, at the end and at the onset of the experiment).
Milk yield and composition
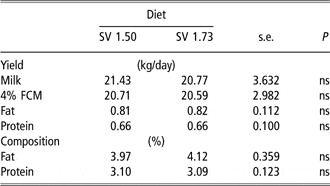
Milk yield and composition of cows fed the two experimental diets are shown in Table 3. Milk, fat and protein yields did not differ among treatments (P > 0.05) and averaged 21.10, 0.82 and 0.66 kg/day, respectively. The additional intake of NDF in the ‘SV 1.73’ diet was provided by straw, which is not well digested (apparent digestibility of NDF of 47%; INRA, 2007). This could explain why milk yield did not differ. Fat and protein contents did not differ among treatments (P > 0.05) and averaged 4.05% and 3.10%, respectively. These two diets were thus not MFD-inducing even though they were supplemented with 4.35% and 4.67% of FA (for the ‘SV 1.73’ and ‘SV 1.50’ diets, respectively, DM basis). On the contrary, Loor et al. (Reference Loor, Ferlay, Ollier, Doreau and Chilliard2005) reported a drop in milk fat concentration for 35 : 65 compared to 65 : 35 F : C ratio diets supplemented with 3% linseed oil (DM basis).
Milk yield and composition of cows fed the two experimental diets

ns = non-significant (P > 0.05).
Milk fatty acid composition
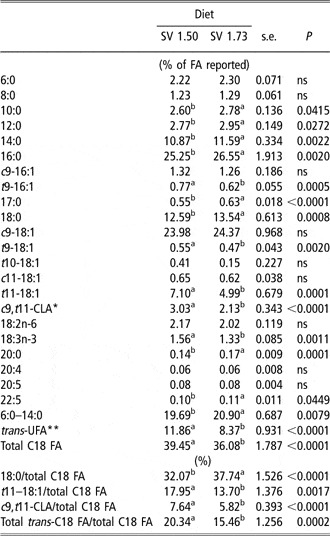
Milk FA profiles of cows fed the two experimental diets are shown in Table 4. The highest concentration of c9,t11-CLA in milk fat was obtained with the ‘SV 1.50’ diet and amounted to 3.03% of FA reported. The inclusion of straw in this diet decreased the concentrations of c9,t11-CLA (2.13% v. 3.03% of FA reported, P < 0.001), t11-18:1 (4.99% v. 7.10% of FA reported, P < 0.001) and the total trans-unsaturated fatty acids (UFA) (8.37% v. 11.86% of FA reported, P < 0.001) in milk fat. The same observation could be made for 18:3n-3 (1.33% v. 1.56% of FA reported, P < 0.01), t9-16:1 (0.62% v. 0.77% of FA reported, P < 0.001) and t9-18:1 (0.47% v. 0.55% of FA reported, P < 0.01). By contrast, the inclusion of straw in the diet increased the concentrations of 6:0–14:0 (20.90% v. 19.69% of FA reported, P < 0.01), 16:0 (26.55% v. 25.25% of FA reported, P < 0.01), 18:0 (13.54% v. 12.59% of FA reported, P < 0.001), 17:0 (0.63% v. 0.55% of FA reported, P < 0.001), 20:0 (0.17% v. 0.14% of FA reported, P < 0.001) and 22:5 (0.11% v. 0.10% of FA reported, P < 0.05) in milk fat. The inclusion of straw in the diet did not affect (P > 0.05) the levels of t10-18:1, 18:2n-6, c9-16:1, c9-18:1, c11-18:1, 6:0, 8:0, 20:4 and 20:5 in milk fat.
Milk fatty acid composition of cows fed the two experimental diets

CLA = conjugated linoleic acid; FA = fatty acid.
a,bValues within a row with different superscripts differ. Values with no superscript do not differ significantly.
ns = non-significant (P > 0.05).
*The GC analysis was unable to separate the minor quantities of t7,c9 and t8,c10-CLA isomers from the main c9,t11-CLA isomer.
**trans-UFA = t9-16:1+t9-18:1+t10-18:1+t11-18:1+c9,t11-CLA.
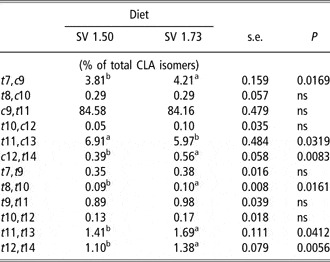
Table 5 shows the milk CLA isomer profiles of cows fed the two experimental diets. The inclusion of straw in the diet decreased the concentration of t11,c13-CLA (5.97% v. 6.91% of total CLA isomers, P < 0.05) in milk fat CLA. By contrast, inclusion of straw increased the concentrations of t7,c9 (4.21% v. 3.81% of total CLA isomers, P < 0.05), c12,t14 (0.56% v. 0.39% of total CLA isomers, P < 0.01); t8,t10 (0.10% v. 0.09% of total CLA isomers, P < 0.05); t11,t13 (1.69% v. 1.41% of total CLA isomers, P < 0.05) and t12,t14-CLA (1.38% v. 1.10% of total CLA isomers, P < 0.01) in milk fat CLA. The inclusion of straw in the diet did not affect (P > 0.05) the levels of t8,c10; c9,t11; t10,c12; t7,t9; t9,t11 and t10,t12-CLA in milk fat CLA.
Milk conjugated linoleic acid (CLA) isomer composition of cows fed the two experimental diets

a,bValues within a row with different superscripts differ. Values with no superscript do not differ significantly.
ns = non-significant (P > 0.05).
Discussion
The concentrations of c9,t11-CLA and t11-18:1 in milk fat obtained with the ‘SV 1.50’ diet (3.03% and 7.10% of FA reported, respectively) were relatively high compared to those obtained so far in other studies aiming at increasing the CLA content in milk fat (Kelly et al., Reference Kelly, Berry, Dwyer, Griinari, Chouinard, Van Amburgh and Bauman1998; Dhiman et al., Reference Dhiman, Satter, Pariza, Galli, Albright and Tolosa2000; Loor et al., Reference Loor, Ferlay, Ollier, Doreau and Chilliard2005). However, we should bear in mind that FA values were overestimated since they were expressed as a percentage of FA reported and not as a percentage of total FA. Also, factors other than diets (e.g. stage of lactation) may explain minor differences among studies. According to our previous experiments, when there is no MFD, experimental periods of 21 days are sufficient to obtain a complete view of the milk FA responses to lipid supplements and basal diet changes. Bell et al. (Reference Bell, Griinari and Kennelly2006) (values taken over an 8-week treatment period) and Roy et al. (Reference Roy, Ferlay, Shingfield and Chilliard2006) (values taken 18 days after the start of the lipid supplementation) also obtained in their experiments high concentrations of c9,t11-CLA (2.80% and 2.89% of total FA, respectively) and t11-18:1 (6.67% and 7.49% of total FA, respectively) associated with low levels of t10-18:1 (0.63% and 0.70% of FA, respectively). Interestingly enough, the ‘SV 1.50’ diet in the present experiment and the ‘FLAX/E’ diet in that of Bell et al. (Reference Bell, Griinari and Kennelly2006) used a similar F : C ratio (59 : 41 and 60 : 40, respectively) and dietary NDF content (42.86% and 45.30% of DM, respectively) and both diets were supplemented with vitamin E and a source of 18:3n-3 (7.75% extruded linseed and 6.00% linseed oil, respectively, DM basis). In order to take into account differences in the forage and energy sources, the SV of the ‘FLAX/E’ diet of Bell et al. (Reference Bell, Griinari and Kennelly2006) was estimated (based on De Brabander, Reference De Brabander2006 and INRA feed tables of INRA, 2007) and amounted to 1.56/kg of DM, which was very similar to the SV of the ‘SV 1.50’ diet in the present experiment. Although the F : C ratio in the ‘H-L’ diet in the experiment of Roy et al. (Reference Roy, Ferlay, Shingfield and Chilliard2006) was higher than that in the present experiment (64 : 36 v. 59 : 41, respectively), their dietary NDF content was close to that of the ‘SV 1.50’ diet in the present experiment (40.70% v. 42.86% of DM, respectively) and the ‘H-L’ diet was also supplemented with a high level of 18:3n-3 (5.20% linseed oil, DM basis) as in the present experiment. However, we were not able precisely to estimate the SV of the ‘H-L’ diet in the experiment of Roy et al. (Reference Roy, Ferlay, Shingfield and Chilliard2006) because the grass hay NDF content was not available.
Much lower concentrations of CLA were reported in the experiments of Pottier et al. (Reference Pottier, Focant, Debier, De Buysser, Goffe, Mignolet, Froidmont and Larondelle2006) (values taken on day 21 of each period), Dhiman et al. (Reference Dhiman, Satter, Pariza, Galli, Albright and Tolosa2000) (mean values taken from weeks 2 to 5) and Kelly et al. (Reference Kelly, Berry, Dwyer, Griinari, Chouinard, Van Amburgh and Bauman1998) (mean values taken from day 11 to day 14). These concentrations amounted, respectively, to 1.14% (c9,t11-CLA), 1.63% (CLA) and 1.67% (CLA) of FA and were associated with MFD, except for the ‘linseed + vitamin E’ diet in Pottier et al. (Reference Pottier, Focant, Debier, De Buysser, Goffe, Mignolet, Froidmont and Larondelle2006) where vitamin E was added. All these diets had a similar low dietary NDF content (26.62%, 28.30% and 29.10% of DM, respectively) and were supplemented with a source of 18:3n-3 (5.83% extruded linseed + 0.99% linseed oil, 4.4% linseed oil and 5.3% linseed oil, respectively, DM basis). Besides, Sauvant et al. (Reference Sauvant, Meschy and Mertens1999) suggested that diets should contain a minimum of 35% NDF (DM basis) to avoid rumen acidosis. The SV of the ‘linseed + vitamin E’ diet in Pottier et al. (Reference Pottier, Focant, Debier, De Buysser, Goffe, Mignolet, Froidmont and Larondelle2006) was calculated precisely, the NDF content of the maize silage being available (403 g/kg of DM, unpublished data), and amounted to 1.01/kg of DM, which was very close to the minimum required SV of 1/kg of DM. Here again, we were not able to precisely estimate the SV of the diets in the experiments of Dhiman et al. (Reference Dhiman, Satter, Pariza, Galli, Albright and Tolosa2000) and Kelly et al. (Reference Kelly, Berry, Dwyer, Griinari, Chouinard, Van Amburgh and Bauman1998). However, we can reasonably assume that the lower dietary NDF contents in the experiments of Dhiman et al. (Reference Dhiman, Satter, Pariza, Galli, Albright and Tolosa2000) and Kelly et al. (Reference Kelly, Berry, Dwyer, Griinari, Chouinard, Van Amburgh and Bauman1998), as compared to those in the present experiment and in that of Bell et al. (Reference Bell, Griinari and Kennelly2006) (28.30% and 29.10% v. 42.86% and 45.30% of DM, respectively) contributed to lower the SV.
Loor et al. (Reference Loor, Ferlay, Ollier, Doreau and Chilliard2005) reported a decrease in milk c9,t11-CLA concentration with a 65 : 35 F : C diet compared to a 35 : 65 F : C diet. Both diets were supplemented with 3% linseed oil and contained 43.30% and 32.80% NDF, respectively (DM basis). Similarly, in the present experiment, a decrease in milk c9,t11-CLA concentration was observed for the higher F:C diet. However, in contrast to the experiment of Loor et al. (Reference Loor, Ferlay, Ollier, Doreau and Chilliard2005), milk fat yield was not affected in our experiment. Interestingly enough, the dietary NDF content of the lower F : C diet in Loor et al. (Reference Loor, Ferlay, Ollier, Doreau and Chilliard2005) was slightly below the minimum of 35% suggested by Sauvant et al. (Reference Sauvant, Meschy and Mertens1999) to avoid rumen acidosis.
In our experiment, both SV were higher than the minimum required to avoid acidosis and MFD. Although we did not measure the rumen pH, we can reasonably assume that the inclusion of 8.31% of straw (DM basis) in the ‘SV 1.73’ diet, which resulted in higher dietary NDF and ADF contents (46.45% and 24.41% v. 42.86% and 20.95% of DM, respectively, for the ‘SV 1.73’ and ‘SV 1.50’ diets) and therefore higher SV, may have led to an increase in chewing activity, which in turn may have raised the rumen pH. Higher rumen pH has been demonstrated to be linearly and positively associated with higher dietary NDF or ADF, although this relationship was rather poor (Le Ruyet et al., Reference Le Ruyet, Tucker, Hogue, Aslam, Lema, Shin, Miller and Adams1992; Mertens, Reference Mertens1997; Kolver and de Veth, Reference Kolver and de Veth2002). A stronger and positive relationship between the rumen pH and dietary physically effective NDF, a more specific measure of effective fibre, has been reported (r 2 = 0.71, Mertens, Reference Mertens1997; r 2 = 0.67, Zebeli et al., Reference Zebeli, Tafaj, Steingass, Metzler and Drochner2006). Besides, De Brabander (Reference De Brabander2006) showed that the replacement of maize silage with 7% straw (DM basis) in a maize silage-based diet had the same effect as an addition of 400 g/day sodium bicarbonate to the same diet in maintaining the rumen pH. Choi et al. (Reference Choi, Imm, Oh, Kim, Hwang and Kim2005) showed that the pH had a marked influence on the biohydrogenation by rumen bacteria. Adhesion of rumen cellulolytic bacteria to cellulose is a necessity for subsequent cellulose digestion and is reduced by even modest declines in pH, whereas, under neutral pH, cellulose digestion is optimal and the growth of cellulolytic bacteria is maximum (Miron et al., Reference Miron, Ben-Ghedalia and Morrison2001; Mouriño et al., Reference Mouriño, Akkarawongsa and Weimer2001; Choi et al., Reference Choi, Imm, Oh, Kim, Hwang and Kim2005). According to this mechanism, the likely higher pH with the ‘SV 1.73’ diet may have enhanced the adhesion of cellulolytic bacteria to cellulose, boosting cellulose digestion and, hence, the growth of cellulolytic bacteria. According to the hypothesis of an amplified growth of cellulolytic bacteria in the ‘SV 1.73’ diet, the milk concentration of 17 : 0, an odd-chain FA derived from bacteria leaving the rumen, was 15% higher (0.63% v. 0.55% of FA reported, P < 0.001). Increasing the dietary NDF has already been reported to result in a higher proportion of milk odd- and branched-chain FA (Sauvant and Bas, Reference Sauvant and Bas2001; Vlaeminck et al., Reference Vlaeminck, Fievez, Cabrita, Fonseca and Dewhurst2006). Since the main rumen biohydrogenating bacteria are cellulolytic (Harfoot and Hazlewood, Reference Harfoot and Hazlewood1997), rumen biohydrogenation may have been more complete following the inclusion of additional dietary NDF. This may have resulted in rumen biohydrogenation going all the way to the 18:0, thus allowing fewer intermediates to escape.
Besides the pH hypothesis, Gerson et al. (Reference Gerson, John and King1985) found that decreasing the dietary fibre content and increasing that of starch led to a reduction in the biohydrogenation rate and to an increased concentration of t11-18:1 at the expense of 18:0 in the sheep rumen digesta. Gerson et al. (Reference Gerson, King, Kelly and Kelly1988) suggested that the biohydrogenation rate increased when increasing the particle surface area and subsequently the number of cellulolytic bacteria adhering to it. Similarly, in our experiment, the inclusion of 8.31% of straw (DM basis) in the ‘SV 1.73’ diet probably provided more particles as biohydrogenation sites, thus putatively increasing the number of cellulolytic bacteria adhering to them.
The pH and particles hypotheses described above may be the explanations for the decreased milk levels of c9,t11-CLA and t11-18:1 and the increased milk level of 18:0 in the ‘SV 1.73’ diet compared to the ‘SV 1.50’ diet.
The ‘HLO 70’ diet of Flachowsky et al. (Reference Flachowsky, Erdmann, Hüther, Jahreis, Möckel and Lebzien2006) used an F : C ratio of 70 : 30 with a dietary NDF content of 49.38% of DM and 1.5% linseed oil supplementation (DM basis). The SV of the ‘HLO 70’ diet was estimated based on De Brabander (Reference De Brabander2006) and amounted to 2.69/kg of DM, which was much higher than that of the ‘SV 1.73’ diet in the present experiment. The milk CLA content of the ‘HLO 70’ diet of Flachowsky et al. (Reference Flachowsky, Erdmann, Hüther, Jahreis, Möckel and Lebzien2006) (values taken in the third week of each period) was very low (0.49% of fat) and may have been the result of a very high diet SV associated with a low 18:3n-3 supplementation.
The various ratios of C18 FA to the total C18 FA in milk fat also reflected the difference in rumen biohydrogenation for the two diets of the present experiment (Table 4). The 18:0/total C18 FA ratio was higher for the ‘SV 1.73’ diet (37.74% v. 32.07%, P < 0.001). By contrast, the total trans-C18 FA/total C18 FA ratio was lower for the ‘SV 1.73’ diet (15.46% v. 20.34%, P < 0.001) and so were the t11-18:1/total C18 FA ratio (13.70% v. 17.95%, P < 0.01) and, hence, the c9,t11-CLA/total C18 FA ratio (5.82% v. 7.64%, P < 0.001). This approach can be considered valid since duodenal concentrations of C18 FA followed similar changes as those in milk fat (Loor et al., Reference Loor, Ferlay, Ollier, Doreau and Chilliard2005; Glasser et al., Reference Glasser, Doreau, Ferlay, Loor and Chilliard2007). All these results strongly suggest that the additional intake of NDF (+1110 g/day) due to straw inclusion resulted in rumen biohydrogenation being more complete.
The inclusion of straw in the diet was associated with an increase in short- and medium-chain FA in milk. The NDF content of the diet increased from 42.86% to 46.45% of DM and may have orientated the bacterial fermentations towards the production of acetate, which was further utilised for de novo synthesis of 6:0–16:0 (Bauman and Griinari, Reference Bauman and Griinari2003). Accordingly, Le Ruyet et al. (Reference Le Ruyet, Tucker, Hogue, Aslam, Lema, Shin, Miller and Adams1992) showed that a 21% dietary ADF content increased rumen acetate compared to a 16% dietary ADF content. Similarly, Loor et al. (Reference Loor, Ferlay, Ollier, Doreau and Chilliard2005) reported a decrease in plasma acetate and milk 8:0–16:0 yield with high-concentrate diets, regardless of the oil supplementation.
In the present experiment and consistent with the literature (for a review see Bauman et al., Reference Bauman, Corl and Peterson2003), c9,t11-CLA was the most abundant CLA isomer in milk fat and accounted for more than 84% of total CLA isomers, regardless of the diet (Table 5). The second most prevalent CLA isomer in milk fat is usually t7,c9-CLA (Corl et al., Reference Corl, Baumgard, Griinari, Delmonte, Morehouse, Yurawecz and Bauman2002; Piperova et al., Reference Piperova, Sampugna, Teter, Kalscheur, Yurawecz, Ku, Morehouse and Erdman2002; Bauman et al., Reference Bauman, Corl and Peterson2003), whereas in our experiment t11,c13-CLA was the second, regardless of the diet. The t7,c9 CLA isomer is also derived almost exclusively from endogenous synthesis via the Δ9-desaturase using rumen t7-18:1 as a substrate (which explains its classical second position among CLA isomers), whereas the other CLA isomers are produced in the rumen (Piperova et al., Reference Piperova, Sampugna, Teter, Kalscheur, Yurawecz, Ku, Morehouse and Erdman2002; Bauman et al., Reference Bauman, Corl and Peterson2003). Interestingly enough, t11,c13-CLA is also the second most important CLA in milk fat from cows grazing mountain pasture, which is rich in 18:3n-3 (Kraft et al., Reference Kraft, Collomb, Mockel, Sieber and Jahreis2003; Collomb et al., Reference Collomb, Sieber and Butikofer2004) and in milk fat from cows receiving hay and linseed oil (Roy et al., Reference Roy, Ferlay, Shingfield and Chilliard2006). Moreover, a high correlation was found between the intake of 18:3n-3 and t11,c13-CLA (Collomb et al., Reference Collomb, Sieber and Butikofer2004). Similarly, in our experiment, the second position of t11,c13-CLA may be related to high amounts of 18:3n-3 provided by extruded linseed.
The means whereby the inclusion of straw differently affected the concentrations of t11,c13; t7,c9; c12,t14; t8,t10; t11,t13 and t12,t14-CLA isomers remain unclear.
Conclusion
The concept of diet SV, which includes rumen buffering and acidotic effect, was used as a tool for studying milk CLA responses in cows fed different basal diets supplemented with PUFA. More specifically, the present study showed that even a modest increase in SV to a diet supplemented with extruded linseed, yet already providing enough SV to ensure normal rumen function and therefore with no MFD effect, led to decreases in milk c9,t11-CLA and t11-18:1 contents, whereas milk fat yield and milk t10-18:1 content were not affected. This suggests a more complete rumen biohydrogenation going all the way to the 18:0, thus allowing fewer intermediates to escape. All this leads us to hypothesise that rumen lipid metabolism can be differently affected depending on the diet SV. On the one hand, if the diet SV is too low to ensure normal rumen function, rumen biohydrogenation pathways are altered and induce MFD. On the other hand, our study has shown that, in a non-MFD situation, a modest increase in SV can result in rumen biohydrogenation being more complete. This suggests that there may be an optimal range of diet SV enhancing the milk CLA content, for a given supplementation of PUFA. However, further research is needed to confirm this hypothesis.
Acknowledgments
The authors acknowledge the General Directorate of Agriculture of the Ministry of the Walloon Region of Belgium (Project D31-1069A) for their financial support. We also acknowledge the Institute of Statistics of the Université catholique de Louvain for their advice and Dr. Roger A. Clegg for his careful reading of the manuscript.